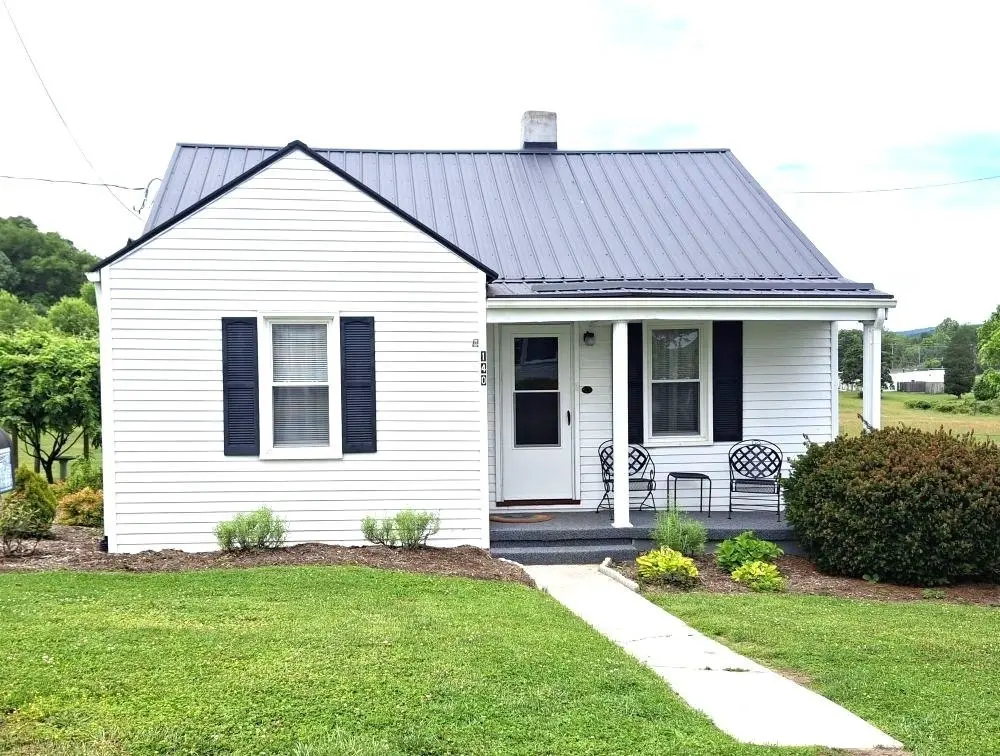
140 Pinehurst Ave · Peterstown, WV
Flood risk 1/10 · Minimal
- FEMA flood zone
- X (unshaded)
- Chance of flooding over 30 yrs
- 0.0%
- Est. flood insurance / yr
- $473 – $860
Fire risk 3/10 · Minor
- Est. fire insurance / yr
- $666 – $1,236
Heat risk 4/10 · Minor
- Hot days now (above 93°F)
- 7 days/yr
- Hot days in 30 yrs
- 22 days/yr
Wind risk 2/10 · Minimal
- Chance of severe wind over 30 yrs
- 0.0%
Air-quality risk 1/10 · Minimal
- Unhealthy air days now
- 0 days/yr
- Unhealthy air days in 30 yrs
- 0 days/yr
Risk factors via First Street. Map © Google.
Why this score? — see what drove the D grade
The composite is a weighted blend of 9 inputs, each scored 0–100. Each bar is that input's sub-score; the figure is the points it added to the 100-point composite (weight × sub-score).
- Cash flow +9.4/30.0
- Appreciation +8.0/10.0
- ARV discount +7.5/15.0
- Schools +5.2/10.0
- Livability +3.1/5.0
- DSCR +2.6/10.0
- Rent growth +2.5/5.0
- Condition / age +2.5/5.0
- 1% rule +1.5/10.0
$135,000
🖨 Deal sheet (PDF) 📄 Offer letter ✓ Due diligence
Listing remarks
Adorable Ranch with lots of updates! Roof only 2+/- yrs old. Gas furnace & Central Air only 5+/- yrs old. Great level yard w/ beautiful landscaping. Grow your own beautiful flowers in the Greenhouse complete with solar fan & electric. Lots of parking with Detached Garage & large carport w/ paved drive. This home is a must see!!
Key facts
- Level yard
- Solar fan
- Large carport
Tags
Property features AI
Finance
- Financial info: $591 annual tax (provided)
Exterior
- Parking: Detached parking on asphalt surface
- Utilities: Public water; Public sewer
- Home design: Single-family detached residence; One level / single-story; Vinyl siding
- Construction: Metal roof
- Exterior features: Deck; Porch
Interior
- Kitchen: Electric range; Refrigerator
- Bedrooms: 5 total rooms (bedroom count not separately listed)
- Flooring: Carpet; Hardwood; Vinyl
- Bathrooms: 1 full bathroom
- Heating & cooling: Natural gas heating; Central air conditioning
- Interior features: Electric water heater; Concrete basement with sump pump; Garden
- Laundry & utility: No specific washer/dryer listed
Neighborhood map
What this means for you Summary
Snapshot
- This is a 2-bed/1.0-bath single-family listed at $135k.
Deal economics
- At list price, monthly cash flow is $-96 ($-1k/yr) — negative.
- To cash-flow at today's rent, offer at most $118k (12.6% below list).
- To meet the 1% rule (rent ≥ 1% of price), the offer needs to be $88k (34.5% below list).
- Recommended offer: $88k (34.5% below list) — sets the bar for 1% rule.
Location & tenants
- Location reads 61/100 on livability (#205 in WV) — a middle-class / working-renter tenant base. Strengths: cost of living A+, housing A+, crime B; Watch: amenities F, commute F, employment F.
- Giles County Public School District (rural): math 56% / reading 68% proficiency, ranked #54 of 131 in VA (top 41%) — acceptable for families but not a draw, mixed tenant base, ~2y average lease.
- Zoned schools: Narrows Elementary/Middle (math 60% / reading 66%, grade B, #470 of 1,108 statewide, top 43%, 859 students, 39% FRL); Narrows High (math 57% / reading 72%, grade B-, #213 of 319 statewide, top 69%, 411 students, 35% FRL) — zoned schools at 37% FRL track the district average.
- Market conditions: 25 units permitted in Giles County in 2024 (0 in 5+ unit buildings).
Forward outlook
- In year one you build about $9k of equity ($933 loan paydown + $8k appreciation (6.0% local appreciation)).
- Giles County population projected at -18% by 2050 — secular population decline; favor cash flow + early exit over multi-decade hold.
- By year 4, paydown + projected appreciation supports a ~$31k cash-out refi (75% LTV) — recoverable capital for the next deal without selling this one.
Negotiation context
- Only 6 days on market — expect competitive offers; lowballing is unlikely to land.
Risks & watch-outs
- Watch-outs: built in 1946 — expect roof / HVAC / electrical / plumbing capex.
Questions for the listing agent
- What do current leases actually rent for vs. the listed asking? Can we see a recent rent roll and the last 12 months of T-12 income?
- Built in 1946 — when were the roof, HVAC, electrical panel, plumbing, and water heater last replaced?
- Is there a deadline driving the sale (1031 exchange, divorce, estate, relocation)? That informs how much negotiation room exists.
- Schools are F-rated, which usually means shorter tenancies and higher turnover. Who's the typical renter profile here, and what's been the actual vacancy rate?
- The area grade is low — what's the realistic commute time and amenity access for the typical tenant pool here? Any planned neighborhood developments (good or bad) we should know about?
- What's the average days-on-market for RENTAL listings here right now (not sales)? A rising rental-DOM trend means longer vacancies and softer asking-rent achievability than the comps imply.
- What's the recent tenant-quality profile in this submarket — average credit score on applications, eviction rate, late-payment / NSF rate, and stable-employment percentage? A property-management company in the area should have these aggregated.
- How much new for-sale + rental construction is in the pipeline within 1–3 miles? Heavy new supply typically softens prices + rents 12–24 months out; constrained supply supports both.
Investment metrics
- 1% rule
- 0.65% ✗
- Cap rate
- 5.44%
- Cash-on-cash
- -3.05%
- DSCR
- 0.86
- GRM
- 12.7
CMA / ARV
- ARV (on-the-fly)
- $82,628
- Comps found
- 1
Show comp detail 1 sale within ~0.75 mi
| Address | Dist | Beds/Ba | Sqft | Sold | Price | $/sf | Match |
|---|---|---|---|---|---|---|---|
| 122 Jefferson St | 0.15mi | 2/1.0 | 1,006 (+11%) | 13mo | $92,000 | $91 | 64 |
Match score weights: distance 35% · size 25% · config 20% · recency 20%. Top-matched comps best support the ARV.
Projected returns pro-forma
6.04% appreciation · 3.0% rent growth · sell at horizon
- IRR
- 13.0%
- Equity multiple
- 1.88×
- Total profit
- $33,076
- Equity at exit
- $85,165
- IRR
- 13.5%
- Equity multiple
- 3.69×
- Total profit
- $101,854
- Equity at exit
- $154,700
Cash invested: $37,800 (down + closing). Projections, not guarantees.
Landlord ↔ Tenant lean methodology
- Overall (STATE)
- 83 Strongly Landlord-Friendly
- State West Virginia
- 83 Strongly Landlord-Friendly · R+22
- County
- — inherits STATE
- City
- — inherits STATE
ZIP-level market 24124
- Home prices YoY
- 3.1%
- Price-to-rent
- 12.7×
Monthly cashflow live
- Estimated rent
- $884 medium interval (Pro) →
- Mortgage (P&I)
- −$708
- Tax from tax record
- −$30 /mo · $361/yr
- Insurance
- −$56
- HOA
- −$0
- Vacancy / Maint / Mgmt
- −$186
- Net cashflow
- $-96
Break-even live
Sensitivity live
| Price | -10% $-20 | -5% $-58 | +0% $-96 | +5% $-134 | +10% $-172 |
|---|---|---|---|---|---|
| Rent | -10% $-166 | -5% $-131 | +0% $-96 | +5% $-61 | +10% $-26 |
| Rate | -1.0pp $-28 | -0.5pp $-62 | base $-96 | +0.5pp $-131 | +1.0pp $-167 |
UW: 25.0% down · 7.5% · 30yr · 1.5% tax · 5.0% vac · 8.0% maint · 8.0% mgmt
Financing live
Cash to close
- Down payment
- $33,750
- Closing costs
- $4,050
- Reserves months
- —
- Total cash needed
- —
Loan-product check · same deal, 3 products live
Conventional
25% down · 7.5% · 30yr
- Down + closing
- —
- Monthly P&I
- —
- Monthly cashflow
- —
- DSCR
- —
- Eligible?
- —
Personal DTI + credit; lowest rate.
DSCR
20% down · 8.5% · 30yr
- Down + closing
- —
- Monthly P&I
- —
- Monthly cashflow
- —
- DSCR
- —
- Eligible?
- —
No personal income docs; deal must DSCR.
Hard money
10% down · 12.0% · 12mo
- Down + closing
- —
- Monthly P&I
- —
- Monthly cashflow
- —
- DSCR
- —
- Eligible?
- —
Short-term bridge; refi at stabilization.
Listing history 5 events
-
2026-06-09statusdays on market $135,000 Pending 6 DOM
-
2026-06-08days on market $135,000 Active 5 DOM
-
2026-06-07days on market $135,000 Active 4 DOM
-
2026-06-03remarks 336-char remark
-
2026-06-03$135,000 Active 1 DOM
ⓘ Source: listings_history table (triggers on properties + properties_extension) + one-shot
backfill from property_details.listing_events for pre-trigger history.
Tax reassessment forecast WV · Resets to sale price
- Current annual tax
- $361 · $30/mo
- Projected year-2 tax
- $796 · $66/mo
- Expected delta
- +$435/yr (+$36/mo · 120.6%)
ⓘ Screening estimate from a state-policy table — verify with the county assessor before closing.
Climate risk First Street
- Flood 1/10 Low FEMA zone X (unshaded) · 0% chance over 30 yrs
- Wildfire 3/10 Moderate
- Heat 4/10 Moderate 7 d/yr ≥93°F today · 22 d/yr by 30 yrs out
- Wind 2/10 Low 0% chance of damaging wind over 30 yrs
- Air quality 1/10 Low 0 unhealthy d/yr today · 0 by 30 yrs out
Nearby sold comps map
Loading sold comps map…
Walkable amenities ~0.75 mi
Loading nearby amenities…
Taxation est. · year 1
- Rental income
- $10,608
- − Mortgage interest
- −$7,562
- − Property taxes
- −$361
- − Insurance
- −$675
- − Repairs & maintenance
- −$849
- − Management
- −$849
- − Depreciation
- −$3,927
- Taxable loss
- −$3,615
- Est. tax savings @ 24.0%
- +$868
- After-tax cash flow
- $-284/yr
For passive investors: Depreciation is non-cash, so a rental often shows a tax loss while cash-flowing — sheltering income. Rental losses are passive: they offset passive income freely, and up to $25,000/yr can offset ordinary (W-2) income if you actively participate and your MAGI is under $100k (phasing out to $0 by $150k); unused losses carry forward. On sale, claimed depreciation is recaptured at up to 25%, and gains may owe capital-gains tax (a 1031 exchange can defer both). Figures are a year-1 estimate at your 24.0% rate — not tax advice; consult a CPA.
Schools (NCES district)
- District
- Giles County Public School District
- NCES district ID
- 5101590
- Math proficiency
- 56% ▼ -26.00%
- Reading proficiency
- 68% ▼ -8.00%
- Median HH income
- $45,394
- Composite
- 52.25/100
- National rank
- #1600
- State rank
- #54 of 131 in VA
Livability — Peterstown
- Score
- 61/100
- State rank
- #205
- US rank
- #18147
Category grades
Schools grade is shown separately in the Schools card above.
Census & demographics
- Population (ZIP)
- 4,177
Population outlook (Giles County) Hauer SSP2
- Today (2025)
- 15,868 people
- By 2030
- 15,306 · -3.5%
- By 2040
- 14,149 · -10.8%
- By 2050
- 13,059 · -17.7%
- By 2075
- 10,837 · -31.7%
- By 2100
- 8,648 · -45.5%
Race, ethnicity, and origin ACS 2023
- Neighborhood character
- Predominantly White (94%)
- Race & ethnicity
- White 94% Two or more races 4% Hispanic / Latino 4%
- Common ancestry
- Slovak 2% Serbian 1% Iranian 1%
- Foreign-born
- 1% · Canada
- Languages at home
- 97% English-only · Spanish 3%
Political lean MEDSL · Giles
- 2024 margin
- Solid R (+54.5) · D 22.4% · R 76.9%
- 2008→2024 swing
- -38.2pp toward R · 2008: -16.3pp · 2024: -54.5pp
- All cycles
- 2024: R+54.5 2020: R+51.4 2016: R+48.6 2012: R+25.6 2008: R+16.3
Not yet ingested
- Civics
- —
Market trends
- HPI YoY
- ▲ 6.04%
- Current HPI
- 201.2028
- Rent YoY
- —
- Metro
- —
- State GDP YoY
- —
- F500 in state
- 0
Price history
1 event — show timeline
- 2026-06-03 Listed $135,000 NRVMLS
Property tax history
+1.4%/yrLatest (2025): $361 · +0.0% YoY. Source: county tax records.
Cash-flow waterfall
monthlySold comps — $/sqft
last 12 mo · ≤1 miLoading sold comps…