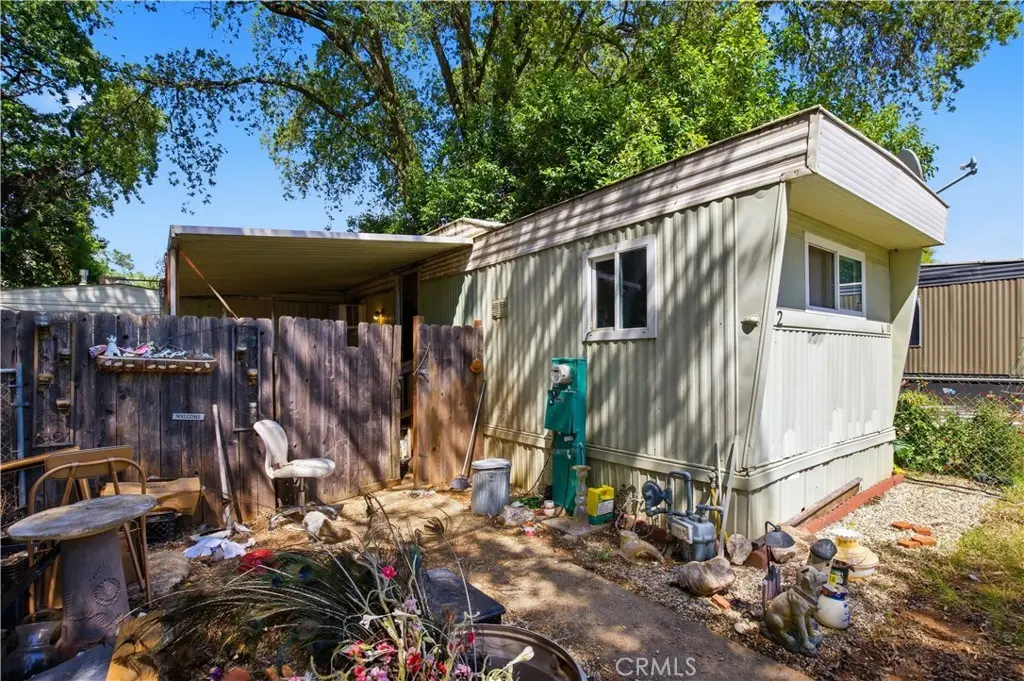
2465 Palermo #12 · Palermo, CA
Flood risk 1/10 · Minimal
- FEMA flood zone
- X (unshaded)
- Chance of flooding over 30 yrs
- 0.0%
- Est. flood insurance / yr
- $507 – $1,088
Fire risk 10/10 · Severe
- Est. fire insurance / yr
- $659 – $1,223
Heat risk 8/10 · Major
- Hot days now (above 105°F)
- 7 days/yr
- Hot days in 30 yrs
- 16 days/yr
Wind risk 1/10 · Minimal
- Chance of severe wind over 30 yrs
- —
Air-quality risk 10/10 · Severe
- Unhealthy air days now
- 32 days/yr
- Unhealthy air days in 30 yrs
- 37 days/yr
Risk factors via First Street. Map © Google.
Why this score? — see what drove the D+ grade
The composite is a weighted blend of 9 inputs, each scored 0–100. Each bar is that input's sub-score; the figure is the points it added to the 100-point composite (weight × sub-score).
- Cash flow +15.0/30.0
- ARV discount +7.5/15.0
- 1% rule +5.0/10.0
- DSCR +5.0/10.0
- Appreciation +4.5/10.0
- Rent growth +2.5/5.0
- Schools +2.5/10.0
- Condition / age +2.5/5.0
- Livability +2.4/5.0
$20,000
🖨 Deal sheet 📄 Offer letter ✓ Due diligence
Listing remarks
Discover the incredible potential at 2465 Palermo Road, Unit 12, in the beautiful all-ages Feather Falls Mobile Estates! This spacious 2-bedroom, 1-bath home sits on a large lot and is bursting with opportunity. Perfect for the handy buyer ready to roll up their sleeves — a little TLC and creativity will transform this into a fantastic home and build instant equity at the same time. Located in a well-kept community, you’re just minutes from Oroville’s gas stations, dining, and the excitement of the foothills and local casinos. Affordable space rent covers several utilities, keeping your monthly costs low. This is a rare chance to own for a fraction of the price of a tra
Key facts
- Built 1965
- Listed 52 days
Property features AI
Finance
- HOA & community: Land lease of $688 per month (seller provided); Community features: Foothills; Park: Feather Falls Mobile Estates
Exterior
- Parking: Located inside Feather Falls Mobile Estates
- Utilities: Public sewer; District/public water
- Home design: Single-story mobile home; Model LBL4241; Mobile home remains on site; Entry level: 1
- Construction: Mobile home approximately 10 ft by 50 ft; Year built per public records
- Exterior features: No pool; No landscaping
Interior
- Bathrooms: 1 full bathroom
- Heating & cooling: Wall heater; Wall/window cooling
- Interior features: Entry on the west side
- Laundry & utility: On-site laundry (see remarks)
Neighborhood map
What this means for you Summary
Snapshot
- This is a 2-bed/1.0-bath manufactured listed at $20k.
Deal economics
- At list price, monthly cash flow is $619 ($7k/yr) — positive.
- The deal already cash-flows at list — no discount required.
- Meets the 1% rule at list price ($938 rent vs $20k).
- Recommended offer: $19k (3.0% below list) — sets the bar for market timing.
- Cap rate 43.4% vs local median 3.8% in Palermo — top-decile yield for the area; either an underpriced asset or a hidden risk that comps aren't pricing in. Stress-test before assuming the spread holds.
Location & tenants
- Location reads 48/100 on livability (#1,219 in CA) — a working-class tenant base; expect higher turnover. Strengths: housing B+; Watch: schools F, crime F, amenities F.
- Palermo Union Elementary (town): math 20% / reading 33% proficiency, ranked #1,149 of 1,400 in CA (top 82%) — low school quality limits family demand, transient renter base, plan for 1-2y turnover; 72% free/reduced lunch — lower-income household profile, screen leases tightly.
- Market conditions: 10 active listings in the ZIP; 946 units permitted in Butte County in 2024 (254 in 5+ unit buildings).
Forward outlook
- Local home prices are declining (-1.0%/yr); year-one equity from $138 of loan paydown is wiped out by about $196 of value loss. Plan a longer hold.
- Butte County population projected at +10% by 2050 — modest demand growth; plan on rents tracking national, not racing it.
- At projected returns (-1.0% appreciation + 3.0% rent growth), your $6k cash investment doubles in ~1 year — after that, you're playing with house money.
Negotiation context
- It's been on market 53 days — a 3% lower offer ($19k) is reasonable based on typical stale-listing flexibility.
Risks & watch-outs
- Climate carrying-cost: severe wildfire risk; extreme-heat days projected 7→16/yr by 2055 (HVAC capex compounding) — expect insurance premiums to compound above CPI over the hold.
Questions for the listing agent
- It's been on market 53 days. Have you received any prior offers? Is the seller open to a 3% concession, seller financing, or rate buy-down credit?
- Built in 1965 — when were the roof, HVAC, electrical panel, plumbing, and water heater last replaced?
- Is there a deadline driving the sale (1031 exchange, divorce, estate, relocation)? That informs how much negotiation room exists.
- Schools are F-rated, which usually means shorter tenancies and higher turnover. Who's the typical renter profile here, and what's been the actual vacancy rate?
- Crime grade is F in this area — have there been break-ins, vandalism, or insurance claims at this property in the last 3 years? What carrier currently insures it and at what premium?
- The area grade is low — what's the realistic commute time and amenity access for the typical tenant pool here? Any planned neighborhood developments (good or bad) we should know about?
- What's the average days-on-market for RENTAL listings here right now (not sales)? A rising rental-DOM trend means longer vacancies and softer asking-rent achievability than the comps imply.
- What's the recent tenant-quality profile in this submarket — average credit score on applications, eviction rate, late-payment / NSF rate, and stable-employment percentage? A property-management company in the area should have these aggregated.
- How much new for-sale + rental construction is in the pipeline within 1–3 miles? Heavy new supply typically softens prices + rents 12–24 months out; constrained supply supports both.
Investment metrics
- 1% rule
- 4.69% ✓
- Cap rate
- 43.43%
- Cash-on-cash
- 132.64%
- DSCR
- 6.90
- GRM
- 1.8
CMA / ARV
No comps found within radius.
Projected returns pro-forma
-0.98% appreciation · 3.0% rent growth · sell at horizon
- IRR
- —
- Equity multiple
- 7.78×
- Total profit
- $37,942
- Equity at exit
- $4,848
- IRR
- —
- Equity multiple
- 16.26×
- Total profit
- $85,470
- Equity at exit
- $5,107
Cash invested: $5,600 (down + closing). Projections, not guarantees.
Landlord ↔ Tenant lean methodology
- Overall (STATE)
- 18 Strongly Tenant-Friendly
- State California
- 18 Strongly Tenant-Friendly · D+13
- County
- — inherits STATE
- City
- — inherits STATE
ZIP-level market 95968
- Home prices YoY
- -0.4%
- Active inventory
- 10
- Price-to-rent
- 1.8×
Monthly cashflow live
- Estimated rent
- $938 medium interval (Pro) →
- Mortgage (P&I)
- −$105
- Tax from tax record
- −$9 /mo · $108/yr
- Insurance
- −$8
- HOA
- −$0
- Vacancy / Maint / Mgmt
- −$197
- Net cashflow
- $619
Break-even live
UW: 25.0% down · 7.5% · 30yr · 1.5% tax · 5.0% vac · 8.0% maint · 8.0% mgmt
Financing live
Cash to close
- Down payment
- $5,000
- Closing costs
- $600
- Reserves months
- —
- Total cash needed
- —
Loan-product check · same deal, 3 products live
Conventional
25% down · 7.5% · 30yr
- Down + closing
- —
- Monthly P&I
- —
- Monthly cashflow
- —
- DSCR
- —
- Eligible?
- —
Personal DTI + credit; lowest rate.
DSCR
20% down · 8.5% · 30yr
- Down + closing
- —
- Monthly P&I
- —
- Monthly cashflow
- —
- DSCR
- —
- Eligible?
- —
No personal income docs; deal must DSCR.
Hard money
10% down · 12.0% · 12mo
- Down + closing
- —
- Monthly P&I
- —
- Monthly cashflow
- —
- DSCR
- —
- Eligible?
- —
Short-term bridge; refi at stabilization.
Listing history 17 events
-
2026-06-19days on market $20,000 Active 53 DOM
-
2026-06-18days on market $20,000 Active 52 DOM
-
2026-06-17days on market $20,000 Active 51 DOM
-
2026-06-16days on market $20,000 Active 50 DOM
-
2026-06-15days on market $20,000 Active 49 DOM
-
2026-06-14days on market $20,000 Active 47 DOM
-
2026-06-13days on market $20,000 Active 46 DOM
-
2026-06-10days on market $20,000 Active 44 DOM
-
2026-06-09days on market $20,000 Active 43 DOM
-
2026-06-08days on market $20,000 Active 42 DOM
-
2026-06-07days on market $20,000 Active 41 DOM
-
2026-06-05days on market $20,000 Active 38 DOM
-
2026-06-02days on market $20,000 Active 36 DOM
-
2026-06-01days on market $20,000 Active 35 DOM
-
2026-05-31days on market $20,000 Active 34 DOM
-
2026-05-30days on market $20,000 Active 33 DOM
-
2026-04-27$20,000 Active
ⓘ Source: listings_history table (triggers on properties + properties_extension) + one-shot
backfill from property_details.listing_events for pre-trigger history.
Tax reassessment forecast CA · Resets to sale price
- Current annual tax
- $108 · $9/mo
- Projected year-2 tax
- $152 · $13/mo
- Expected delta
- +$44/yr (+$4/mo · 41.1%)
ⓘ Screening estimate from a state-policy table — verify with the county assessor before closing.
Climate risk First Street
- Flood 1/10 Low FEMA zone X (unshaded) · 0% chance over 30 yrs
- Wildfire 10/10 Extreme
- Heat 8/10 Severe 7 d/yr ≥105°F today · 16 d/yr by 30 yrs out
- Wind 1/10 Low
- Air quality 10/10 Extreme 32 unhealthy d/yr today · 37 by 30 yrs out
Nearby sold comps map
Loading sold comps map…
Walkable amenities ~0.75 mi
Loading nearby amenities…
Taxation est. · year 1
- Rental income
- $11,259
- − Mortgage interest
- −$1,120
- − Property taxes
- −$108
- − Insurance
- −$100
- − Repairs & maintenance
- −$901
- − Management
- −$901
- − Depreciation
- −$582
- Taxable income
- $7,547
- Est. tax owed @ 24.0%
- −$1,811
- After-tax cash flow
- $5,617/yr
For passive investors: Depreciation is non-cash, so a rental often shows a tax loss while cash-flowing — sheltering income. Rental losses are passive: they offset passive income freely, and up to $25,000/yr can offset ordinary (W-2) income if you actively participate and your MAGI is under $100k (phasing out to $0 by $150k); unused losses carry forward. On sale, claimed depreciation is recaptured at up to 25%, and gains may owe capital-gains tax (a 1031 exchange can defer both). Figures are a year-1 estimate at your 24.0% rate — not tax advice; consult a CPA.
Schools (NCES district)
- District
- Palermo Union Elementary
- NCES district ID
- 0629540
- Math proficiency
- 20% ▲ 1.00%
- Reading proficiency
- 33% ▬ 0.00%
- Median HH income
- $39,628
- Composite
- 25.26/100
- National rank
- #12903
- State rank
- #1149 of 1400 in CA
Livability — Palermo
- Score
- 48/100
- State rank
- #1219
- US rank
- #26161
Category grades
Schools grade is shown separately in the Schools card above.
Census & demographics
- Census place
- Palermo, CA
- City population
- 1,346
- Population (ZIP)
- 1,346
Population outlook (Butte County) Hauer SSP2
- Today (2025)
- 237,527 people
- By 2030
- 243,804 · +2.6%
- By 2040
- 253,899 · +6.9%
- By 2050
- 262,561 · +10.5%
- By 2075
- 283,709 · +19.4%
- By 2100
- 282,689 · +19.0%
Race, ethnicity, and origin ACS 2023
- Neighborhood character
- Diverse neighborhood (Simpson 0.56)
- Race & ethnicity
- White 50% Hispanic / Latino 44% Two or more races 10% Native American 4% Asian 2%
- Hispanic origin (detail)
- Mexican 34%
- Common ancestry
- Russian 4% Italian 2% Lithuanian 2%
- Foreign-born
- 20% · Canada
- Languages at home
- 64% English-only · Spanish 34% Other Asian/Pacific 2%
Political lean MEDSL · Butte
- 2024 margin
- Toss-up / Even · D 46.8% · R 49.9% · Other 3.3%
- 2008→2024 swing
- -5.5pp toward R · 2008: 2.4pp · 2024: -3.1pp
- All cycles
- 2024: R+3.1 2020: D+1.7 2016: R+4.0 2012: R+3.9 2008: D+2.4
Not yet ingested
- Civics
- —
Market trends
- HPI YoY
- ▼ -0.98%
- Current HPI
- 249.5209
- Rent YoY
- —
- Metro
- —
- State GDP YoY
- ▲ 3.21%
- F500 in state
- 116
Industry mix (Fortune 500 HQ in CA)
| Industry | F500 HQs | Revenue |
|---|---|---|
| Technology | 27 | $1,492B |
|
||
| Financial Services | 3 | $174B |
|
||
| Retail | 3 | $44B |
|
||
| Insurance | 3 | $26B |
|
||
| Media / Entertainment | 2 | $115B |
|
||
| Pharmaceuticals / Biotech | 2 | $62B |
|
||
Price history
1 event — show timeline
- 2026-04-27 Listed $20,000 CRMLS
Property tax history
+0.5%/yrLatest (2017): $108 · +0.7% YoY. Source: county tax records.
Cash-flow waterfall
monthlySold comps — $/sqft
last 12 mo · ≤1 miLoading sold comps…