841 4th Ave N #21 · St. Petersburg, FL
Flood risk 1/10 · Minimal
- FEMA flood zone
- X (unshaded)
- Chance of flooding over 30 yrs
- 0.0%
- Est. flood insurance / yr
- $507 – $1,088
Fire risk 1/10 · Minimal
- Est. fire insurance / yr
- $947 – $1,759
Heat risk 10/10 · Severe
- Hot days now (above 106°F)
- 6 days/yr
- Hot days in 30 yrs
- 24 days/yr
Wind risk 10/10 · Severe
- Chance of severe wind over 30 yrs
- 99.0%
Air-quality risk 3/10 · Minor
- Unhealthy air days now
- 2 days/yr
- Unhealthy air days in 30 yrs
- 3 days/yr
Risk factors via First Street. Map © Google.
Why this score? — see what drove the D grade
The composite is a weighted blend of 9 inputs, each scored 0–100. Each bar is that input's sub-score; the figure is the points it added to the 100-point composite (weight × sub-score).
- 1% rule +10.0/10.0
- Cash flow +9.4/30.0
- ARV discount +7.5/15.0
- Schools +4.3/10.0
- DSCR +2.6/10.0
- Livability +2.5/5.0
- Condition / age +2.5/5.0
- Rent growth +1.6/5.0
- Appreciation +0.0/10.0
$124,500
🖨 Deal sheet (PDF) 📄 Offer letter ✓ Due diligence
Listing remarks
Under contract-accepting backup offers. EXCITING DISCOVERY; YOUR DREAM HOME IN DOWNTOWN ST PETE, A LOCATION IN THE HEART OF THE CITY. Priced thousands below value. 55+ and 2nd person can be 30+, Pet friendly, High and Dry, No flood zone. Lovingly known for its vibrant arts scene and cultural vibe. New Roof and New exterior Siding. In 2018 energy efficient double pane hurricane impact windows were also installed throughout the bldg. This mid rise building is elevator friendly and extremely well maintained. Passed Milestone and Structural Integrity Inspection. If you have been hunting for a quaint condo surrounded by Multi Million dollar homes, this is it. Only a few blocks to the intracoasta
Key facts
- Elevator friendly
- Well maintained
- New exterior siding
Tags
Property features AI
Finance
- Other: Unit is offered furnished; Buyer directions: From 5th Ave N south on MLK, left/east on 4th Ave N; complex is on the left — park in guest spot or behind building under bridge; Living area approximately 820 square feet
- Financial info: Total monthly fees listed as $942; total annual fees listed as $11,304
- HOA & community: Monthly HOA fee of $942 covering cable TV, electricity, internet, management, maintenance (structure & grounds), common area taxes, pest control, sewer, trash, water and reserves; Association requires approval; Association amenities include clubhouse, laundry, lobby key access and maintenance; Senior community; Pets allowed (cats and dogs) with limits; max pet weight 100 lbs
Exterior
- Parking: Assigned parking; Guest parking available; Ground-level parking; Basement parking
- Utilities: Public water; Public sewer; Cable connected; Electricity connected; Sewer connected; Water connected; Fire hydrant on property
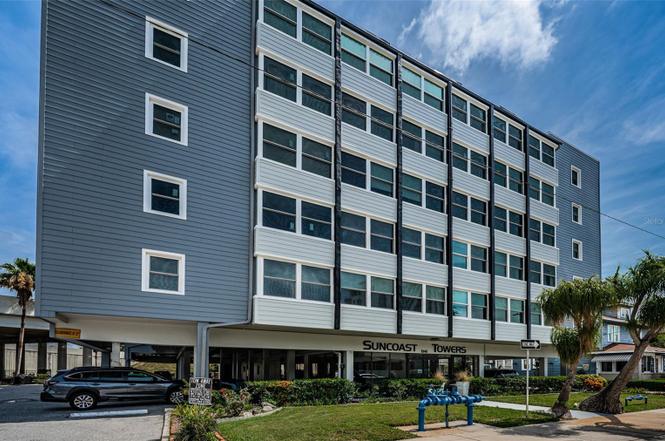
- Home design: Condominium (Suncoast Towers); One level unit in a 6-story building; Unit faces south; Condo includes land
- Construction: Block and concrete construction; Membrane roof; Other roof materials; Concrete perimeter foundation and slab; Building name: SUNCOAST TOWERS; Built footprint consistent with multi-story condominium
- Exterior features: Hurricane shutters; Outdoor lighting; Outdoor grill; Private mailbox; Rain gutters; Sidewalks; Landscaped grounds with mature trees; Level lot; Near golf course, marina and public transit
Interior
- Kitchen: Dishwasher; Electric range; Microwave; Refrigerator; Electric water heater
- Bedrooms: 1 bedroom (located on 2nd floor)
- Flooring: Carpet; Vinyl
- Bathrooms: 1 full bathroom
- Heating & cooling: Central heating; Central air conditioning
- Interior features: Ceiling fans; Living room/dining room combo; Thermostat; Window treatments; Shutters and storm windows; Elevator in building
- Laundry & utility: Laundry room with inside and corridor access
Neighborhood map
What this means for you Summary
Snapshot
- This is a 1-bed/1.0-bath condo listed at $124k.
Deal economics
- At list price, monthly cash flow is $-90 ($-1k/yr) — negative.
- To cash-flow at today's rent, offer at most $109k (12.7% below list).
- Meets the 1% rule at list price ($2k rent vs $124k).
- Recommended offer: $109k (12.7% below list) — sets the bar for cash-flow.
- Cap rate 5.4% vs local median 2.6% in St. Petersburg — top-decile yield for the area; either an underpriced asset or a hidden risk that comps aren't pricing in. Stress-test before assuming the spread holds.
Location & tenants
- Location reads: area grade D — affects rentability + tenant quality, not the cash-flow math above.
- Pinellas (suburban): math 51% / reading 51% proficiency, ranked #31 of 73 in FL (top 42%) — acceptable for families but not a draw, mixed tenant base, ~2y average lease.
- Zoned schools: North Shore Elementary School (math 42% / reading 47%, grade F, #1,288 of 2,144 statewide, top 62%, 501 students, 46% FRL); John Hopkins Middle School (math 25% / reading 27%, grade F, #506 of 571 statewide, top 89%, 723 students, 66% FRL); St. Petersburg High School (math 31% / reading 61%, grade D-, #220 of 667 statewide, top 33%, 1,723 students, 39% FRL) — zoned schools at 51% FRL track the district average.
- Zoned-school proficiency averages 39% at this address vs 51% district-wide (-12 pts) — the specific schools serving this property underperform the Pinellas average; the district grade overstates school quality for this exact location.
- Market conditions: Rents falling (-3.6%/yr); 350 active listings in the ZIP; 40 comparable units currently listed for rent nearby; rentals at typical pace (median 20d on market — plan ~3-4 weeks tenant-placement turnaround); 2,676 units permitted in Pinellas County in 2024 (1,422 in 5+ unit buildings).
- This rent runs 35% of the median local income ($74k/yr) — at the standard rent-burdened threshold; future hikes will face affordability resistance.
Forward outlook
- Local home prices are declining (-3.0%/yr); year-one equity from $861 of loan paydown is wiped out by about $4k of value loss. Plan a longer hold.
- Pinellas County population projected at +14% by 2050 — modest demand growth; plan on rents tracking national, not racing it.
Negotiation context
- It's been on market 328 days — a 12% lower offer ($110k) is reasonable based on typical stale-listing flexibility.
Risks & watch-outs
- Watch-outs: HOA is 43% of rent; built in 1955 — expect roof / HVAC / electrical / plumbing capex.
- Climate carrying-cost: severe wind risk, 99% chance of damaging wind over 30y; extreme-heat days projected 6→24/yr by 2055 (HVAC capex compounding) — expect insurance premiums to compound above CPI over the hold.
Questions for the listing agent
- What do current leases actually rent for vs. the listed asking? Can we see a recent rent roll and the last 12 months of T-12 income?
- It's been on market 328 days. Have you received any prior offers? Is the seller open to a 13% concession, seller financing, or rate buy-down credit?
- Built in 1955 — when were the roof, HVAC, electrical panel, plumbing, and water heater last replaced?
- What does the HOA fee cover, when was the last increase, and are there any pending special assessments or reserve-fund shortfalls?
- Any open or pending special assessments — roof, HVAC, plumbing, elevator, façade? What's the per-unit balance and payoff schedule, and is the seller paying it off at close or rolling it to the buyer?
- Why hasn't it sold? Are there any deal-killer items the seller is aware of (foundation, flood, title, zoning, code violations)?
- Is there a deadline driving the sale (1031 exchange, divorce, estate, relocation)? That informs how much negotiation room exists.
- The area grade is low — what's the realistic commute time and amenity access for the typical tenant pool here? Any planned neighborhood developments (good or bad) we should know about?
- What's the average days-on-market for RENTAL listings here right now (not sales)? A rising rental-DOM trend means longer vacancies and softer asking-rent achievability than the comps imply.
- What's the recent tenant-quality profile in this submarket — average credit score on applications, eviction rate, late-payment / NSF rate, and stable-employment percentage? A property-management company in the area should have these aggregated.
- How much new apartment / multifamily construction is in the pipeline within 1–3 miles? Heavy new supply (>2% of stock underway) typically softens rents 12–24 months out; light construction supports rent growth.
Investment metrics
- 1% rule
- 1.75% ✓
- Cap rate
- 5.43%
- Cash-on-cash
- -3.09%
- DSCR
- 0.86
- GRM
- 4.8
CMA / ARV
No comps found within radius.
Projected returns pro-forma
-3.0% appreciation · 0.0% rent growth · sell at horizon
- IRR
- -28.7%
- Equity multiple
- 0.09×
- Total profit
- $-31,646
- Equity at exit
- $18,563
- IRR
- -84.7%
- Equity multiple
- -0.64×
- Total profit
- $-57,047
- Equity at exit
- $10,764
Cash invested: $34,860 (down + closing). Projections, not guarantees.
Landlord ↔ Tenant lean methodology
- Overall (STATE)
- 87 Strongly Landlord-Friendly
- State Florida
- 87 Strongly Landlord-Friendly · R+3
- County
- — inherits STATE
- City
- — inherits STATE
ZIP-level market 33701
- Rents YoY
- -3.6%
- Active inventory
- 350
- Price-to-rent
- 4.8×
Monthly cashflow live
- Estimated rent
- $2,175 high interval (Pro) →
- Mortgage (P&I)
- −$653
- Tax from tax record
- −$161 /mo · $1,934/yr
- Insurance
- −$52
- HOA
- −$942
- Vacancy / Maint / Mgmt
- −$457
- Net cashflow
- $-90
Break-even live
Sensitivity live
| Price | -10% $-19 | -5% $-54 | +0% $-90 | +5% $-125 | +10% $-160 |
|---|---|---|---|---|---|
| Rent | -10% $-262 | -5% $-176 | +0% $-90 | +5% $-4 | +10% $82 |
| Rate | -1.0pp $-27 | -0.5pp $-58 | base $-90 | +0.5pp $-122 | +1.0pp $-155 |
UW: 25.0% down · 7.5% · 30yr · 1.5% tax · 5.0% vac · 8.0% maint · 8.0% mgmt
Financing live
Cash to close
- Down payment
- $31,125
- Closing costs
- $3,735
- Reserves months
- —
- Total cash needed
- —
Loan-product check · same deal, 3 products live
Conventional
25% down · 7.5% · 30yr
- Down + closing
- —
- Monthly P&I
- —
- Monthly cashflow
- —
- DSCR
- —
- Eligible?
- —
Personal DTI + credit; lowest rate.
DSCR
20% down · 8.5% · 30yr
- Down + closing
- —
- Monthly P&I
- —
- Monthly cashflow
- —
- DSCR
- —
- Eligible?
- —
No personal income docs; deal must DSCR.
Hard money
10% down · 12.0% · 12mo
- Down + closing
- —
- Monthly P&I
- —
- Monthly cashflow
- —
- DSCR
- —
- Eligible?
- —
Short-term bridge; refi at stabilization.
Rent comps 40 comps
| Address | Beds | Baths | Sqft | Rent | $/sqft | DOM | Units | Dist |
|---|---|---|---|---|---|---|---|---|
| 779 4th Ave N Unit 1 St. Petersburg, FL | 1.0 | 1.0 | 580 | $1,749 | $3.02 | 6d | 1 | 0.09mi |
| 610 8th St N St. Petersburg, FL | 1.0 | 1.0 | 690 | $1,800 | $2.61 | 10d | 1 | 0.13mi |
| 340 Moffett Ct N Saint Petersburg, FL | 2.0 | 1.0 | 980 | $3,200 | $3.27 | 6d | 1 | 0.14mi |
| 324 Grove St N Unit 302 St. Petersburg, FL | 1.0 | 1.0 | 550 | $1,595 | $2.90 | 26d | 1 | 0.17mi |
| 308 Grove St N Saint Petersburg, FL | 1.0 | 1.0 | 550 | $1,295 | $2.35 | 16d | 1 | 0.18mi |
| 735 Grove St N Unit 2 St. Petersburg, FL | 1.0 | 1.0 | 700 | $1,500 | $2.14 | 20d | 1 | 0.27mi |
| 808 Grove St N Unit 808 St. Petersburg, FL | 2.0 | 2.0 | 815 | $2,450 | $3.01 | 26d | 1 | 0.28mi |
| 1057 7th Ave N #3 St. Petersburg, FL | 2.0 | 1.0 | 833 | $1,975 | $2.37 | 10d | 1 | 0.28mi |
| 537 6th St N St. Petersburg, FL | 1.0 | 1.0 | 1040 | $2,200 | $2.12 | 26d | 1 | 0.29mi |
| 622 7th Ave N Unit 620 St. Petersburg, FL | 2.0 | 1.0 | 1000 | $3,200 | $3.20 | 17d | 1 | 0.29mi |
| 500 5th St N Unit 20 St. Petersburg, FL | — | 1.0 | 525 | $1,295 | $2.47 | 26d | 1 | 0.32mi |
| 819 11th St N Unit 3 St. Petersburg, FL | 1.0 | 1.0 | 675 | $1,950 | $2.89 | 12d | 1 | 0.33mi |
| 809 10th Ave N Unit 4 St. Petersburg, FL | 1.0 | 1.0 | 600 | $2,450 | $4.08 | 26d | 1 | 0.36mi |
| 809 10th Ave N Unit 6 St. Petersburg, FL | 2.0 | 1.0 | 650 | $2,990 | $4.60 | 26d | 1 | 0.36mi |
| 824 6th St N Unit 2 St. Petersburg, FL | 1.0 | 1.0 | 650 | $2,300 | $3.54 | 20d | 1 | 0.37mi |
| 855 Central Ave Saint Petersburg, FL | 3.0 | 1.0–2.5 | 1432 | $3,932 | $2.75 | 0d | 18 | 0.37mi |
| 1000 1st Ave N St. Petersburg, FL | 3.0 | 1.0–2.5 | 1123 | $3,712 | $3.30 | 0d | 99 | 0.39mi |
| 1110 8th St N Unit 4 St. Petersburg, FL | 1.0 | 1.0 | 750 | $1,950 | $2.60 | 17d | 1 | 0.40mi |
| 1323 7th Ave N Saint Petersburg, FL | 2.0 | 1.0 | 1070 | $3,300 | $3.08 | 26d | 1 | 0.43mi |
| 829 5th St N Unit 2 St. Petersburg, FL | 1.0 | 1.0 | 525 | $1,595 | $3.04 | 0d | 1 | 0.44mi |
| 1135 Highland St N Saint Petersburg, FL | 1.0 | 1.0 | 560 | $1,395 | $2.49 | 19d | 1 | 0.44mi |
| 1135 Highland St N Saint Petersburg, FL | 2.0 | 1.0 | 766 | $2,150 | $2.81 | 26d | 1 | 0.44mi |
| 725 1st Ave S Unit 1514059P St. Petersburg, FL | 1.0 | 1.0 | 807 | $4,181 | $5.18 | 4d | 1 | 0.45mi |
| 930 Central Ave Saint Petersburg, FL | 2.0 | 1.0–2.0 | 888 | $2,896 | $3.26 | 0d | 15 | 0.45mi |
| 417 4th St N Unit 301 St. Petersburg, FL | 1.0 | 1.5 | 800 | $1,595 | $1.99 | 10d | 1 | 0.47mi |
| 417 4th St N Unit 202 St. Petersburg, FL | 2.0 | 1.5 | 800 | $1,595 | $1.99 | 26d | 1 | 0.47mi |
| 417 4th St N Apt 203 St. Petersburg, FL | 1.0 | 1.0 | 600 | $1,595 | $2.66 | 26d | 1 | 0.47mi |
| 417 4th St N Unit 101 St. Petersburg, FL | 1.0 | 1.0 | 695 | $1,395 | $2.01 | 26d | 1 | 0.48mi |
| 1037 12th St N Unit 1 St. Petersburg, FL | 1.0 | 1.0 | 650 | $1,500 | $2.31 | 6d | 1 | 0.48mi |
| 928 13th St N Saint Petersburg, FL | 2.0 | 2.0 | 925 | $2,300 | $2.49 | 26d | 1 | 0.49mi |
| 301 4th Ave N Unit 605 St. Petersburg, FL | 1.0 | 1.0 | 650 | $1,600 | $2.46 | 10d | 1 | 0.52mi |
| 301 4th Ave N Saint Petersburg, FL | 1.0 | 1.0 | 475 | $1,670 | $3.52 | 26d | 2 | 0.52mi |
| 625 Kirkwood Ter N Unit A St. Petersburg, FL | 1.0 | 1.0 | 621 | $1,699 | $2.74 | 20d | 1 | 0.52mi |
| 779 12th Ave N St. Petersburg, FL | 2.0 | 1.0 | 743 | $2,300 | $3.10 | 6d | 1 | 0.53mi |
| 532 3rd St N Unit A St. Petersburg, FL | 2.0 | 2.0 | 1000 | $3,100 | $3.10 | 26d | 1 | 0.53mi |
| 411 1st Ave N Saint Petersburg, FL | 1.0–2.0 | 1.0–2.0 | 613 | $2,900 | $4.73 | 26d | 1 | 0.55mi |
| 700 3rd Ave S Unit 700-204 St. Petersburg, FL | 1.0 | 1.0 | 647 | $1,950 | $3.01 | 6d | 1 | 0.62mi |
| 700 3rd Ave S Unit 710-103 St. Petersburg, FL | 1.0 | 1.0 | 647 | $1,950 | $3.01 | 10d | 1 | 0.62mi |
| 305 Doctor Martin Luther King Junior St S #843 St. Petersburg, FL | 2.0 | 1.0–2.0 | 620 | $2,325 | $3.75 | 22d | 46 | 0.62mi |
| 249 8th Ave N Unit 249 1/2 St. Petersburg, FL | 1.0 | 1.0 | 576 | $2,395 | $4.16 | 24d | 1 | 0.62mi |
HOA detail condo
- Monthly dues
- $942 · $11,304/yr
- Assessments
- None detected in remarks — confirm with the listing agent.
Listing history 4 events
-
2026-05-20status Pending
-
2026-02-26price $124,500
-
2025-10-30price $129,900
-
2025-06-26$140,000 Active
ⓘ Source: listings_history table (triggers on properties + properties_extension) + one-shot
backfill from property_details.listing_events for pre-trigger history.
Tax reassessment forecast FL · Resets to sale price
- Current annual tax
- $1,934 · $161/mo
- Projected year-2 tax
- $1,934 · $161/mo
- Expected delta
- $0/yr ($0/mo · 0.0%)
ⓘ Screening estimate from a state-policy table — verify with the county assessor before closing.
Climate risk First Street
- Flood 1/10 Low FEMA zone X (unshaded) · 0% chance over 30 yrs
- Wildfire 1/10 Low
- Heat 10/10 Extreme 6 d/yr ≥106°F today · 24 d/yr by 30 yrs out
- Wind 10/10 Extreme 99% chance of damaging wind over 30 yrs
- Air quality 3/10 Moderate 2 unhealthy d/yr today · 3 by 30 yrs out
Nearby sold comps map
Loading sold comps map…
Walkable amenities ~0.75 mi
Loading nearby amenities…
Taxation est. · year 1
- Rental income
- $26,100
- − Mortgage interest
- −$6,974
- − Property taxes
- −$1,934
- − Insurance
- −$622
- − Repairs & maintenance
- −$2,088
- − Management
- −$2,088
- − HOA
- −$11,304
- − Depreciation
- −$3,622
- Taxable loss
- −$2,532
- Est. tax savings @ 24.0%
- +$608
- After-tax cash flow
- $-469/yr
For passive investors: Depreciation is non-cash, so a rental often shows a tax loss while cash-flowing — sheltering income. Rental losses are passive: they offset passive income freely, and up to $25,000/yr can offset ordinary (W-2) income if you actively participate and your MAGI is under $100k (phasing out to $0 by $150k); unused losses carry forward. On sale, claimed depreciation is recaptured at up to 25%, and gains may owe capital-gains tax (a 1031 exchange can defer both). Figures are a year-1 estimate at your 24.0% rate — not tax advice; consult a CPA.
Schools (NCES district)
- District
- Pinellas
- NCES district ID
- 1201560
- Math proficiency
- 51% ▼ -5.00%
- Reading proficiency
- 51% ▼ -3.00%
- Median HH income
- $46,270
- Composite
- 43.27/100
- National rank
- #3046
- State rank
- #31 of 73 in FL
Livability — St. Petersburg
No livability data for this city. (Only ~50 U.S. cities are tracked.)
Census & demographics
- Census place
- St. Petersburg, FL
- County
- Pinellas County · 939,478 people
- City population
- 249,151
- Metro
- Tampa-St. Petersburg-Clearwater, FL
- Population (ZIP)
- 18,823
- Household income
- $73,542
- Rent vs Own
- Severe rent burden
- 2230.0
Population outlook (Pinellas County) Hauer SSP2
- Today (2025)
- 1,027,532 people
- By 2030
- 1,063,586 · +3.5%
- By 2040
- 1,125,020 · +9.5%
- By 2050
- 1,168,637 · +13.7%
- By 2075
- 1,265,188 · +23.1%
- By 2100
- 1,260,357 · +22.7%
Race, ethnicity, and origin ACS 2023
- Neighborhood character
- Predominantly White (74%)
- Race & ethnicity
- White 74% Hispanic / Latino 10% Black 10% Two or more races 7% Asian 2%
- Hispanic origin (detail)
- Mexican 1% Puerto Rican 2% Cuban 3%
- Common ancestry
- Romanian 4% Lithuanian 4% Slovak 3%
- Foreign-born
- 10% · Canada, Jamaica, China
- Languages at home
- 88% English-only · Spanish 6% Other Indo-European 2% Russian/Polish/Slavic 1%
Political lean MEDSL · Pinellas
- 2024 margin
- Lean R (+5.2) · D 46.9% · R 52.1%
- 2008→2024 swing
- -13.5pp toward R · 2008: 8.3pp · 2024: -5.2pp
- All cycles
- 2024: R+5.2 2020: D+0.2 2016: R+1.1 2012: D+5.6 2008: D+8.3
Not yet ingested
- Civics
- —
Market trends
- HPI YoY
- ▼ -425.52%
- Current HPI
- 486.3846
- Rent YoY
- ▼ -3.56%
- Metro
- Tampa-St. Petersburg-Clearwater, FL
- State GDP YoY
- ▲ 3.28%
- F500 in state
- 36
Industry mix (Fortune 500 HQ in FL)
| Industry | F500 HQs | Revenue |
|---|---|---|
| Industrial Technology | 2 | $29B |
|
||
| Insurance | 2 | $17B |
|
||
| Retail | 1 | $60B |
|
||
| Technology Distribution | 1 | $58B |
|
||
| Homebuilding | 1 | $35B |
|
||
| Technology Manufacturing | 1 | $35B |
|
||
Price history
-11.1% since first listed4 events — show timeline
- 2026-05-20 Pending — Stellar MLS as Distributed by MLS Grid
- 2026-02-26 Price Changed $124,500 Stellar MLS as Distributed by MLS Grid
- 2025-10-30 Price Changed $129,900 Stellar MLS as Distributed by MLS Grid
- 2025-06-26 Listed $140,000 Stellar MLS as Distributed by MLS Grid
Property tax history
+10.7%/yrLatest (2025): $1,934 · +16.9% YoY. Source: county tax records.
Cash-flow waterfall
monthlySold comps — $/sqft
last 12 mo · ≤1 miLoading sold comps…