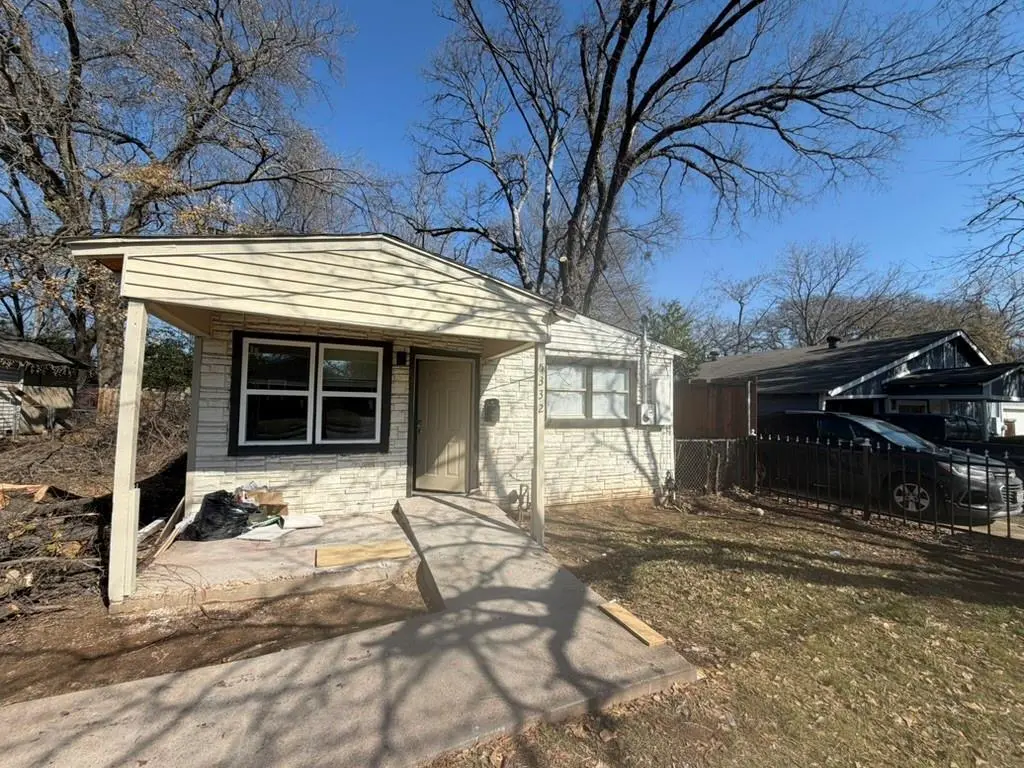
5332 Dimple Jackson St · Dallas, TX
Flood risk 1/10 · Minimal
- FEMA flood zone
- X (unshaded)
- Chance of flooding over 30 yrs
- 0.0%
- Est. flood insurance / yr
- $507 – $1,088
Fire risk 3/10 · Minor
- Est. fire insurance / yr
- $1,222 – $2,270
Heat risk 7/10 · Major
- Hot days now (above 110°F)
- 7 days/yr
- Hot days in 30 yrs
- 24 days/yr
Wind risk 6/10 · Moderate
- Chance of severe wind over 30 yrs
- 27.0%
Air-quality risk 2/10 · Minimal
- Unhealthy air days now
- 2 days/yr
- Unhealthy air days in 30 yrs
- 2 days/yr
Risk factors via First Street. Map © Google.
Why this score? — see what drove the C+ grade
The composite is a weighted blend of 9 inputs, each scored 0–100. Each bar is that input's sub-score; the figure is the points it added to the 100-point composite (weight × sub-score).
- Cash flow +17.9/30.0
- ARV discount +15.0/15.0
- DSCR +5.6/10.0
- Appreciation +5.5/10.0
- 1% rule +5.4/10.0
- Livability +4.0/5.0
- Schools +2.8/10.0
- Rent growth +2.5/5.0
- Condition / age +2.5/5.0
$130,000
🖨 Deal sheet 📄 Offer letter ✓ Due diligence
Listing remarks MLS
Do not miss out
Key facts
- 6,034 sq ft lot
- Built 1911
- Listed 91 days
Neighborhood map
What this means for you Summary
Snapshot
- This is a 2-bed/1.0-bath single-family listed at $130k.
Deal economics
- At list price, monthly cash flow is $109 ($1k/yr) — positive.
- The deal already cash-flows at list — no discount required.
- Meets the 1% rule at list price ($1k rent vs $130k).
- Recommended offer: $118k (9.0% below list) — sets the bar for market timing.
- Cap rate 7.3% vs local median 2.3% in Dallas — top-decile yield for the area; either an underpriced asset or a hidden risk that comps aren't pricing in. Stress-test before assuming the spread holds.
Location & tenants
- Location reads 81/100 on livability (#24 in TX, #1,380 nationally) — a professional / high-income tenant draw. Strengths: amenities A+, commute A+, housing A+; Watch: schools C-, crime F.
- Dallas ISD (urban): math 31% / reading 36% proficiency, ranked #559 of 826 in TX (top 68%) — families likely to look elsewhere, expect single-tenant / working-renter base with shorter leases; 83% free/reduced lunch — lower-income household profile, screen leases tightly.
- Market conditions: 80 active listings in the ZIP; 32 comparable units currently listed for rent nearby; rentals at typical pace (median 14d on market — plan ~3-4 weeks tenant-placement turnaround); 12,577 units permitted in Dallas County in 2024 (6,829 in 5+ unit buildings).
Forward outlook
- In year one you build about $2k of equity ($899 loan paydown + $1k appreciation (1.1% local appreciation)).
- Dallas County population projected at +35% by 2050 — long-run rental-demand tailwind backs the buy-and-hold thesis.
- At projected returns (1.1% appreciation + 3.0% rent growth), your $36k cash investment doubles in ~8 years — after that, you're playing with house money.
Negotiation context
- It's been on market 91 days — a 9% lower offer ($118k) is reasonable based on typical stale-listing flexibility.
- 3 sale attempts since 21y ago; this cycle's ask has dropped $29k (18%) from the opening price — seller is motivated, your offer sets the floor, not the list.
Risks & watch-outs
- Watch-outs: built in 1911 — expect roof / HVAC / electrical / plumbing capex.
- Climate carrying-cost: major wind risk, 27% chance of damaging wind over 30y; extreme-heat days projected 7→24/yr by 2055 (HVAC capex compounding) — expect insurance premiums to compound above CPI over the hold.
Questions for the listing agent
- It's been on market 91 days. Have you received any prior offers? Is the seller open to a 9% concession, seller financing, or rate buy-down credit?
- Built in 1911 — when were the roof, HVAC, electrical panel, plumbing, and water heater last replaced?
- Why hasn't it sold? Are there any deal-killer items the seller is aware of (foundation, flood, title, zoning, code violations)?
- Is there a deadline driving the sale (1031 exchange, divorce, estate, relocation)? That informs how much negotiation room exists.
- Crime grade is F in this area — have there been break-ins, vandalism, or insurance claims at this property in the last 3 years? What carrier currently insures it and at what premium?
- What's the average days-on-market for RENTAL listings here right now (not sales)? A rising rental-DOM trend means longer vacancies and softer asking-rent achievability than the comps imply.
- What's the recent tenant-quality profile in this submarket — average credit score on applications, eviction rate, late-payment / NSF rate, and stable-employment percentage? A property-management company in the area should have these aggregated.
- How much new for-sale + rental construction is in the pipeline within 1–3 miles? Heavy new supply typically softens prices + rents 12–24 months out; constrained supply supports both.
Investment metrics
- 1% rule
- 1.04% ✓
- Cap rate
- 7.30%
- Cash-on-cash
- 3.59%
- DSCR
- 1.16
- GRM
- 8.0
CMA / ARV
- ARV (median comp)
- $162,788
- List price
- $130,000
- Delta
- -20.14%
- Verdict
- UNDERPRICED
- Comps
- 20 within 1.0 mi
Show comp detail 9 sales within ~0.75 mi
| Address | Dist | Beds/Ba | Sqft | Sold | Price | $/sf | Match |
|---|---|---|---|---|---|---|---|
| 5340 Bourquin St | 0.06mi | 2/1.0 | 998 (+9%) | 7mo | $150,000 | $150 | 76 |
| 5128 Dimple Jackson St | 0.19mi | 3/2.0 (+1) | 992 (+9%) | 8mo | $199,999 | $202 | 61 |
| 3808 De Maggio St | 0.24mi | 3/1.0 (+1) | 1,015 (+11%) | 18mo | $205,500 | $202 | 50 |
| 3603 York St | 0.73mi | 2/1.0 | 986 (+8%) | 4mo | $160,000 | $162 | 49 |
| 4202 Robert L Parish Sr | 0.67mi | 2/1.0 | 980 (+8%) | 13mo | $150,000 | $153 | 46 |
| 3516 York St | 0.74mi | 2/1.0 | 990 (+9%) | 8mo | $114,900 | $116 | 44 |
| 3834 York St | 0.60mi | 3/1.0 (+1) | 837 (-8%) | 17mo | $135,000 | $161 | 40 |
| 3526 Elsie Faye Heggins St | 0.62mi | 3/1.0 (+1) | 958 (+5%) | 24mo | $90,000 | $94 | 38 |
| 3607 York St | 0.72mi | 3/1.0 (+1) | 793 (-13%) | 16mo | $152,000 | $192 | 26 |
Match score weights: distance 35% · size 25% · config 20% · recency 20%. Top-matched comps best support the ARV.
Projected returns pro-forma
1.07% appreciation · 3.0% rent growth · sell at horizon
- IRR
- 5.3%
- Equity multiple
- 1.27×
- Total profit
- $9,850
- Equity at exit
- $44,831
- IRR
- 9.6%
- Equity multiple
- 2.17×
- Total profit
- $42,678
- Equity at exit
- $59,927
Cash invested: $36,400 (down + closing). Projections, not guarantees.
Landlord ↔ Tenant lean methodology
- Overall (STATE)
- 87 Strongly Landlord-Friendly
- State Texas
- 87 Strongly Landlord-Friendly · R+5
- County
- — inherits STATE
- City
- — inherits STATE
ZIP-level market 75210
- Home prices YoY
- 0.6%
- Active inventory
- 80
- Price-to-rent
- 8.0×
Monthly cashflow live
- Estimated rent
- $1,351 high interval (Pro) →
- Mortgage (P&I)
- −$682
- Tax from tax record
- −$222 /mo · $2,667/yr
- Insurance
- −$54
- HOA
- −$0
- Vacancy / Maint / Mgmt
- −$284
- Net cashflow
- $109
Break-even live
UW: 25.0% down · 7.5% · 30yr · 1.5% tax · 5.0% vac · 8.0% maint · 8.0% mgmt
Financing live
Cash to close
- Down payment
- $32,500
- Closing costs
- $3,900
- Reserves months
- —
- Total cash needed
- —
Loan-product check · same deal, 3 products live
Conventional
25% down · 7.5% · 30yr
- Down + closing
- —
- Monthly P&I
- —
- Monthly cashflow
- —
- DSCR
- —
- Eligible?
- —
Personal DTI + credit; lowest rate.
DSCR
20% down · 8.5% · 30yr
- Down + closing
- —
- Monthly P&I
- —
- Monthly cashflow
- —
- DSCR
- —
- Eligible?
- —
No personal income docs; deal must DSCR.
Hard money
10% down · 12.0% · 12mo
- Down + closing
- —
- Monthly P&I
- —
- Monthly cashflow
- —
- DSCR
- —
- Eligible?
- —
Short-term bridge; refi at stabilization.
Rent comps 32 comps
| Address | Beds | Baths | Sqft | Rent | $/sqft | DOM | Units | Dist |
|---|---|---|---|---|---|---|---|---|
| 5221 Grovewood St Dallas, TX | 3.0 | 1.5 | 840 | $1,400 | $1.67 | 43d | 1 | 0.14mi |
| 3910 Polly St Dallas, TX | 2.0 | 1.0 | 550 | $1,100 | $2.00 | 7d | 1 | 0.36mi |
| 3627 Sidney St Dallas, TX | 3.0 | 2.0 | 1090 | $1,614 | $1.48 | 6d | 1 | 0.55mi |
| 3526 Elsie Faye Heggins St Dallas, TX | 3.0 | 2.0 | 1113 | $1,795 | $1.61 | 7d | 1 | 0.62mi |
| 3526 Elsie Faye Heggins St Dallas, TX | 3.0 | 2.0 | 1113 | $1,795 | $1.61 | 24d | 1 | 0.62mi |
| 4722 Meadow St Dallas, TX | 2.0–3.0 | 2.0 | 1107 | $1,275 | $1.15 | 11d | 4 | 0.86mi |
| 3639 Pine St Dallas, TX | 3.0 | 2.0 | 1090 | $1,490 | $1.37 | 14d | 1 | 0.96mi |
| 2829 Oakdale St Dallas, TX | 3.0 | 2.0 | 1028 | $1,840 | $1.79 | 7d | 1 | 1.03mi |
| 3408 Spring Ave Dallas, TX | 3.0 | 2.0 | 780 | $1,340 | $1.72 | 6d | 1 | 1.05mi |
| 2711 Cross St Dallas, TX | 2.0 | 1.0 | 700 | $1,275 | $1.82 | 6d | 1 | 1.05mi |
| 3529 Herrling St Dallas, TX | 2.0 | 1.0 | 632 | $1,200 | $1.90 | 11d | 1 | 1.14mi |
| 4303 Jamaica St Dallas, TX | 3.0 | 2.0 | 1027 | $1,375 | $1.34 | 6d | 1 | 1.19mi |
| 3907 Roberts Ave Dallas, TX | 3.0 | 1.0 | 908 | $1,395 | $1.54 | 15d | 1 | 1.30mi |
| 4205 Metropolitan Ave Dallas, TX | 2.0 | 1.0 | 625 | $1,150 | $1.84 | 43d | 1 | 1.30mi |
| 3422 Terrell St Dallas, TX | 1.0 | 1.0 | 820 | $800 | $0.98 | 43d | 1 | 1.34mi |
| 4525 Metropolitan Ave Dallas, TX | 3.0 | 2.0 | 1090 | $1,490 | $1.37 | 14d | 1 | 1.34mi |
| 4717 Owenwood Ave Dallas, TX | 3.0 | 2.0 | 1090 | $1,490 | $1.37 | 14d | 1 | 1.35mi |
| 6415 Latta St Unit 1 Dallas, TX | 1.0 | 1.0 | 1110 | $1,365 | $1.23 | 43d | 1 | 1.37mi |
| 6363 Hollis Ave Unit 6365 Dallas, TX | 1.0 | 1.0 | 600 | $850 | $1.42 | 7d | 1 | 1.39mi |
| 2627 Elsie Faye Heggins St Dallas, TX | 3.0 | 2.0 | 876 | $1,280 | $1.46 | 43d | 1 | 1.39mi |
| 6365 Hollis Ave Dallas, TX | 1.0 | 1.0 | 589 | $1,000 | $1.70 | 43d | 1 | 1.39mi |
| 6365 Hollis Ave Dallas, TX | 1.0 | 1.0 | 600 | $850 | $1.42 | 7d | 1 | 1.39mi |
| 2615 Elsie Faye Heggins St Dallas, TX | 3.0 | 2.0 | 876 | $1,280 | $1.46 | 15d | 1 | 1.40mi |
| 6401 Hollis Ave Unit 6403 Dallas, TX | 1.0 | 1.0 | 600 | $850 | $1.42 | 7d | 1 | 1.40mi |
| 6401 Hollis Ave Dallas, TX | 1.0 | 1.0 | 600 | $1,000 | $1.67 | 43d | 1 | 1.40mi |
| 6403 Hollis Ave Dallas, TX | 1.0 | 1.0 | 600 | $1,000 | $1.67 | 43d | 1 | 1.41mi |
| 6403 Hollis Ave Dallas, TX | 1.0 | 1.0 | 600 | $850 | $1.42 | 3d | 1 | 1.41mi |
| 2603 Elsie Faye Heggins St Dallas, TX | 3.0 | 2.0 | 876 | $1,385 | $1.58 | 43d | 1 | 1.41mi |
| 2642 Anderson St Dallas, TX | 2.0 | 1.0 | 820 | $1,150 | $1.40 | 24d | 1 | 1.42mi |
| 2563 Elsie Faye Heggins St Dallas, TX | 3.0 | 2.0 | 876 | $1,240 | $1.42 | 15d | 1 | 1.43mi |
| 2561 Elsie Faye Heggins St Dallas, TX | 3.0 | 2.0 | 876 | $1,390 | $1.59 | 6d | 1 | 1.43mi |
| 4024 Myrtle St Dallas, TX | 3.0 | 2.0 | 1106 | $1,595 | $1.44 | 5d | 1 | 1.44mi |
Listing history 24 events
-
2026-06-18days on market $130,000 Active 91 DOM
-
2026-06-17days on market $130,000 Active 90 DOM
-
2026-06-16days on market $130,000 Active 89 DOM
-
2026-06-15days on market $130,000 Active 88 DOM
-
2026-06-13pricedays on market $130,000 Active 86 DOM
-
2026-06-09days on market $147,000 Active 82 DOM
-
2026-06-08days on market $147,000 Active 81 DOM
-
2026-06-07days on market $147,000 Active 80 DOM
-
2026-06-04days on market $147,000 Active 77 DOM
-
2026-06-03days on market $147,000 Active 76 DOM
-
2026-06-02days on market $147,000 Active 75 DOM
-
2026-06-02days on market $147,000 Active 74 DOM
-
2026-05-31days on market $147,000 Active 73 DOM
-
2026-05-04price $147,000 15-char remark
Show marketing remark (15 chars)
Do not miss out
-
2026-03-05$159,000 Active 15-char remark
Show marketing remark (15 chars)
Do not miss out
-
2016-11-11soldstatus Sold 316-char remark
Show marketing remark (316 chars)
PROPERTY HAS TWO BEDROOM AND ONE BATH WITH SEPARATE LIVING ROOM, DINING ROOM, LAUNDRY ROOM, PORCH AND PATIO COVERED AND PROPERTY HAS 6033 SQ FT LOT SIZE. AUCTION SOLD AS IS. DUE DILIGENCE TO BE DONE PRIOR TO BIDDING. BUYER OR BUYER S AGENT TO VERIFY ALL INFORMATION: SCHOOLS, TAXES, RESTRICTIONS AND ROOM SIZES, ETC.
-
2016-09-22status Pending 316-char remark
Show marketing remark (316 chars)
PROPERTY HAS TWO BEDROOM AND ONE BATH WITH SEPARATE LIVING ROOM, DINING ROOM, LAUNDRY ROOM, PORCH AND PATIO COVERED AND PROPERTY HAS 6033 SQ FT LOT SIZE. AUCTION SOLD AS IS. DUE DILIGENCE TO BE DONE PRIOR TO BIDDING. BUYER OR BUYER S AGENT TO VERIFY ALL INFORMATION: SCHOOLS, TAXES, RESTRICTIONS AND ROOM SIZES, ETC.
-
2016-08-31$23,320 Active 316-char remark
Show marketing remark (316 chars)
PROPERTY HAS TWO BEDROOM AND ONE BATH WITH SEPARATE LIVING ROOM, DINING ROOM, LAUNDRY ROOM, PORCH AND PATIO COVERED AND PROPERTY HAS 6033 SQ FT LOT SIZE. AUCTION SOLD AS IS. DUE DILIGENCE TO BE DONE PRIOR TO BIDDING. BUYER OR BUYER S AGENT TO VERIFY ALL INFORMATION: SCHOOLS, TAXES, RESTRICTIONS AND ROOM SIZES, ETC.
-
2005-08-08soldstatus
-
2005-07-29soldstatus
-
2005-07-05historical
-
2005-03-22$28,000
-
2001-08-01soldstatus
-
2001-08-01soldstatus
ⓘ Source: listings_history table (triggers on properties + properties_extension) + one-shot
backfill from property_details.listing_events for pre-trigger history.
Tax reassessment forecast TX · Resets to sale price
- Current annual tax
- $2,667 · $222/mo
- Projected year-2 tax
- $2,667 · $222/mo
- Expected delta
- $0/yr ($0/mo · 0.0%)
ⓘ Screening estimate from a state-policy table — verify with the county assessor before closing.
Climate risk First Street
- Flood 1/10 Low FEMA zone X (unshaded) · 0% chance over 30 yrs
- Wildfire 3/10 Moderate
- Heat 7/10 Severe 7 d/yr ≥110°F today · 24 d/yr by 30 yrs out
- Wind 6/10 Major 27% chance of damaging wind over 30 yrs
- Air quality 2/10 Low 2 unhealthy d/yr today · 2 by 30 yrs out
Nearby sold comps map
Loading sold comps map…
Walkable amenities ~0.75 mi
Loading nearby amenities…
Taxation est. · year 1
- Rental income
- $16,209
- − Mortgage interest
- −$7,282
- − Property taxes
- −$2,667
- − Insurance
- −$650
- − Repairs & maintenance
- −$1,297
- − Management
- −$1,297
- − Depreciation
- −$3,782
- Taxable loss
- −$766
- Est. tax savings @ 24.0%
- +$184
- After-tax cash flow
- $1,491/yr
For passive investors: Depreciation is non-cash, so a rental often shows a tax loss while cash-flowing — sheltering income. Rental losses are passive: they offset passive income freely, and up to $25,000/yr can offset ordinary (W-2) income if you actively participate and your MAGI is under $100k (phasing out to $0 by $150k); unused losses carry forward. On sale, claimed depreciation is recaptured at up to 25%, and gains may owe capital-gains tax (a 1031 exchange can defer both). Figures are a year-1 estimate at your 24.0% rate — not tax advice; consult a CPA.
Schools (NCES district)
- District
- Dallas ISD
- NCES district ID
- 4816230
- Math proficiency
- 31% ▼ -16.00%
- Reading proficiency
- 36% ▼ -4.00%
- Median HH income
- $42,881
- Composite
- 28.41/100
- National rank
- #6763
- State rank
- #559 of 826 in TX
Livability — Dallas
- Score
- 81/100
- State rank
- #24
- US rank
- #1380
Category grades
Schools grade is shown separately in the Schools card above.
Census & demographics
- Census place
- Dallas, TX
- City population
- 1,168,437
- Population (ZIP)
- 7,458
Population outlook (Dallas County) Hauer SSP2
- Today (2025)
- 2,979,839 people
- By 2030
- 3,191,823 · +7.1%
- By 2040
- 3,619,611 · +21.5%
- By 2050
- 4,026,915 · +35.1%
- By 2075
- 4,957,073 · +66.4%
- By 2100
- 5,508,725 · +84.9%
Race, ethnicity, and origin ACS 2023
- Neighborhood character
- Majority Black (56%)
- Race & ethnicity
- Black 56% Hispanic / Latino 39% Two or more races 12% White 3% Asian 2%
- Hispanic origin (detail)
- Mexican 17%
- Foreign-born
- 23% · Canada, Vietnam
- Languages at home
- 66% English-only · Spanish 32% Vietnamese 2%
Political lean MEDSL · Dallas
- 2024 margin
- Strong D (+22.2) · D 60.2% · R 38.0% · Other 1.8%
- 2008→2024 swing
- +6.9pp toward D · 2008: 15.3pp · 2024: 22.2pp
- All cycles
- 2024: D+22.2 2020: D+31.6 2016: D+26.2 2012: D+15.4 2008: D+15.3
Not yet ingested
- Civics
- —
Market trends
- HPI YoY
- ▲ 1.07%
- Current HPI
- 177.2281
- Rent YoY
- —
- Metro
- —
- State GDP YoY
- ▲ 3.95%
- F500 in state
- 110
Industry mix (Fortune 500 HQ in TX)
| Industry | F500 HQs | Revenue |
|---|---|---|
| Energy | 16 | $1,198B |
|
||
| Technology | 5 | $198B |
|
||
| Engineering / Construction | 4 | $72B |
|
||
| Energy Services | 3 | $60B |
|
||
| Utilities | 3 | $41B |
|
||
| Healthcare | 2 | $330B |
|
||
Price history
+425.0% since first listed11 events — show timeline
- 2026-05-04 Price Changed $147,000 NTREIS
- 2026-03-05 Listed $159,000 NTREIS
- 2016-11-11 Sold (MLS) — NTREIS
- 2016-09-22 Pending — NTREIS
- 2016-08-31 Listed $23,320 NTREIS
- 2005-08-08 Sold (Public Records) — Public Records
- 2005-07-29 Sold (MLS) — NTREIS
- 2005-07-05 Listing Removed — NTREIS
- 2005-03-22 Listed $28,000 NTREIS
- 2001-08-01 Sold (Public Records) — Public Records
- 2001-08-01 Sold (Public Records) — Public Records
Property tax history
+13.1%/yrLatest (2025): $2,667 · -0.4% YoY. Source: county tax records.
Cash-flow waterfall
monthlySold comps — $/sqft
last 12 mo · ≤1 miLoading sold comps…