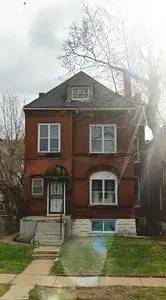
1392 Union Blvd · St. Louis, MO
Flood risk 1/10 · Minimal
- FEMA flood zone
- X (unshaded)
- Chance of flooding over 30 yrs
- 0.0%
- Est. flood insurance / yr
- $473 – $860
Fire risk 1/10 · Minimal
- Est. fire insurance / yr
- $1,054 – $1,958
Heat risk 5/10 · Moderate
- Hot days now (above 107°F)
- 7 days/yr
- Hot days in 30 yrs
- 20 days/yr
Wind risk 2/10 · Minimal
- Chance of severe wind over 30 yrs
- 1.0%
Air-quality risk 4/10 · Minor
- Unhealthy air days now
- 4 days/yr
- Unhealthy air days in 30 yrs
- 5 days/yr
Risk factors via First Street. Map © Google.
Why this score? — see what drove the B grade
The composite is a weighted blend of 9 inputs, each scored 0–100. Each bar is that input's sub-score; the figure is the points it added to the 100-point composite (weight × sub-score).
- Cash flow +30.0/30.0
- 1% rule +10.0/10.0
- DSCR +10.0/10.0
- ARV discount +7.5/15.0
- Appreciation +3.9/10.0
- Rent growth +2.5/5.0
- Livability +2.5/5.0
- Condition / age +2.5/5.0
- Schools +1.2/10.0
$90,000
🖨 Deal sheet 📄 Offer letter ✓ Due diligence
Listing remarks
Great house at a great price! Three finished levels offer a large foyer and formal livingroom with a fireplace. Exposed brick in the formal diningroom. The eat-in kitchen also has some exposed brick, updated appliances, and walks out to a large deck. Three bedrooms plus two bonus rooms that could be used for a home office/gym or extra bedrooms. One full bath on first floor 2nd full bath on 2nd floor. Seller will make no repairs or provide any inspections or warranties.
Key facts
- Exposed brick
- Large foyer
- Formal livingroom
Tags
Property features AI
Exterior
- Home design: Built in 1891
- Construction: Living area approximately 1,684
- Exterior features: Located in the Academy/Sherman Park neighborhood
Neighborhood map
What this means for you Summary
Snapshot
- This is a 3-bed/2.0-bath single-family listed at $90k.
Deal economics
- At list price, monthly cash flow is $639 ($8k/yr) — positive.
- The deal already cash-flows at list — no discount required.
- Meets the 1% rule at list price ($1k rent vs $90k).
- Cap rate 14.8% vs local median 5.0% in St. Louis — top-decile yield for the area; either an underpriced asset or a hidden risk that comps aren't pricing in. Stress-test before assuming the spread holds.
Location & tenants
- Location reads: area grade B — affects rentability + tenant quality, not the cash-flow math above.
- St. Louis City (urban): math 10% / reading 18% proficiency, ranked #312 of 324 in MO (top 96%) — low school quality limits family demand, transient renter base, plan for 1-2y turnover; 80% free/reduced lunch — lower-income household profile, screen leases tightly.
- Market conditions: 58 active listings in the ZIP; 40 comparable units currently listed for rent nearby; rentals at typical pace (median 24d on market — plan ~3-4 weeks tenant-placement turnaround); 42% of comp listings sitting > 30 days — soft ceiling on asking rent; 294 units permitted in St. Louis city in 2024 (227 in 5+ unit buildings).
Forward outlook
- Local home prices are declining (-2.1%/yr); year-one equity from $622 of loan paydown is wiped out by about $2k of value loss. Plan a longer hold.
- St. Louis County population projected to shrink 6% by 2050 — rents likely to lag national; underwrite the cash flow, not the appreciation.
- At projected returns (-2.1% appreciation + 3.0% rent growth), your $25k cash investment doubles in ~4 years — after that, you're playing with house money.
Negotiation context
- Only 9 days on market — expect competitive offers; lowballing is unlikely to land.
Risks & watch-outs
- Watch-outs: built in 1891 — expect roof / HVAC / electrical / plumbing capex.
- Climate carrying-cost: extreme-heat days projected 7→20/yr by 2055 (HVAC capex compounding) — expect insurance premiums to compound above CPI over the hold.
Questions for the listing agent
- Built in 1891 — when were the roof, HVAC, electrical panel, plumbing, and water heater last replaced?
- Is there a deadline driving the sale (1031 exchange, divorce, estate, relocation)? That informs how much negotiation room exists.
- What's the average days-on-market for RENTAL listings here right now (not sales)? A rising rental-DOM trend means longer vacancies and softer asking-rent achievability than the comps imply.
- What's the recent tenant-quality profile in this submarket — average credit score on applications, eviction rate, late-payment / NSF rate, and stable-employment percentage? A property-management company in the area should have these aggregated.
- How much new for-sale + rental construction is in the pipeline within 1–3 miles? Heavy new supply typically softens prices + rents 12–24 months out; constrained supply supports both.
Investment metrics
- 1% rule
- 1.66% ✓
- Cap rate
- 14.81%
- Cash-on-cash
- 30.41%
- DSCR
- 2.35
- GRM
- 5.0
CMA / ARV
- ARV (on-the-fly)
- $42,100
- Comps found
- 12
Show comp detail 12 sales within ~0.75 mi
| Address | Dist | Beds/Ba | Sqft | Sold | Price | $/sf | Match |
|---|---|---|---|---|---|---|---|
| 5159 Kensington Ave | 0.58mi | 3/2.0 | 1,612 (-4%) | 5mo | $105,000 | $65 | 62 |
| 5254 Maple Ave | 0.25mi | 4/2.5 (+1) | 1,750 (+4%) | 18mo | $65,000 | $37 | 59 |
| 1366 Burd Ave | 0.41mi | 4/1.5 (+1) | 1,620 (-4%) | 15mo | $40,000 | $25 | 55 |
| 5071 Lotus Ave | 0.55mi | 3/1.0 | 1,734 (+3%) | 14mo | $22,900 | $13 | 54 |
| 5232 Cote Brilliante Ave | 0.40mi | 2/1.0 (-1) | 1,576 (-6%) | 10mo | $14,900 | $9 | 53 |
| 5434 Maple Ave | 0.42mi | 4/— (+1) | 1,578 (-6%) | 14mo | $90,000 | $57 | 53 |
| 5069 Lotus Ave | 0.55mi | 4/1.5 (+1) | 1,734 (+3%) | 12mo | $34,700 | $20 | 52 |
| 5450 Vernon Ave | 0.49mi | 3/2.5 | 1,728 (+3%) | 24mo | $265,000 | $153 | 51 |
| 5237 Wabada | 0.57mi | 3/1.0 | 1,550 (-8%) | 10mo | $20,000 | $13 | 48 |
| 5041 Lotus Ave | 0.58mi | 4/1.5 (+1) | 1,500 (-11%) | 10mo | $30,000 | $20 | 39 |
| 1900 Belt Ave | 0.53mi | 4/2.0 (+1) | 1,870 (+11%) | 16mo | $65,000 | $35 | 38 |
| 5242 Wabada Ave | 0.54mi | 2/1.0 (-1) | 1,550 (-8%) | 20mo | $34,000 | $22 | 36 |
Match score weights: distance 35% · size 25% · config 20% · recency 20%. Top-matched comps best support the ARV.
Projected returns pro-forma
-2.14% appreciation · 3.0% rent growth · sell at horizon
- IRR
- 26.8%
- Equity multiple
- 2.16×
- Total profit
- $29,323
- Equity at exit
- $16,888
- IRR
- 33.3%
- Equity multiple
- 4.20×
- Total profit
- $80,681
- Equity at exit
- $13,873
Cash invested: $25,200 (down + closing). Projections, not guarantees.
Landlord ↔ Tenant lean methodology
- Overall (STATE)
- 81 Strongly Landlord-Friendly
- State Missouri
- 81 Strongly Landlord-Friendly · R+10
- County
- — inherits STATE
- City
- — inherits STATE
ZIP-level market 63113
- Home prices YoY
- -2.0%
- Active inventory
- 58
- Price-to-rent
- 5.0×
Monthly cashflow live
- Estimated rent
- $1,492 high interval (Pro) →
- Mortgage (P&I)
- −$472
- Tax from tax record
- −$31 /mo · $366/yr
- Insurance
- −$38
- HOA
- −$0
- Vacancy / Maint / Mgmt
- −$313
- Net cashflow
- $639
Break-even live
UW: 25.0% down · 7.5% · 30yr · 1.5% tax · 5.0% vac · 8.0% maint · 8.0% mgmt
Financing live
Cash to close
- Down payment
- $22,500
- Closing costs
- $2,700
- Reserves months
- —
- Total cash needed
- —
Loan-product check · same deal, 3 products live
Conventional
25% down · 7.5% · 30yr
- Down + closing
- —
- Monthly P&I
- —
- Monthly cashflow
- —
- DSCR
- —
- Eligible?
- —
Personal DTI + credit; lowest rate.
DSCR
20% down · 8.5% · 30yr
- Down + closing
- —
- Monthly P&I
- —
- Monthly cashflow
- —
- DSCR
- —
- Eligible?
- —
No personal income docs; deal must DSCR.
Hard money
10% down · 12.0% · 12mo
- Down + closing
- —
- Monthly P&I
- —
- Monthly cashflow
- —
- DSCR
- —
- Eligible?
- —
Short-term bridge; refi at stabilization.
Rent comps 40 comps
| Address | Beds | Baths | Sqft | Rent | $/sqft | DOM | Units | Dist |
|---|---|---|---|---|---|---|---|---|
| 1420 Union Blvd Unit 2F St. Louis, MO | 2.0 | 1.0 | 1096 | $995 | $0.91 | 43d | 1 | 0.08mi |
| 5345 Wells Ave Unit 2ND St. Louis, MO | 3.0 | 1.0 | 1127 | $1,095 | $0.97 | 23d | 1 | 0.18mi |
| 5096 Minerva Ave Unit C St. Louis, MO | 3.0 | 1.0 | 1800 | $1,395 | $0.78 | 43d | 1 | 0.26mi |
| 1320 Academy Ave Unit A St. Louis, MO | 2.0 | 1.0 | 1600 | $1,090 | $0.68 | 43d | 1 | 0.26mi |
| 5333 Patton Ave St. Louis, MO | 3.0 | 1.5 | 1262 | $1,250 | $0.99 | 43d | 1 | 0.39mi |
| 5130 Kensington Ave Unit 1 St. Louis, MO | 3.0 | 2.0 | 1200 | $1,245 | $1.04 | 23d | 1 | 0.62mi |
| 5760 Theodosia Ave Saint Louis, MO | 3.0 | 1.5 | 1702 | $1,420 | $0.83 | 23d | 1 | 0.82mi |
| 5535 Delmar Blvd St. Louis, MO | 1.0–2.0 | 1.0–2.0 | 911 | $1,970 | $2.16 | 1d | 14 | 0.85mi |
| 629 Clara Ave Apt 26 St. Louis, MO | 2.0 | 2.0 | 1155 | $1,615 | $1.40 | 43d | 1 | 0.93mi |
| 625 N Euclid Ave St. Louis, MO | 2.0 | 1.0–2.0 | 984 | $3,120 | $3.17 | 1d | 16 | 0.95mi |
| 5137 Waterman Blvd Apt 4 St. Louis, MO | 3.0 | 2.0 | 1550 | $1,700 | $1.10 | 43d | 1 | 0.97mi |
| 5137 Waterman Blvd Apt 4 St. Louis, MO | 3.0 | 2.0 | 1550 | $1,700 | $1.10 | 23d | 1 | 0.97mi |
| 763 Walton Ave Unit 763 St. Louis, MO | 2.0 | 1.0 | 1100 | $1,100 | $1.00 | 43d | 1 | 0.97mi |
| 5804 Cates Ave Unit 2 St. Louis, MO | 3.0 | 1.0 | 1500 | $1,500 | $1.00 | 4d | 1 | 0.97mi |
| 4901 Washington Blvd Saint Louis, MO | 2.0 | 2.0 | 1620 | $2,500 | $1.54 | 11d | 1 | 0.99mi |
| 501 Clara Ave Saint Louis, MO | 1.0–2.0 | 1.0–2.0 | 850 | $1,845 | $2.17 | 14d | 21 | 1.05mi |
| 501 Clara Ave Saint Louis, MO | 1.0–2.0 | 1.0–2.0 | 915 | $1,885 | $2.06 | 1d | 21 | 1.05mi |
| 5527 Waterman Blvd St. Louis, MO | 2.0 | 1.5 | 1389 | $1,495 | $1.08 | 16d | 1 | 1.05mi |
| 4738 Olive St Saint Louis, MO | 2.0 | 2.0 | 1413 | $1,925 | $1.36 | 23d | 1 | 1.08mi |
| 1266 Amherst Pl Unit 2nd floor St. Louis, MO | 2.0 | 1.0 | 1050 | $1,000 | $0.95 | 43d | 1 | 1.08mi |
| 445 Clara Ave Saint Louis, MO | 2.0 | 2.5 | 1188 | $2,750 | $2.31 | 43d | 1 | 1.09mi |
| 321 Belt Ave St. Louis, MO | 3.0 | 2.0 | 1549 | $2,300 | $1.48 | 4d | 1 | 1.09mi |
| 401 N Euclid Ave St. Louis, MO | 3.0 | 1.0 | 1025 | $1,875 | $1.83 | 1d | 4 | 1.10mi |
| 5223 Ashland Ave Saint Louis, MO | 2.0 | 1.0 | 2200 | $1,250 | $0.57 | 43d | 1 | 1.12mi |
| 5223 Ashland Ave Unit 2 St. Louis, MO | 3.0 | 1.0 | 2200 | $1,450 | $0.66 | 43d | 1 | 1.12mi |
| 275 Union Blvd St. Louis, MO | 3.0 | 1.0–3.0 | 1317 | $4,686 | $3.56 | 2d | 58 | 1.12mi |
| 5394 Pershing Ave Saint Louis, MO | 3.0 | 2.0 | 1500 | $2,595 | $1.73 | 43d | 1 | 1.14mi |
| 5510 Pershing Ave Saint Louis, MO | 3.0 | 1.0–2.0 | 827 | $3,247 | $3.92 | 2d | 20 | 1.17mi |
| 5783 McPherson Ave Unit 2FL St. Louis, MO | 3.0 | 2.0 | 1320 | $2,550 | $1.93 | 7d | 1 | 1.26mi |
| 5783 McPherson Ave Unit 1FL St. Louis, MO | 2.0 | 2.0 | 1250 | $1,950 | $1.56 | 7d | 1 | 1.26mi |
| 4500 Olive St Unit D St. Louis, MO | 2.0 | 2.0 | 1200 | $1,725 | $1.44 | 43d | 1 | 1.30mi |
| 4466 Olive St Saint Louis, MO | 1.0–2.0 | 1.0–2.5 | 1222 | $2,495 | $2.04 | 1d | 7 | 1.37mi |
| 377 N Taylor Ave St. Louis, MO | 2.0 | 2.0 | 1209 | $1,595 | $1.32 | 14d | 1 | 1.38mi |
| 1019 N Skinker Pkwy St. Louis, MO | 1.0–3.0 | 1.0–3.0 | 1137 | $2,795 | $2.46 | 1d | 9 | 1.38mi |
| 5803 Waterman Blvd St. Louis, MO | 2.0 | 2.0 | 1432 | $1,850 | $1.29 | 43d | 1 | 1.41mi |
| 5861 Nina Pl Apt 2W St. Louis, MO | 3.0 | 1.0 | 1400 | $1,750 | $1.25 | 43d | 1 | 1.42mi |
| 5861 Nina Pl Unit 3W St. Louis, MO | 3.0 | 1.0 | 1550 | $1,750 | $1.13 | 17d | 1 | 1.42mi |
| 4400 Delmar Blvd St. Louis, MO | 3.0 | 1.0 | 1450 | $1,600 | $1.10 | 43d | 1 | 1.43mi |
| 100 N Kingshighway Blvd Saint Louis, MO | 3.0 | 1.0–2.0 | 1171 | $6,995 | $5.97 | 1d | 80 | 1.43mi |
| 100 N Kingshighway Blvd Saint Louis, MO | 3.0 | 1.0–2.0 | 1211 | $7,099 | $5.86 | 43d | 84 | 1.43mi |
Listing history 7 events
-
2026-06-18days on market $90,000 Active 9 DOM
-
2026-06-17days on market $90,000 Active 8 DOM
-
2026-06-16days on market $90,000 Active 7 DOM
-
2026-06-15days on market $90,000 Active 6 DOM
-
2026-06-13days on market $90,000 Active 4 DOM
-
2026-06-10remarks 474-char remark
-
2026-06-10$90,000 Active 1 DOM
ⓘ Source: listings_history table (triggers on properties + properties_extension) + one-shot
backfill from property_details.listing_events for pre-trigger history.
Tax reassessment forecast MO · Resets to sale price
- Current annual tax
- $366 · $31/mo
- Projected year-2 tax
- $873 · $73/mo
- Expected delta
- +$507/yr (+$42/mo · 138.4%)
ⓘ Screening estimate from a state-policy table — verify with the county assessor before closing.
Climate risk First Street
- Flood 1/10 Low FEMA zone X (unshaded) · 0% chance over 30 yrs
- Wildfire 1/10 Low
- Heat 5/10 Major 7 d/yr ≥107°F today · 20 d/yr by 30 yrs out
- Wind 2/10 Low 100% chance of damaging wind over 30 yrs
- Air quality 4/10 Moderate 4 unhealthy d/yr today · 5 by 30 yrs out
Nearby sold comps map
Loading sold comps map…
Walkable amenities ~0.75 mi
Loading nearby amenities…
Taxation est. · year 1
- Rental income
- $17,903
- − Mortgage interest
- −$5,041
- − Property taxes
- −$366
- − Insurance
- −$450
- − Repairs & maintenance
- −$1,432
- − Management
- −$1,432
- − Depreciation
- −$2,618
- Taxable income
- $6,563
- Est. tax owed @ 24.0%
- −$1,575
- After-tax cash flow
- $6,088/yr
For passive investors: Depreciation is non-cash, so a rental often shows a tax loss while cash-flowing — sheltering income. Rental losses are passive: they offset passive income freely, and up to $25,000/yr can offset ordinary (W-2) income if you actively participate and your MAGI is under $100k (phasing out to $0 by $150k); unused losses carry forward. On sale, claimed depreciation is recaptured at up to 25%, and gains may owe capital-gains tax (a 1031 exchange can defer both). Figures are a year-1 estimate at your 24.0% rate — not tax advice; consult a CPA.
Schools (NCES district)
- District
- St. Louis City
- NCES district ID
- 2929280
- Math proficiency
- 10% ▼ -6.00%
- Reading proficiency
- 18% ▼ -3.00%
- Median HH income
- $35,685
- Composite
- 11.54/100
- National rank
- #9699
- State rank
- #312 of 324 in MO
Livability — St. Louis
No livability data for this city. (Only ~50 U.S. cities are tracked.)
Census & demographics
- Census place
- St. Louis, MO
- City population
- 283,259
- Population (ZIP)
- 11,610
Population outlook (St. Louis County) Hauer SSP2
- Today (2025)
- 315,737 people
- By 2030
- 313,865 · -0.6%
- By 2040
- 305,439 · -3.3%
- By 2050
- 296,529 · -6.1%
- By 2075
- 271,028 · -14.2%
- By 2100
- 255,359 · -19.1%
Race, ethnicity, and origin ACS 2023
- Neighborhood character
- Predominantly Black (91%)
- Race & ethnicity
- Black 91% White 6% Two or more races 2% Hispanic / Latino 1%
- Foreign-born
- 2% · Canada
Political lean MEDSL · St. Louis
- 2024 margin
- Solid D (+64.7) · D 81.4% · R 16.7% · Other 2.0%
- 2008→2024 swing
- -3.5pp toward R · 2008: 68.2pp · 2024: 64.7pp
- All cycles
- 2024: D+64.7 2020: D+66.2 2016: D+63.7 2012: D+66.6 2008: D+68.2
Not yet ingested
- Civics
- —
Market trends
- HPI YoY
- ▼ -2.14%
- Current HPI
- 107.1335
- Rent YoY
- —
- Metro
- —
- State GDP YoY
- ▲ 1.84%
- F500 in state
- 20
Industry mix (Fortune 500 HQ in MO)
| Industry | F500 HQs | Revenue |
|---|---|---|
| Healthcare | 1 | $163B |
|
||
| Insurance | 1 | $21B |
|
||
| Industrial Technology | 1 | $17B |
|
||
| Retail | 1 | $16B |
|
||
| Industrial Distribution | 1 | $10B |
|
||
| Utilities | 1 | $9B |
|
||
Price history
-25.0% since first listed3 events — show timeline
- 2026-06-10 Listed $90,000 FSBO.com
- 2005-12-28 Sold (Public Records) $120,000 Public Records
- 2003-05-13 Sold (Public Records) — Public Records
Property tax history
+2.7%/yrLatest (2024): $366 · +4.8% YoY. Source: county tax records.
Cash-flow waterfall
monthlySold comps — $/sqft
last 12 mo · ≤1 miLoading sold comps…