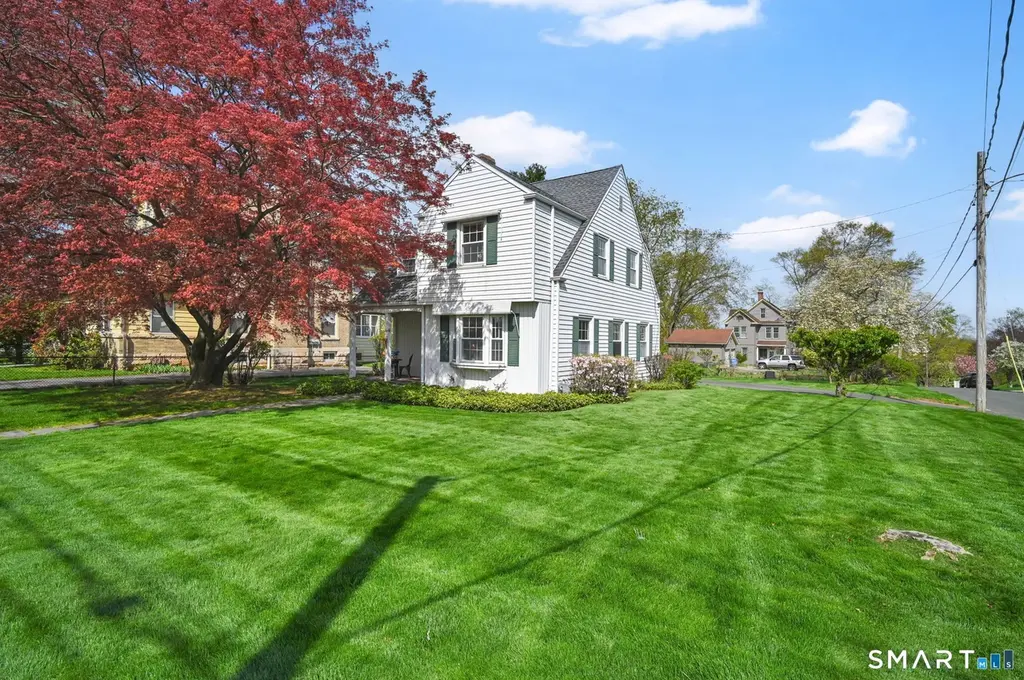
366 Fairfield Ave · Hartford, CT
Flood risk 1/10 · Minimal
- FEMA flood zone
- X (unshaded)
- Chance of flooding over 30 yrs
- 0.0%
- Est. flood insurance / yr
- $473 – $860
Fire risk 1/10 · Minimal
- Est. fire insurance / yr
- $829 – $1,539
Heat risk 5/10 · Moderate
- Hot days now (above 96°F)
- 7 days/yr
- Hot days in 30 yrs
- 16 days/yr
Wind risk 6/10 · Moderate
- Chance of severe wind over 30 yrs
- 27.0%
Air-quality risk 3/10 · Minor
- Unhealthy air days now
- 3 days/yr
- Unhealthy air days in 30 yrs
- 4 days/yr
Risk factors via First Street. Map © Google.
Why this score? — see what drove the D+ grade
The composite is a weighted blend of 9 inputs, each scored 0–100. Each bar is that input's sub-score; the figure is the points it added to the 100-point composite (weight × sub-score).
- ARV discount +13.2/15.0
- Appreciation +10.0/10.0
- Cash flow +8.2/30.0
- Livability +3.8/5.0
- Rent growth +2.9/5.0
- 1% rule +2.6/10.0
- Condition / age +2.5/5.0
- DSCR +2.2/10.0
- Schools +1.4/10.0
$299,900
🖨 Deal sheet 📄 Offer letter ✓ Due diligence
Listing remarks
* * BEST AND FINAL 10am Monday 4/27 * * After 32 years of loving care, this charming home in Hartford's Historic District, 366 Fairfield Ave, is ready to welcome its next owner. Blending timeless character with modern efficiency with energy-saving upgrades, this well-maintained property offers both comfort and a convenient location. Inside, this home is bright with lots of natural light with a functional layout. It features 3 bedrooms, 1 full bath, 1 half bath and includes an oversized walk-in cedar closet for storage. Recent upgrades include a newer roof and solar panels (seller owned), helping to significantly reduce electricity costs year-round. Additional highlights include a tankle
Key facts
- 0.24 acre lot
- Garage
- Built 1939
Property features AI
Exterior
- Parking: Attached garage (1 car)
- Utilities: Public water connected; Public sewer connected; Natural gas service
- Home design: Single family home
- Construction: Frame construction; Concrete foundation; Built with vinyl siding
- Exterior features: Level lot; Vinyl siding; Other exterior siding; Asphalt shingle roof; White exterior color
Interior
- Kitchen: Electric cooktop; Microwave; Refrigerator; Dishwasher
- Bedrooms: 3 bedrooms
- Bathrooms: 1 full bathroom; 1 half bathroom
- Heating & cooling: Hot air heating fueled by natural gas; Central air
- Interior features: 6 total rooms; Full basement; Attic with access via hatch; Central air conditioning; One fireplace
- Laundry & utility: Laundry located off the kitchen; Main level laundry; Washer and dryer included
Neighborhood map
What this means for you Summary
Snapshot
- This is a 3-bed/1.5-bath single-family listed at $300k.
Deal economics
- At list price, monthly cash flow is $-286 ($-3k/yr) — negative.
- To cash-flow at today's rent, offer at most $249k (16.8% below list).
- To meet the 1% rule (rent ≥ 1% of price), the offer needs to be $228k (23.9% below list).
- Recommended offer: $228k (23.9% below list) — sets the bar for 1% rule.
Location & tenants
- Location reads 76/100 on livability (#58 in CT, #3,553 nationally) — a middle-class / working-renter tenant base. Strengths: amenities A+, commute A+, health & safety A+; Watch: schools D-, crime F, employment F.
- Hartford School District (urban): math 13% / reading 21% proficiency, ranked #150 of 153 in CT (top 98%) — low school quality limits family demand, transient renter base, plan for 1-2y turnover; 84% free/reduced lunch — lower-income household profile, screen leases tightly.
- Market conditions: Rents rising (+1.5%/yr); 54 active listings in the ZIP; 4 comparable units currently listed for rent nearby; rentals at typical pace (median 16d on market — plan ~3-4 weeks tenant-placement turnaround); 1,867 units permitted in Capitol Planning Region in 2024 (1,399 in 5+ unit buildings).
- At $2,282/mo this rent would consume 53% of the median local household income ($52k/yr) (locally 1897% of renters already pay >50% of income on rent) — very limited rent-growth headroom before tenants either downsize or default.
Forward outlook
- In year one you build about $32k of equity ($2k loan paydown + $30k appreciation (10.0% local appreciation)).
- By year 2, paydown + projected appreciation supports a ~$52k cash-out refi (75% LTV) — recoverable capital for the next deal without selling this one.
Negotiation context
- Only 14 days on market — expect competitive offers; lowballing is unlikely to land.
Risks & watch-outs
- Watch-outs: built in 1939 — expect roof / HVAC / electrical / plumbing capex.
- Climate carrying-cost: major wind risk, 27% chance of damaging wind over 30y; extreme-heat days projected 7→16/yr by 2055 (HVAC capex compounding) — expect insurance premiums to compound above CPI over the hold.
Questions for the listing agent
- What do current leases actually rent for vs. the listed asking? Can we see a recent rent roll and the last 12 months of T-12 income?
- Built in 1939 — when were the roof, HVAC, electrical panel, plumbing, and water heater last replaced?
- Is there a deadline driving the sale (1031 exchange, divorce, estate, relocation)? That informs how much negotiation room exists.
- Schools are D-rated, which usually means shorter tenancies and higher turnover. Who's the typical renter profile here, and what's been the actual vacancy rate?
- Crime grade is F in this area — have there been break-ins, vandalism, or insurance claims at this property in the last 3 years? What carrier currently insures it and at what premium?
- The area grade is low — what's the realistic commute time and amenity access for the typical tenant pool here? Any planned neighborhood developments (good or bad) we should know about?
- What's the average days-on-market for RENTAL listings here right now (not sales)? A rising rental-DOM trend means longer vacancies and softer asking-rent achievability than the comps imply.
- What's the recent tenant-quality profile in this submarket — average credit score on applications, eviction rate, late-payment / NSF rate, and stable-employment percentage? A property-management company in the area should have these aggregated.
- How much new for-sale + rental construction is in the pipeline within 1–3 miles? Heavy new supply typically softens prices + rents 12–24 months out; constrained supply supports both.
Investment metrics
- 1% rule
- 0.76% ✗
- Cap rate
- 5.15%
- Cash-on-cash
- -4.09%
- DSCR
- 0.82
- GRM
- 11.0
CMA / ARV
- ARV (on-the-fly)
- $343,156
- Comps found
- 3
Show comp detail 3 sales within ~0.75 mi
| Address | Dist | Beds/Ba | Sqft | Sold | Price | $/sf | Match |
|---|---|---|---|---|---|---|---|
| 100 Goodwin Park Rd | 0.62mi | 4/2.0 (+1) | 1,400 (-1%) | 12mo | $300,000 | $214 | 52 |
| 24 Ridge Crest Cir | 0.72mi | 3/2.5 | 1,318 (-7%) | 4mo | $420,000 | $319 | 47 |
| 159 Ridge Rd | 0.70mi | 3/1.5 | 1,288 (-9%) | 13mo | $312,000 | $242 | 41 |
Match score weights: distance 35% · size 25% · config 20% · recency 20%. Top-matched comps best support the ARV.
Projected returns pro-forma
10.0% appreciation · 1.47% rent growth · sell at horizon
- IRR
- 20.9%
- Equity multiple
- 2.69×
- Total profit
- $141,711
- Equity at exit
- $270,174
- IRR
- 18.7%
- Equity multiple
- 6.06×
- Total profit
- $425,129
- Equity at exit
- $582,640
Cash invested: $83,972 (down + closing). Projections, not guarantees.
Landlord ↔ Tenant lean methodology
- Overall (STATE)
- 27 Tenant-Leaning
- State Connecticut
- 27 Tenant-Leaning · D+7
- County
- — inherits STATE
- City
- — inherits STATE
ZIP-level market 06114
- Home prices YoY
- 4.7%
- Rents YoY
- 1.5%
- Active inventory
- 54
- Price-to-rent
- 11.0×
Monthly cashflow live
- Estimated rent
- $2,282 medium interval (Pro) →
- Mortgage (P&I)
- −$1,573
- Tax from tax record
- −$391 /mo · $4,688/yr
- Insurance
- −$125
- HOA
- −$0
- Vacancy / Maint / Mgmt
- −$479
- Net cashflow
- $-286
Break-even live
UW: 25.0% down · 7.5% · 30yr · 1.5% tax · 5.0% vac · 8.0% maint · 8.0% mgmt
Financing live
Cash to close
- Down payment
- $74,975
- Closing costs
- $8,997
- Reserves months
- —
- Total cash needed
- —
Loan-product check · same deal, 3 products live
Conventional
25% down · 7.5% · 30yr
- Down + closing
- —
- Monthly P&I
- —
- Monthly cashflow
- —
- DSCR
- —
- Eligible?
- —
Personal DTI + credit; lowest rate.
DSCR
20% down · 8.5% · 30yr
- Down + closing
- —
- Monthly P&I
- —
- Monthly cashflow
- —
- DSCR
- —
- Eligible?
- —
No personal income docs; deal must DSCR.
Hard money
10% down · 12.0% · 12mo
- Down + closing
- —
- Monthly P&I
- —
- Monthly cashflow
- —
- DSCR
- —
- Eligible?
- —
Short-term bridge; refi at stabilization.
Rent comps 4 comps
| Address | Beds | Baths | Sqft | Rent | $/sqft | DOM | Units | Dist |
|---|---|---|---|---|---|---|---|---|
| 452 Hillside Ave Hartford, CT | 4.0 | 1.0 | 1233 | $2,700 | $2.19 | 23d | 1 | 0.66mi |
| 72 Folly Brook Blvd Wethersfield, CT | 2.0 | 1.0 | 900 | $1,875 | $2.08 | 16d | 2 | 0.69mi |
| 3 Goshen St Hartford, CT | 3.0 | 1.0 | 1168 | $2,100 | $1.80 | 1d | 1 | 1.04mi |
| 79 Village Dr Wethersfield, CT | 1.0–2.0 | 1.0–2.0 | 1002 | $2,688 | $2.68 | 1d | 13 | 1.10mi |
Listing history 4 events
-
2026-05-07status Under Contract
-
2026-04-28historical Under Contract - Continue to Show
-
2026-04-24$299,900 Active
-
2026-04-23historical $299,900
ⓘ Source: listings_history table (triggers on properties + properties_extension) + one-shot
backfill from property_details.listing_events for pre-trigger history.
Tax reassessment forecast CT · Partial reset (capped growth)
- Current annual tax
- $4,688 · $391/mo
- Projected year-2 tax
- $5,553 · $463/mo
- Expected delta
- +$865/yr (+$72/mo · 18.4%)
ⓘ Screening estimate from a state-policy table — verify with the county assessor before closing.
Climate risk First Street
- Flood 1/10 Low FEMA zone X (unshaded) · 0% chance over 30 yrs
- Wildfire 1/10 Low
- Heat 5/10 Major 7 d/yr ≥96°F today · 16 d/yr by 30 yrs out
- Wind 6/10 Major 27% chance of damaging wind over 30 yrs
- Air quality 3/10 Moderate 3 unhealthy d/yr today · 4 by 30 yrs out
Nearby sold comps map
Loading sold comps map…
Walkable amenities ~0.75 mi
Loading nearby amenities…
Taxation est. · year 1
- Rental income
- $27,379
- − Mortgage interest
- −$16,799
- − Property taxes
- −$4,688
- − Insurance
- −$1,500
- − Repairs & maintenance
- −$2,190
- − Management
- −$2,190
- − Depreciation
- −$8,724
- Taxable loss
- −$8,712
- Est. tax savings @ 24.0%
- +$2,091
- After-tax cash flow
- $-1,339/yr
For passive investors: Depreciation is non-cash, so a rental often shows a tax loss while cash-flowing — sheltering income. Rental losses are passive: they offset passive income freely, and up to $25,000/yr can offset ordinary (W-2) income if you actively participate and your MAGI is under $100k (phasing out to $0 by $150k); unused losses carry forward. On sale, claimed depreciation is recaptured at up to 25%, and gains may owe capital-gains tax (a 1031 exchange can defer both). Figures are a year-1 estimate at your 24.0% rate — not tax advice; consult a CPA.
Schools (NCES district)
- District
- Hartford School District
- NCES district ID
- 0901920
- Math proficiency
- 13% ▼ -5.00%
- Reading proficiency
- 21% ▼ -6.00%
- Median HH income
- $30,521
- Composite
- 13.54/100
- National rank
- #9514
- State rank
- #150 of 153 in CT
Livability — Hartford
- Score
- 76/100
- State rank
- #58
- US rank
- #3553
Category grades
Schools grade is shown separately in the Schools card above.
Census & demographics
- Census place
- Hartford, CT
- County
- Hartford County · 754,208 people
- City population
- 121,162
- Metro
- Hartford-East Hartford-Middletown, CT
- Population (ZIP)
- 26,458
- Household income
- $52,110
- Rent vs Own
- Severe rent burden
- 1897.0
Population outlook (Capitol County) Hauer SSP2
- By 2040
- 1,063,519
Race, ethnicity, and origin ACS 2023
- Neighborhood character
- Diverse neighborhood (Simpson 0.57)
- Race & ethnicity
- Hispanic / Latino 60% White 19% Black 19% Two or more races 10% Native American 1%
- Hispanic origin (detail)
- Mexican 4% Puerto Rican 36% Dominican 6%
- Common ancestry
- American 6% Romanian 1% Lithuanian 1%
- Foreign-born
- 31% · Canada, Jamaica
- Languages at home
- 36% English-only · Spanish 49% Russian/Polish/Slavic 8% Other Indo-European 4%
Political lean MEDSL · Capitol
- 2024 margin
- Strong D (+21.9) · D 60.1% · R 38.2% · Other 1.7%
- All cycles
- 2024: D+21.9
Not yet ingested
- Civics
- —
Market trends
- HPI YoY
- ▲ 16.02%
- Current HPI
- 356.5892
- Rent YoY
- ▲ 1.47%
- Metro
- Hartford-East Hartford-Middletown, CT
- State GDP YoY
- ▲ 1.06%
- F500 in state
- 38
Industry mix (Fortune 500 HQ in CT)
| Industry | F500 HQs | Revenue |
|---|---|---|
| Industrial Machinery | 4 | $38B |
|
||
| Insurance | 3 | $71B |
|
||
| Financial Services | 2 | $25B |
|
||
| Transportation / Logistics | 2 | $18B |
|
||
| Healthcare | 1 | $247B |
|
||
| Telecommunications | 1 | $55B |
|
||
Price history
+0.0% since first listed4 events — show timeline
- 2026-05-07 Pending — Smart MLS
- 2026-04-28 Contingent — Smart MLS
- 2026-04-24 Listed $299,900 Smart MLS
- 2026-04-23 Coming Soon $299,900 Smart MLS
Property tax history
+2.3%/yrLatest (2025): $4,688 · +0.0% YoY. Source: county tax records.
Cash-flow waterfall
monthlySold comps — $/sqft
last 12 mo · ≤1 miLoading sold comps…