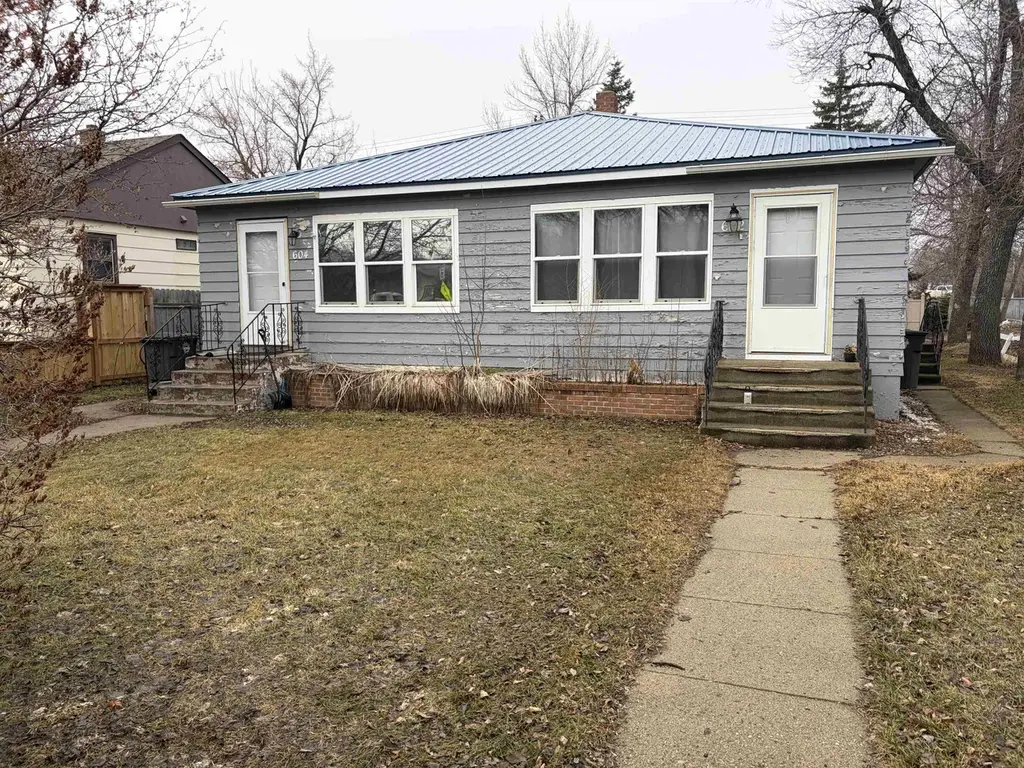
602 & 604 1st St SE · Stanley, ND
Flood risk 4/10 · Minor
- FEMA flood zone
- —
- Chance of flooding over 30 yrs
- 0.2%
- Est. flood insurance / yr
- —
Fire risk 3/10 · Minor
- Est. fire insurance / yr
- $1,289 – $2,393
Heat risk 1/10 · Minimal
- Hot days now (above 93°F)
- 7 days/yr
- Hot days in 30 yrs
- 12 days/yr
Wind risk 1/10 · Minimal
- Chance of severe wind over 30 yrs
- —
Air-quality risk 5/10 · Moderate
- Unhealthy air days now
- 7 days/yr
- Unhealthy air days in 30 yrs
- 7 days/yr
Risk factors via First Street. Map © Google.
Why this score? — see what drove the D grade
The composite is a weighted blend of 9 inputs, each scored 0–100. Each bar is that input's sub-score; the figure is the points it added to the 100-point composite (weight × sub-score).
- Cash flow +10.3/30.0
- ARV discount +7.5/15.0
- Appreciation +7.0/10.0
- Livability +3.8/5.0
- DSCR +3.0/10.0
- Schools +2.7/10.0
- Rent growth +2.5/5.0
- Condition / age +2.5/5.0
- 1% rule +2.3/10.0
$190,000
🖨 Deal sheet (PDF) 📄 Offer letter ✓ Due diligence
Key facts
- Two separate units
- Open living areas
- Investment property
Tags
Property features AI
Exterior
- Parking: 2-car garage; Concrete parking surface
- Utilities: Public water
- Home design: Duplex residential income property; Single-story
- Exterior features: Public water
Interior
- Kitchen: Dishwasher; Microwave; Range; Oven; Refrigerator
- Heating & cooling: Forced air heating (natural gas)
- Interior features: Partial unfinished basement; Dishwasher; Microwave; Range; Oven; Refrigerator; Forced air heating (natural gas)
Neighborhood map
What this means for you Summary
Snapshot
- This is a 4-bed/2.0-bath other listed at $190k.
Deal economics
- At list price, monthly cash flow is $-103 ($-1k/yr) — negative.
- To cash-flow at today's rent, offer at most $172k (9.6% below list).
- To meet the 1% rule (rent ≥ 1% of price), the offer needs to be $138k (27.3% below list).
- Recommended offer: $138k (27.3% below list) — sets the bar for 1% rule.
Location & tenants
- Location reads 76/100 on livability (#17 in ND, #3,477 nationally) — a middle-class / working-renter tenant base. Strengths: employment A+, cost of living A+, housing A+; Watch: commute C-, health & safety D, amenities F.
- Stanley 2 (rural): math 21% / reading 37% proficiency, ranked #41 of 53 in ND (top 77%) — low school quality limits family demand, transient renter base, plan for 1-2y turnover; only 18% free/reduced lunch — higher-income household profile.
- Zoned schools: Stanley Elementary School (math 23% / reading 40%, grade F, #181 of 236 statewide, top 77%, 428 students, 26% FRL); Stanley High School (math 17% / reading 32%, grade F, #108 of 144 statewide, top 88%, 327 students, 22% FRL).
- Market conditions: 25 active listings in the ZIP; 29 units permitted in Mountrail County in 2024 (0 in 5+ unit buildings).
Forward outlook
- In year one you build about $9k of equity ($1k loan paydown + $8k appreciation (4.0% local appreciation)).
- Mountrail County population projected at +118% by 2050 — long-run rental-demand tailwind backs the buy-and-hold thesis.
- By year 5, paydown + projected appreciation supports a ~$38k cash-out refi (75% LTV) — recoverable capital for the next deal without selling this one.
Negotiation context
- It's been on market 89 days — a 6% lower offer ($179k) is reasonable based on typical stale-listing flexibility.
Risks & watch-outs
- Watch-outs: built in 1955 — expect roof / HVAC / electrical / plumbing capex.
Questions for the listing agent
- What do current leases actually rent for vs. the listed asking? Can we see a recent rent roll and the last 12 months of T-12 income?
- It's been on market 89 days. Have you received any prior offers? Is the seller open to a 27% concession, seller financing, or rate buy-down credit?
- Built in 1955 — when were the roof, HVAC, electrical panel, plumbing, and water heater last replaced?
- Why hasn't it sold? Are there any deal-killer items the seller is aware of (foundation, flood, title, zoning, code violations)?
- Is there a deadline driving the sale (1031 exchange, divorce, estate, relocation)? That informs how much negotiation room exists.
- The area grade is low — what's the realistic commute time and amenity access for the typical tenant pool here? Any planned neighborhood developments (good or bad) we should know about?
- What's the average days-on-market for RENTAL listings here right now (not sales)? A rising rental-DOM trend means longer vacancies and softer asking-rent achievability than the comps imply.
- What's the recent tenant-quality profile in this submarket — average credit score on applications, eviction rate, late-payment / NSF rate, and stable-employment percentage? A property-management company in the area should have these aggregated.
- How much new for-sale + rental construction is in the pipeline within 1–3 miles? Heavy new supply typically softens prices + rents 12–24 months out; constrained supply supports both.
Investment metrics
- 1% rule
- 0.73% ✗
- Cap rate
- 5.64%
- Cash-on-cash
- -2.33%
- DSCR
- 0.90
- GRM
- 11.5
CMA / ARV
No comps found within radius.
Projected returns pro-forma
3.95% appreciation · 3.0% rent growth · sell at horizon
- IRR
- 8.1%
- Equity multiple
- 1.49×
- Total profit
- $25,986
- Equity at exit
- $95,786
- IRR
- 10.2%
- Equity multiple
- 2.69×
- Total profit
- $90,140
- Equity at exit
- $156,230
Cash invested: $53,200 (down + closing). Projections, not guarantees.
Landlord ↔ Tenant lean methodology
- Overall (STATE)
- 82 Strongly Landlord-Friendly
- State North Dakota
- 82 Strongly Landlord-Friendly · R+20
- County
- — inherits STATE
- City
- — inherits STATE
ZIP-level market 58784
- Home prices YoY
- 3.1%
- Active inventory
- 25
- Price-to-rent
- 11.5×
Monthly cashflow live
- Estimated rent
- $1,381 medium interval (Pro) →
- Mortgage (P&I)
- −$996
- Tax from tax record
- −$118 /mo · $1,421/yr
- Insurance
- −$79
- HOA
- −$0
- Lot rent
- −$0
- Vacancy / Maint / Mgmt
- −$290
- Net cashflow
- $-103
Break-even live
Sensitivity live
| Price | -10% $4 | -5% $-50 | +0% $-103 | +5% $-157 | +10% $-211 |
|---|---|---|---|---|---|
| Rent | -10% $-212 | -5% $-158 | +0% $-103 | +5% $-49 | +10% $6 |
| Rate | -1.0pp $-8 | -0.5pp $-55 | base $-103 | +0.5pp $-153 | +1.0pp $-203 |
UW: 25.0% down · 7.5% · 30yr · 1.5% tax · 5.0% vac · 8.0% maint · 8.0% mgmt
Financing live
Cash to close
- Down payment
- $47,500
- Closing costs
- $5,700
- Reserves months
- —
- Total cash needed
- —
Loan-product check · same deal, 3 products live
Conventional
25% down · 7.5% · 30yr
- Down + closing
- —
- Monthly P&I
- —
- Monthly cashflow
- —
- DSCR
- —
- Eligible?
- —
Personal DTI + credit; lowest rate.
DSCR
20% down · 8.5% · 30yr
- Down + closing
- —
- Monthly P&I
- —
- Monthly cashflow
- —
- DSCR
- —
- Eligible?
- —
No personal income docs; deal must DSCR.
Hard money
10% down · 12.0% · 12mo
- Down + closing
- —
- Monthly P&I
- —
- Monthly cashflow
- —
- DSCR
- —
- Eligible?
- —
Short-term bridge; refi at stabilization.
Listing history 20 events
-
2026-06-22days on market $190,000 Active 89 DOM
-
2026-06-21days on market $190,000 Active 88 DOM
-
2026-06-21days on market $190,000 Active 87 DOM
-
2026-06-18days on market $190,000 Active 85 DOM
-
2026-06-17days on market $190,000 Active 84 DOM
-
2026-06-16days on market $190,000 Active 83 DOM
-
2026-06-15days on market $190,000 Active 82 DOM
-
2026-06-13days on market $190,000 Active 80 DOM
-
2026-06-12days on market $190,000 Active 79 DOM
-
2026-06-09days on market $190,000 Active 76 DOM
-
2026-06-08days on market $190,000 Active 75 DOM
-
2026-06-07statusdays on market $190,000 Active 74 DOM
-
2026-06-05days on market $190,000 Active Under Contract 72 DOM
-
2026-06-04days on market $190,000 Active Under Contract 70 DOM
-
2026-06-02days on market $190,000 Active Under Contract 69 DOM
-
2026-06-01days on market $190,000 Active Under Contract 68 DOM
-
2026-05-31days on market $190,000 Active Under Contract 67 DOM
-
2026-05-05historical Active Under Contract
-
2026-03-25$190,000 Active
-
2016-09-16soldstatus
ⓘ Source: listings_history table (triggers on properties + properties_extension) + one-shot
backfill from property_details.listing_events for pre-trigger history.
Tax reassessment forecast ND · Resets to sale price
- Current annual tax
- $1,421 · $118/mo
- Projected year-2 tax
- $1,862 · $155/mo
- Expected delta
- +$441/yr (+$37/mo · 31.0%)
ⓘ Screening estimate from a state-policy table — verify with the county assessor before closing.
Climate risk First Street
- Flood 4/10 Moderate 20% chance over 30 yrs
- Wildfire 3/10 Moderate
- Heat 1/10 Low 7 d/yr ≥93°F today · 12 d/yr by 30 yrs out
- Wind 1/10 Low
- Air quality 5/10 Major 7 unhealthy d/yr today · 7 by 30 yrs out
Nearby sold comps map
Loading sold comps map…
Walkable amenities ~0.75 mi
Loading nearby amenities…
Taxation est. · year 1
- Rental income
- $16,566
- − Mortgage interest
- −$10,643
- − Property taxes
- −$1,421
- − Insurance
- −$950
- − Repairs & maintenance
- −$1,325
- − Management
- −$1,325
- − Depreciation
- −$5,527
- Taxable loss
- −$4,625
- Est. tax savings @ 24.0%
- +$1,110
- After-tax cash flow
- $-130/yr
For passive investors: Depreciation is non-cash, so a rental often shows a tax loss while cash-flowing — sheltering income. Rental losses are passive: they offset passive income freely, and up to $25,000/yr can offset ordinary (W-2) income if you actively participate and your MAGI is under $100k (phasing out to $0 by $150k); unused losses carry forward. On sale, claimed depreciation is recaptured at up to 25%, and gains may owe capital-gains tax (a 1031 exchange can defer both). Figures are a year-1 estimate at your 24.0% rate — not tax advice; consult a CPA.
Schools (NCES district)
- District
- Stanley 2
- NCES district ID
- 3817570
- Math proficiency
- 21% ▼ -3.00%
- Reading proficiency
- 37% ▼ -5.00%
- Median HH income
- $64,306
- Composite
- 26.68/100
- National rank
- #7160
- State rank
- #41 of 53 in ND
Livability — Stanley
- Score
- 76/100
- State rank
- #17
- US rank
- #3477
Category grades
Schools grade is shown separately in the Schools card above.
Census & demographics
- Census place
- Stanley, ND
- Population (ZIP)
- 2,728
Population outlook (Mountrail County) Hauer SSP2
- Today (2025)
- 16,354 people
- By 2030
- 19,818 · +21.2%
- By 2040
- 27,393 · +67.5%
- By 2050
- 35,721 · +118.4%
- By 2075
- 59,193 · +261.9%
- By 2100
- 81,883 · +400.7%
Race, ethnicity, and origin ACS 2023
- Neighborhood character
- Predominantly White (84%)
- Race & ethnicity
- White 84% Hispanic / Latino 10% Two or more races 10% Native American 3%
- Hispanic origin (detail)
- Mexican 5%
- Common ancestry
- Portuguese 26% Scottish 2% Scotch-Irish 1%
- Foreign-born
- 3% · Canada
- Languages at home
- 88% English-only · Spanish 11% Arabic 1%
Political lean MEDSL · Mountrail
- 2024 margin
- Solid R (+43.1) · D 27.7% · R 70.9% · Other 1.4%
- 2008→2024 swing
- -45.6pp toward R · 2008: 2.4pp · 2024: -43.1pp
- All cycles
- 2024: R+43.1 2020: R+37.6 2016: R+33.4 2012: R+16.2 2008: D+2.4
Not yet ingested
- Civics
- —
Market trends
- HPI YoY
- ▲ 3.95%
- Current HPI
- 132.7513
- Rent YoY
- —
- Metro
- —
- State GDP YoY
- ▲ 2.09%
- F500 in state
- 2
Industry mix (Fortune 500 HQ in ND)
| Industry | F500 HQs | Revenue |
|---|---|---|
| Utilities / Construction | 1 | $6B |
|
||
Price history
3 events — show timeline
- 2026-05-05 Contingent — MMLS
- 2026-03-25 Listed $190,000 MMLS
- 2016-09-16 Sold (Public Records) — Public Records
Property tax history
+0.5%/yrLatest (2025): $1,421 · +0.7% YoY. Source: county tax records.
Cash-flow waterfall
monthlySold comps — $/sqft
last 12 mo · ≤1 miLoading sold comps…