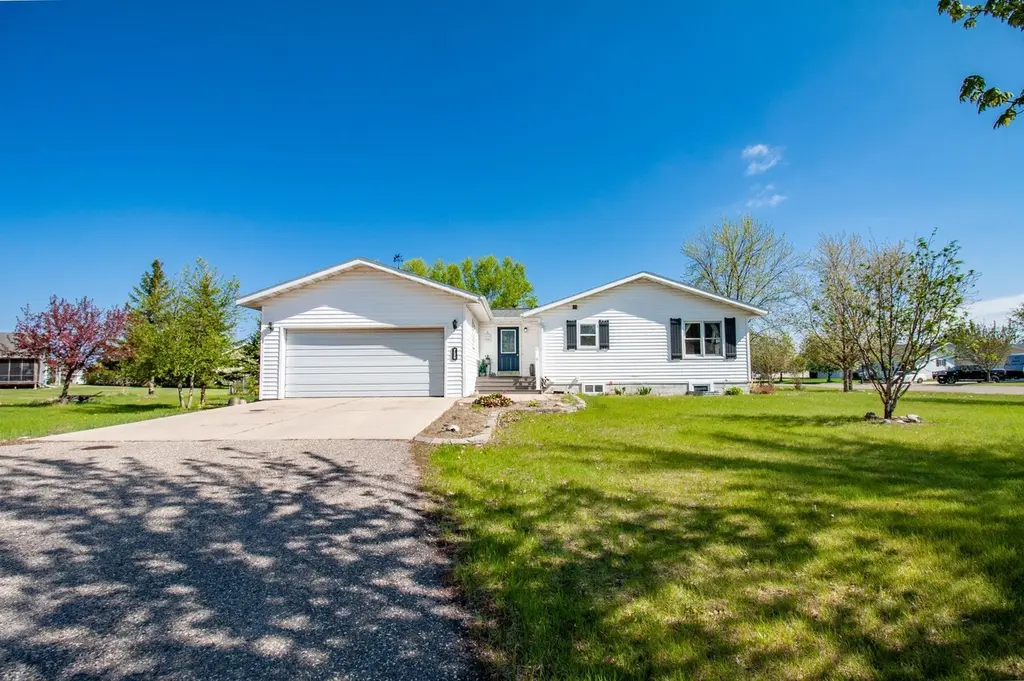
720 6th Dr NW · Perham, MN
Flood risk 1/10 · Minimal
- FEMA flood zone
- —
- Chance of flooding over 30 yrs
- 0.0%
- Est. flood insurance / yr
- —
Fire risk 3/10 · Minor
- Est. fire insurance / yr
- $888 – $1,650
Heat risk 2/10 · Minimal
- Hot days now (above 97°F)
- 7 days/yr
- Hot days in 30 yrs
- 12 days/yr
Wind risk 2/10 · Minimal
- Chance of severe wind over 30 yrs
- —
Air-quality risk 3/10 · Minor
- Unhealthy air days now
- 2 days/yr
- Unhealthy air days in 30 yrs
- 3 days/yr
Risk factors via First Street. Map © Google.
Why this score? — see what drove the C grade
The composite is a weighted blend of 9 inputs, each scored 0–100. Each bar is that input's sub-score; the figure is the points it added to the 100-point composite (weight × sub-score).
- Cash flow +25.1/30.0
- DSCR +8.2/10.0
- ARV discount +7.5/15.0
- 1% rule +5.8/10.0
- Schools +4.4/10.0
- Livability +3.5/5.0
- Rent growth +2.5/5.0
- Condition / age +2.5/5.0
- Appreciation +0.0/10.0
$289,000
🖨 Deal sheet (PDF) 📄 Offer letter ✓ Due diligence
Listing remarks
Welcome to this beautifully maintained 4-bed, 2-bath home on a spacious corner lot in sought-after Westwind. This inviting one-story features hardwood floors throughout the main level and a functional layout. Main floor offers 2 bedrooms, full bath, formal dining, and kitchen with newer appliances and gas range. Main-floor laundry hookups add flexibility. Finished lower level offers 2 additional bedrooms and a full bath. One oversized 24x12 room adds flexibility for a family room, office, or guest suite. Notable updates include a furnace replaced in September and central air. Exterior features vinyl siding, attached 2-stall garage, and a spacious yard. Conveniently located near parks, walki
Key facts
- Newer appliances
- Functional layout
- Hardwood floors
Tags
Property features AI
Exterior
- Parking: Attached garage (2 cars)
- Utilities: City water connected; City sewer connected; Electric and natural gas service
- Home design: Residential property; One level (with lower/finished basement); Approximately 2,300 total living area
- Construction: Block foundation
- Exterior features: Vinyl exterior; Corner lot
Interior
- Kitchen: Dishwasher; Range; Refrigerator
- Bedrooms: 4 bedrooms (mix of main and lower levels)
- Bathrooms: 2 full bathrooms (one on main floor, one in finished basement)
- Heating & cooling: Forced air heating; Baseboard heating; Central air conditioning
- Interior features: Finished full basement with block foundation; Separate/formal dining room; Mud room
- Laundry & utility: Washer and dryer (laundry located in basement); Utility room in lower level
Neighborhood map
What this means for you Summary
Snapshot
- This is a 4-bed/2.0-bath single-family listed at $289k.
Deal economics
- At list price, monthly cash flow is $639 ($8k/yr) — positive.
- The deal already cash-flows at list — no discount required.
- Meets the 1% rule at list price ($3k rent vs $289k).
- Recommended offer: $285k (1.5% below list) — sets the bar for market timing.
- Cap rate 8.9% vs local median 6.0% in Perham — top-decile yield for the area; either an underpriced asset or a hidden risk that comps aren't pricing in. Stress-test before assuming the spread holds.
Location & tenants
- Location reads 70/100 on livability (#328 in MN) — a middle-class / working-renter tenant base. Strengths: crime A+, cost of living A+, health & safety A+; Watch: amenities F, commute F, employment F.
- Perham-Dent Public School District (town): math 45% / reading 57% proficiency, ranked #110 of 301 in MN (top 36%) — acceptable for families but not a draw, mixed tenant base, ~2y average lease.
- Zoned schools: Heart of The Lake Elementary (math 54% / reading 51%, grade C-, #364 of 857 statewide, top 43%, 575 students, 47% FRL); Prairie Wind Middle (math 44% / reading 59%, grade C, #65 of 258 statewide, top 26%, 515 students, 38% FRL); Perham Senior High (math 37% / reading 62%, grade D, #143 of 471 statewide, top 33%, 505 students, 36% FRL).
- Market conditions: 93 active listings in the ZIP; 2 comparable units currently listed for rent nearby; 140 units permitted in Otter Tail County in 2024 (48 in 5+ unit buildings).
Forward outlook
- Local home prices are declining (-3.0%/yr); year-one equity from $2k of loan paydown is wiped out by about $9k of value loss. Plan a longer hold.
Negotiation context
- It's been on market 30 days — a 2% lower offer ($285k) is reasonable based on typical stale-listing flexibility.
- 8 sale attempts since 26y ago with the ask held roughly flat each time — persistent listings suggest the price (not the market) is what's stuck; bring a comps-based counter.
- Current owner paid $183k; list at $289k implies a 58% gain — meaningful room to come down on a strong offer.
Questions for the listing agent
- Is there a deadline driving the sale (1031 exchange, divorce, estate, relocation)? That informs how much negotiation room exists.
- Schools are B-rated — typically a magnet for longer-tenancy family renters. What's the average tenant stay here, and is there a school-zone premium baked into asking?
- What's the average days-on-market for RENTAL listings here right now (not sales)? A rising rental-DOM trend means longer vacancies and softer asking-rent achievability than the comps imply.
- What's the recent tenant-quality profile in this submarket — average credit score on applications, eviction rate, late-payment / NSF rate, and stable-employment percentage? A property-management company in the area should have these aggregated.
- How much new for-sale + rental construction is in the pipeline within 1–3 miles? Heavy new supply typically softens prices + rents 12–24 months out; constrained supply supports both.
Investment metrics
- 1% rule
- 1.08% ✓
- Cap rate
- 8.94%
- Cash-on-cash
- 9.47%
- DSCR
- 1.42
- GRM
- 7.7
CMA / ARV
No comps found within radius.
Projected returns pro-forma
-3.0% appreciation · 3.0% rent growth · sell at horizon
- IRR
- -2.0%
- Equity multiple
- 0.92×
- Total profit
- $-6,212
- Equity at exit
- $43,091
- IRR
- 7.6%
- Equity multiple
- 1.58×
- Total profit
- $46,739
- Equity at exit
- $24,987
Cash invested: $80,920 (down + closing). Projections, not guarantees.
Landlord ↔ Tenant lean methodology
- Overall (STATE)
- 46 Balanced
- State Minnesota
- 46 Balanced · D+2
- County
- — inherits STATE
- City
- — inherits STATE
ZIP-level market 56573
- Home prices YoY
- -15.8%
- Active inventory
- 93
- Price-to-rent
- 7.7×
Monthly cashflow live
- Estimated rent
- $3,125 medium interval (Pro) →
- Mortgage (P&I)
- −$1,516
- Tax from tax record
- −$194 /mo · $2,330/yr
- Insurance
- −$120
- HOA
- −$0
- Vacancy / Maint / Mgmt
- −$656
- Net cashflow
- $639
Break-even live
Sensitivity live
| Price | -10% $802 | -5% $720 | +0% $639 | +5% $557 | +10% $475 |
|---|---|---|---|---|---|
| Rent | -10% $392 | -5% $515 | +0% $639 | +5% $762 | +10% $885 |
| Rate | -1.0pp $784 | -0.5pp $712 | base $639 | +0.5pp $564 | +1.0pp $488 |
UW: 25.0% down · 7.5% · 30yr · 1.5% tax · 5.0% vac · 8.0% maint · 8.0% mgmt
Financing live
Cash to close
- Down payment
- $72,250
- Closing costs
- $8,670
- Reserves months
- —
- Total cash needed
- —
Loan-product check · same deal, 3 products live
Conventional
25% down · 7.5% · 30yr
- Down + closing
- —
- Monthly P&I
- —
- Monthly cashflow
- —
- DSCR
- —
- Eligible?
- —
Personal DTI + credit; lowest rate.
DSCR
20% down · 8.5% · 30yr
- Down + closing
- —
- Monthly P&I
- —
- Monthly cashflow
- —
- DSCR
- —
- Eligible?
- —
No personal income docs; deal must DSCR.
Hard money
10% down · 12.0% · 12mo
- Down + closing
- —
- Monthly P&I
- —
- Monthly cashflow
- —
- DSCR
- —
- Eligible?
- —
Short-term bridge; refi at stabilization.
Rent comps 2 comps
| Address | Beds | Baths | Sqft | Rent | $/sqft | DOM | Units | Dist |
|---|---|---|---|---|---|---|---|---|
| 812 7th St SW Unit A Perham, MN | 3.0 | 2.0 | 1602 | $3,750 | $2.34 | 45d | 1 | 1.15mi |
| 812 7th St SW Unit B Perham, MN | 3.0 | 2.0 | 1602 | $2,500 | $1.56 | 45d | 1 | 1.15mi |
Listing history 34 events
-
2026-06-21days on market $289,000 Active 30 DOM
-
2026-06-21days on market $289,000 Active 29 DOM
-
2026-06-18days on market $289,000 Active 27 DOM
-
2026-06-17days on market $289,000 Active 26 DOM
-
2026-06-16days on market $289,000 Active 25 DOM
-
2026-06-15days on market $289,000 Active 24 DOM
-
2026-06-13days on market $289,000 Active 22 DOM
-
2026-06-12days on market $289,000 Active 21 DOM
-
2026-06-09days on market $289,000 Active 18 DOM
-
2026-06-08days on market $289,000 Active 17 DOM
-
2026-06-07days on market $289,000 Active 16 DOM
-
2026-06-07days on market $289,000 Active 15 DOM
-
2026-06-04days on market $289,000 Active 12 DOM
-
2026-06-02days on market $289,000 Active 11 DOM
-
2026-06-01days on market $289,000 Active 10 DOM
-
2026-05-31days on market $289,000 Active 9 DOM
-
2026-05-31days on market $289,000 Active 8 DOM
-
2026-05-22$289,000 Active
-
2026-02-16historical
-
2026-02-02historical
-
2026-02-01$299,000 Active
-
2025-10-02price $299,000
-
2025-08-01$310,000 Active
-
2018-10-08soldstatus $183,000
-
2018-10-01soldstatus $183,000
-
2018-06-12$198,000
-
2013-10-10soldstatus $146,700
-
2013-10-10soldstatus $146,700
-
2013-08-20$149,000
-
2013-08-20$149,000
-
2007-03-23soldstatus $129,000
-
2001-08-04soldstatus $94,500
-
2001-05-01$96,500
-
2000-01-19$99,500
ⓘ Source: listings_history table (triggers on properties + properties_extension) + one-shot
backfill from property_details.listing_events for pre-trigger history.
Tax reassessment forecast MN · Partial reset (capped growth)
- Current annual tax
- $2,330 · $194/mo
- Projected year-2 tax
- $2,783 · $232/mo
- Expected delta
- +$453/yr (+$38/mo · 19.5%)
ⓘ Screening estimate from a state-policy table — verify with the county assessor before closing.
Climate risk First Street
- Flood 1/10 Low 0% chance over 30 yrs
- Wildfire 3/10 Moderate
- Heat 2/10 Low 7 d/yr ≥97°F today · 12 d/yr by 30 yrs out
- Wind 2/10 Low
- Air quality 3/10 Moderate 2 unhealthy d/yr today · 3 by 30 yrs out
Nearby sold comps map
Loading sold comps map…
Walkable amenities ~0.75 mi
Loading nearby amenities…
Taxation est. · year 1
- Rental income
- $37,500
- − Mortgage interest
- −$16,188
- − Property taxes
- −$2,330
- − Insurance
- −$1,445
- − Repairs & maintenance
- −$3,000
- − Management
- −$3,000
- − Depreciation
- −$8,407
- Taxable income
- $3,129
- Est. tax owed @ 24.0%
- −$751
- After-tax cash flow
- $6,912/yr
For passive investors: Depreciation is non-cash, so a rental often shows a tax loss while cash-flowing — sheltering income. Rental losses are passive: they offset passive income freely, and up to $25,000/yr can offset ordinary (W-2) income if you actively participate and your MAGI is under $100k (phasing out to $0 by $150k); unused losses carry forward. On sale, claimed depreciation is recaptured at up to 25%, and gains may owe capital-gains tax (a 1031 exchange can defer both). Figures are a year-1 estimate at your 24.0% rate — not tax advice; consult a CPA.
Schools (NCES district)
- District
- Perham-Dent Public School District
- NCES district ID
- 2728230
- Math proficiency
- 45% ▼ -14.00%
- Reading proficiency
- 57% ▼ -5.00%
- Median HH income
- $50,712
- Composite
- 43.64/100
- National rank
- #2966
- State rank
- #110 of 301 in MN
Livability — Perham
- Score
- 70/100
- State rank
- #328
- US rank
- #7425
Category grades
Schools grade is shown separately in the Schools card above.
Census & demographics
- Census place
- Perham, MN
- Population (ZIP)
- 6,868
Population outlook (Otter Tail County) Hauer SSP2
- Today (2025)
- 58,183 people
- By 2030
- 58,267 · +0.1%
- By 2040
- 57,999 · -0.3%
- By 2050
- 57,183 · -1.7%
- By 2075
- 57,638 · -0.9%
- By 2100
- 54,697 · -6.0%
Race, ethnicity, and origin ACS 2023
- Neighborhood character
- Predominantly White (86%)
- Race & ethnicity
- White 86% Hispanic / Latino 9% Two or more races 6% Black 1%
- Hispanic origin (detail)
- Mexican 2% Dominican 1%
- Common ancestry
- Portuguese 18% Romanian 6% Lithuanian 3%
- Foreign-born
- 5% · Canada
- Languages at home
- 92% English-only · Spanish 7%
Political lean MEDSL · Otter Tail
- 2024 margin
- Solid R (+34.2) · D 32.1% · R 66.3% · Other 1.6%
- 2008→2024 swing
- -21.3pp toward R · 2008: -12.9pp · 2024: -34.2pp
- All cycles
- 2024: R+34.2 2020: R+32.5 2016: R+35.9 2012: R+21.2 2008: R+12.9
Not yet ingested
- Civics
- —
Market trends
- HPI YoY
- ▼ -42.48%
- Current HPI
- 225.7071
- Rent YoY
- —
- Metro
- —
- State GDP YoY
- ▲ 2.41%
- F500 in state
- 34
Industry mix (Fortune 500 HQ in MN)
| Industry | F500 HQs | Revenue |
|---|---|---|
| Healthcare | 2 | $407B |
|
||
| Retail | 2 | $150B |
|
||
| Consumer Goods | 2 | $32B |
|
||
| Industrial Machinery | 2 | $6B |
|
||
| Agriculture | 1 | $40B |
|
||
| Healthcare / Medical Devices | 1 | $32B |
|
||
Price history
+190.5% since first listed17 events — show timeline
- 2026-05-22 Listed $289,000 NORTHSTARMLS as Distributed by MLS Grid
- 2026-02-16 Listing Removed — NORTHSTARMLS as Distributed by MLS Grid
- 2026-02-02 Listing Removed — NORTHSTARMLS as Distributed by MLS Grid
- 2026-02-01 Listed $299,000 NORTHSTARMLS as Distributed by MLS Grid
- 2025-10-02 Price Changed $299,000 NORTHSTARMLS as Distributed by MLS Grid
- 2025-08-01 Listed $310,000 NORTHSTARMLS as Distributed by MLS Grid
- 2018-10-08 Sold (Public Records) $183,000 Public Records
- 2018-10-01 Sold (MLS) $183,000 NORTHSTARMLS as Distributed by MLS Grid
- 2018-06-12 Listed $198,000 NORTHSTARMLS as Distributed by MLS Grid
- 2013-10-10 Sold (MLS) $146,700 NORTHSTARMLS as Distributed by MLS Grid
- 2013-10-10 Sold (MLS) $146,700 NORTHSTARMLS as Distributed by MLS Grid
- 2013-08-20 Listed $149,000 NORTHSTARMLS as Distributed by MLS Grid
- 2013-08-20 Listed $149,000 NORTHSTARMLS as Distributed by MLS Grid
- 2007-03-23 Sold (Public Records) $129,000 Public Records
- 2001-08-04 Sold (MLS) $94,500 NORTHSTARMLS as Distributed by MLS Grid
- 2001-05-01 Listed $96,500 NORTHSTARMLS as Distributed by MLS Grid
- 2000-01-19 Listed $99,500 NORTHSTARMLS as Distributed by MLS Grid
Property tax history
+5.5%/yrLatest (2025): $2,330 · +2.2% YoY. Source: county tax records.
Cash-flow waterfall
monthlySold comps — $/sqft
last 12 mo · ≤1 miLoading sold comps…