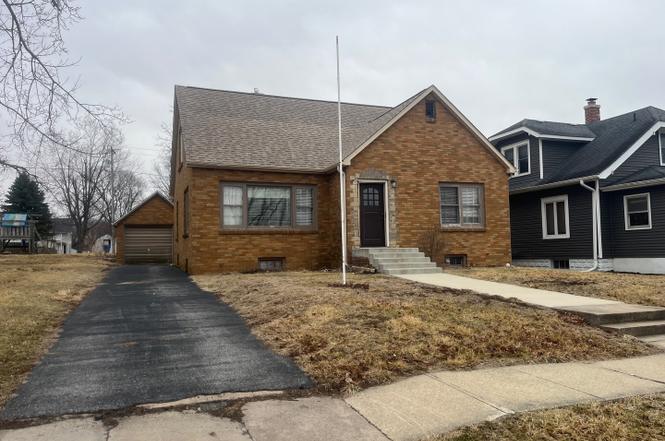
602 Washington Ave Ave · Lowden, IA
Flood risk 1/10 · Minimal
- FEMA flood zone
- X (unshaded)
- Chance of flooding over 30 yrs
- 0.0%
- Est. flood insurance / yr
- $473 – $860
Fire risk 1/10 · Minimal
- Est. fire insurance / yr
- $902 – $1,676
Heat risk 3/10 · Minor
- Hot days now (above 104°F)
- 7 days/yr
- Hot days in 30 yrs
- 15 days/yr
Wind risk 2/10 · Minimal
- Chance of severe wind over 30 yrs
- —
Air-quality risk 2/10 · Minimal
- Unhealthy air days now
- 2 days/yr
- Unhealthy air days in 30 yrs
- 2 days/yr
Risk factors via First Street. Map © Google.
Why this score? — see what drove the C- grade
The composite is a weighted blend of 9 inputs, each scored 0–100. Each bar is that input's sub-score; the figure is the points it added to the 100-point composite (weight × sub-score).
- ARV discount +15.0/15.0
- Cash flow +11.0/30.0
- Appreciation +7.7/10.0
- Schools +5.3/10.0
- Livability +3.5/5.0
- 1% rule +3.3/10.0
- DSCR +3.2/10.0
- Rent growth +2.5/5.0
- Condition / age +2.5/5.0
$154,000
🖨 Deal sheet (PDF) 📄 Offer letter ✓ Due diligence
Listing remarks MLS
This character-filled brick home features a charming entry that seamlessly flows into the spacious living room offering an abundance of natural light that highlights the arched doorways and original wood trim. The kitchen transitions to the formal dinning that connects to the kitchen making it the perfect layout of gathering and entertaining. The kitchen has been updated with new LVP flooring & comes complete with appliances. The primary bedroom & full bathroom are located on the main level for easy access. Head upstairs and capture the additional space featuring 2 additional bedrooms & a convenient 1/2 bath. A private driveway, detached 1-car garage, & well-sized yard complete the outdoor amenities this home has to offer. Newer High Efficiency Furnace, Electric WH [2020]; AC[1992] Listing Agent Related to Seller.
Key facts
- Original wood trim
- Arched doorways
- Brick home
Tags
Property features AI
Exterior
- Parking: Detached garage (1 garage space, 1 total parking space)
- Utilities: Public water; Public sewer; 100 amp electric service
- Home design: Detached single-family home; 1.5-story
- Construction: Frame construction; Block foundation; Built approximately 71–80 years ago; Home built before 1978
- Exterior features: Level lot; Lot dimensions approximately 56 x 157
Interior
- Kitchen: Dishwasher; Microwave; Range; Refrigerator
- Bedrooms: 3 bedrooms
- Bathrooms: 1 full bathroom; 2 half bathrooms; Basement includes a bathroom
- Heating & cooling: Forced air heating (natural gas); Central air conditioning
- Interior features: Separate dining room; Full basement with egress window
- Laundry & utility: Washer; Dryer; Electric water heater
Neighborhood map
What this means for you Summary
Snapshot
- This is a 3-bed/1.5-bath single-family listed at $154k.
Deal economics
- At list price, monthly cash flow is $-63 ($-761/yr) — negative.
- To cash-flow at today's rent, offer at most $143k (7.3% below list).
- To meet the 1% rule (rent ≥ 1% of price), the offer needs to be $128k (16.8% below list).
- Recommended offer: $128k (16.8% below list) — sets the bar for 1% rule.
Location & tenants
- Location reads 69/100 on livability (#384 in IA) — a middle-class / working-renter tenant base. Strengths: cost of living A+, housing A+, health & safety A-; Watch: amenities F, commute F.
- North Cedar Community School District (rural): math 61% / reading 63% proficiency, ranked #219 of 289 in IA (top 76%) — acceptable for families but not a draw, mixed tenant base, ~2y average lease.
- Zoned schools: North Cedar Jr/Sr High School (math 60% / reading 71%, grade B, #204 of 336 statewide, top 61%, 294 students, 41% FRL).
- Market conditions: 13 active listings in the ZIP; 89 units permitted in Cedar County in 2024 (40 in 5+ unit buildings).
Forward outlook
- In year one you build about $9k of equity ($1k loan paydown + $8k appreciation (5.4% local appreciation)).
- Cedar County population projected to shrink 9% by 2050 — rents likely to lag national; underwrite the cash flow, not the appreciation.
- At projected returns (5.4% appreciation + 3.0% rent growth), your $43k cash investment doubles in ~5 years — after that, you're playing with house money.
- By year 4, paydown + projected appreciation supports a ~$32k cash-out refi (75% LTV) — recoverable capital for the next deal without selling this one.
Negotiation context
- It's been on market 78 days — a 6% lower offer ($145k) is reasonable based on typical stale-listing flexibility.
- 9 sale attempts since 19y ago; this cycle's ask is 10% above the opening price — seller raised mid-cycle; expect resistance to lowballs.
Risks & watch-outs
- Watch-outs: built in 1948 — expect roof / HVAC / electrical / plumbing capex.
Questions for the listing agent
- What do current leases actually rent for vs. the listed asking? Can we see a recent rent roll and the last 12 months of T-12 income?
- It's been on market 78 days. Have you received any prior offers? Is the seller open to a 17% concession, seller financing, or rate buy-down credit?
- Built in 1948 — when were the roof, HVAC, electrical panel, plumbing, and water heater last replaced?
- Why hasn't it sold? Are there any deal-killer items the seller is aware of (foundation, flood, title, zoning, code violations)?
- Is there a deadline driving the sale (1031 exchange, divorce, estate, relocation)? That informs how much negotiation room exists.
- Schools are B-rated — typically a magnet for longer-tenancy family renters. What's the average tenant stay here, and is there a school-zone premium baked into asking?
- What's the average days-on-market for RENTAL listings here right now (not sales)? A rising rental-DOM trend means longer vacancies and softer asking-rent achievability than the comps imply.
- What's the recent tenant-quality profile in this submarket — average credit score on applications, eviction rate, late-payment / NSF rate, and stable-employment percentage? A property-management company in the area should have these aggregated.
- How much new for-sale + rental construction is in the pipeline within 1–3 miles? Heavy new supply typically softens prices + rents 12–24 months out; constrained supply supports both.
Investment metrics
- 1% rule
- 0.83% ✗
- Cap rate
- 5.80%
- Cash-on-cash
- -1.77%
- DSCR
- 0.92
- GRM
- 10.0
CMA / ARV
- ARV (on-the-fly)
- $186,915
- Comps found
- 4
Show comp detail 4 sales within ~0.75 mi
| Address | Dist | Beds/Ba | Sqft | Sold | Price | $/sf | Match |
|---|---|---|---|---|---|---|---|
| 602 Washington Ave | 0.00mi | 3/1.5 | 2,199 (0%) | 2mo | $137,500 | $63 | 99 |
| 410 7th St | 0.03mi | 3/2.0 | 2,400 (+9%) | 3mo | $218,000 | $91 | 79 |
| 902 Mckinley Ave | 0.17mi | 3/2.0 | 1,992 (-9%) | 18mo | $169,000 | $85 | 59 |
| 82 Main St | 0.48mi | 3/3.0 | 2,440 (+11%) | 13mo | $165,000 | $68 | 42 |
Match score weights: distance 35% · size 25% · config 20% · recency 20%. Top-matched comps best support the ARV.
Projected returns pro-forma
5.43% appreciation · 3.0% rent growth · sell at horizon
- IRR
- 12.5%
- Equity multiple
- 1.82×
- Total profit
- $35,332
- Equity at exit
- $91,368
- IRR
- 13.4%
- Equity multiple
- 3.52×
- Total profit
- $108,675
- Equity at exit
- $161,185
Cash invested: $43,120 (down + closing). Projections, not guarantees.
Landlord ↔ Tenant lean methodology
- Overall (STATE)
- 83 Strongly Landlord-Friendly
- State Iowa
- 83 Strongly Landlord-Friendly · R+6
- County
- — inherits STATE
- City
- — inherits STATE
ZIP-level market 52255
- Home prices YoY
- 3.2%
- Active inventory
- 13
- Price-to-rent
- 10.0×
Monthly cashflow live
- Estimated rent
- $1,281 medium interval (Pro) →
- Mortgage (P&I)
- −$808
- Tax from tax record
- −$204 /mo · $2,446/yr
- Insurance
- −$64
- HOA
- −$0
- Lot rent
- −$0
- Vacancy / Maint / Mgmt
- −$269
- Net cashflow
- $-63
Break-even live
Sensitivity live
| Price | -10% $24 | -5% $-20 | +0% $-63 | +5% $-107 | +10% $-151 |
|---|---|---|---|---|---|
| Rent | -10% $-165 | -5% $-114 | +0% $-63 | +5% $-13 | +10% $38 |
| Rate | -1.0pp $14 | -0.5pp $-24 | base $-63 | +0.5pp $-103 | +1.0pp $-144 |
UW: 25.0% down · 7.5% · 30yr · 1.5% tax · 5.0% vac · 8.0% maint · 8.0% mgmt
Financing live
Cash to close
- Down payment
- $38,500
- Closing costs
- $4,620
- Reserves months
- —
- Total cash needed
- —
Loan-product check · same deal, 3 products live
Conventional
25% down · 7.5% · 30yr
- Down + closing
- —
- Monthly P&I
- —
- Monthly cashflow
- —
- DSCR
- —
- Eligible?
- —
Personal DTI + credit; lowest rate.
DSCR
20% down · 8.5% · 30yr
- Down + closing
- —
- Monthly P&I
- —
- Monthly cashflow
- —
- DSCR
- —
- Eligible?
- —
No personal income docs; deal must DSCR.
Hard money
10% down · 12.0% · 12mo
- Down + closing
- —
- Monthly P&I
- —
- Monthly cashflow
- —
- DSCR
- —
- Eligible?
- —
Short-term bridge; refi at stabilization.
Listing history 23 events
-
2026-05-22status Active
-
2026-04-30soldstatus $137,500 Closed 843-char remark
Show marketing remark (843 chars)
This character-filled brick home features a charming entry that seamlessly flows into the spacious living room offering an abundance of natural light that highlights the arched doorways and original wood trim. The kitchen transitions to the formal dinning that connects to the kitchen making it the perfect layout of gathering and entertaining. The kitchen has been updated with new LVP flooring & comes complete with appliances. The primary bedroom & full bathroom are located on the main level for easy access. Head upstairs and capture the additional space featuring 2 additional bedrooms & a convenient 1/2 bath. A private driveway, detached 1-car garage, & well-sized yard complete the outdoor amenities this home has to offer. Newer High Efficiency Furnace, Electric WH [2020]; AC[1992] Listing Agent Related to Seller.
-
2026-03-16status Pending 843-char remark
Show marketing remark (843 chars)
This character-filled brick home features a charming entry that seamlessly flows into the spacious living room offering an abundance of natural light that highlights the arched doorways and original wood trim. The kitchen transitions to the formal dinning that connects to the kitchen making it the perfect layout of gathering and entertaining. The kitchen has been updated with new LVP flooring & comes complete with appliances. The primary bedroom & full bathroom are located on the main level for easy access. Head upstairs and capture the additional space featuring 2 additional bedrooms & a convenient 1/2 bath. A private driveway, detached 1-car garage, & well-sized yard complete the outdoor amenities this home has to offer. Newer High Efficiency Furnace, Electric WH [2020]; AC[1992] Listing Agent Related to Seller.
-
2026-03-10$139,700 Active 843-char remark
Show marketing remark (843 chars)
This character-filled brick home features a charming entry that seamlessly flows into the spacious living room offering an abundance of natural light that highlights the arched doorways and original wood trim. The kitchen transitions to the formal dinning that connects to the kitchen making it the perfect layout of gathering and entertaining. The kitchen has been updated with new LVP flooring & comes complete with appliances. The primary bedroom & full bathroom are located on the main level for easy access. Head upstairs and capture the additional space featuring 2 additional bedrooms & a convenient 1/2 bath. A private driveway, detached 1-car garage, & well-sized yard complete the outdoor amenities this home has to offer. Newer High Efficiency Furnace, Electric WH [2020]; AC[1992] Listing Agent Related to Seller.
-
2026-03-08historical
-
2026-01-29price $149,900
-
2026-01-16status Active
-
2026-01-14historical
-
2026-01-09price $154,000
-
2026-01-08status Active
-
2026-01-06historical
-
2026-01-05historical
-
2026-01-02status Active
-
2026-01-02historical
-
2025-12-08Active
-
2022-02-28soldstatus $150,000
-
2021-11-01$159,900
-
2021-08-26soldstatus $90,000
-
2008-04-23soldstatus $80,000
-
2008-04-22soldstatus $80,000
-
2008-04-22soldstatus $80,000
-
2007-03-12$84,900
-
2007-03-12$84,900
ⓘ Source: listings_history table (triggers on properties + properties_extension) + one-shot
backfill from property_details.listing_events for pre-trigger history.
Tax reassessment forecast IA · Partial reset (capped growth)
- Current annual tax
- $2,446 · $204/mo
- Projected year-2 tax
- $2,446 · $204/mo
- Expected delta
- $0/yr ($0/mo · 0.0%)
ⓘ Screening estimate from a state-policy table — verify with the county assessor before closing.
Climate risk First Street
- Flood 1/10 Low FEMA zone X (unshaded) · 0% chance over 30 yrs
- Wildfire 1/10 Low
- Heat 3/10 Moderate 7 d/yr ≥104°F today · 15 d/yr by 30 yrs out
- Wind 2/10 Low
- Air quality 2/10 Low 2 unhealthy d/yr today · 2 by 30 yrs out
Nearby sold comps map
Loading sold comps map…
Walkable amenities ~0.75 mi
Loading nearby amenities…
Taxation est. · year 1
- Rental income
- $15,374
- − Mortgage interest
- −$8,626
- − Property taxes
- −$2,446
- − Insurance
- −$770
- − Repairs & maintenance
- −$1,230
- − Management
- −$1,230
- − Depreciation
- −$4,480
- Taxable loss
- −$3,408
- Est. tax savings @ 24.0%
- +$818
- After-tax cash flow
- $57/yr
For passive investors: Depreciation is non-cash, so a rental often shows a tax loss while cash-flowing — sheltering income. Rental losses are passive: they offset passive income freely, and up to $25,000/yr can offset ordinary (W-2) income if you actively participate and your MAGI is under $100k (phasing out to $0 by $150k); unused losses carry forward. On sale, claimed depreciation is recaptured at up to 25%, and gains may owe capital-gains tax (a 1031 exchange can defer both). Figures are a year-1 estimate at your 24.0% rate — not tax advice; consult a CPA.
Schools (NCES district)
- District
- North Cedar Community School District
- NCES district ID
- 1917100
- Math proficiency
- 61% ▼ -5.00%
- Reading proficiency
- 63% ▼ -7.00%
- Median HH income
- $54,549
- Composite
- 53.17/100
- National rank
- #1507
- State rank
- #219 of 289 in IA
Livability — Lowden
- Score
- 69/100
- State rank
- #384
- US rank
- #8177
Category grades
Schools grade is shown separately in the Schools card above.
Census & demographics
- Census place
- Lowden, IA
- Population (ZIP)
- 1,100
Population outlook (Cedar County) Hauer SSP2
- Today (2025)
- 18,416 people
- By 2030
- 18,294 · -0.7%
- By 2040
- 17,771 · -3.5%
- By 2050
- 16,841 · -8.6%
- By 2075
- 14,503 · -21.2%
- By 2100
- 11,301 · -38.6%
Race, ethnicity, and origin ACS 2023
- Neighborhood character
- Predominantly White (94%)
- Race & ethnicity
- White 94% Hispanic / Latino 5% Two or more races 5%
- Hispanic origin (detail)
- Mexican 2%
- Common ancestry
- Romanian 6% Slovak 5% Portuguese 3%
- Languages at home
- 99% English-only · Spanish 1%
Political lean MEDSL · Cedar
- 2024 margin
- Strong R (+21.8) · D 38.4% · R 60.1% · Other 1.5%
- 2008→2024 swing
- -31.4pp toward R · 2008: 9.6pp · 2024: -21.8pp
- All cycles
- 2024: R+21.8 2020: R+17.0 2016: R+18.1 2012: D+4.4 2008: D+9.6
Not yet ingested
- Civics
- —
Market trends
- HPI YoY
- ▲ 5.43%
- Current HPI
- 175.6028
- Rent YoY
- —
- Metro
- —
- State GDP YoY
- ▲ 2.48%
- F500 in state
- 4
Industry mix (Fortune 500 HQ in IA)
| Industry | F500 HQs | Revenue |
|---|---|---|
| Financial Services | 1 | $16B |
|
||
| Retail / Convenience | 1 | $15B |
|
||
Price history
+62.0% since first listed23 events — show timeline
- 2026-05-22 Relisted — MRED as Distributed by MLS Grid
- 2026-04-30 Sold (MLS) $137,500 MRED as Distributed by MLS Grid
- 2026-03-16 Pending — MRED as Distributed by MLS Grid
- 2026-03-10 Listed $139,700 MRED as Distributed by MLS Grid
- 2026-03-08 Listing Removed — MRED as Distributed by MLS Grid
- 2026-01-29 Price Changed $149,900 MRED as Distributed by MLS Grid
- 2026-01-16 Relisted — MRED as Distributed by MLS Grid
- 2026-01-14 Listing Removed — MRED as Distributed by MLS Grid
- 2026-01-09 Price Changed $154,000 MRED as Distributed by MLS Grid
- 2026-01-08 Relisted — MRED as Distributed by MLS Grid
- 2026-01-06 Listing Removed — RMLSA as Distributed by MLS Grid
- 2026-01-05 Listing Removed — MRED as Distributed by MLS Grid
- 2026-01-02 Relisted — MRED as Distributed by MLS Grid
- 2026-01-02 Listing Removed — MRED as Distributed by MLS Grid
- 2025-12-08 Listed — RMLSA as Distributed by MLS Grid
- 2022-02-28 Sold (MLS) $150,000 CRAAR, CDRMLS
- 2021-11-01 Listed $159,900 CRAAR, CDRMLS
- 2021-08-26 Sold (Public Records) $90,000 Public Records
- 2008-04-23 Sold (Public Records) $80,000 Public Records
- 2008-04-22 Sold (MLS) $80,000 RMLSA as Distributed by MLS Grid
- 2008-04-22 Sold (MLS) $80,000 MRED as Distributed by MLS Grid
- 2007-03-12 Listed $84,900 RMLSA as Distributed by MLS Grid
- 2007-03-12 Listed $84,900 MRED as Distributed by MLS Grid
Property tax history
+3.3%/yrLatest (2025): $2,446 · +11.4% YoY. Source: county tax records.
Cash-flow waterfall
monthlySold comps — $/sqft
last 12 mo · ≤1 miLoading sold comps…