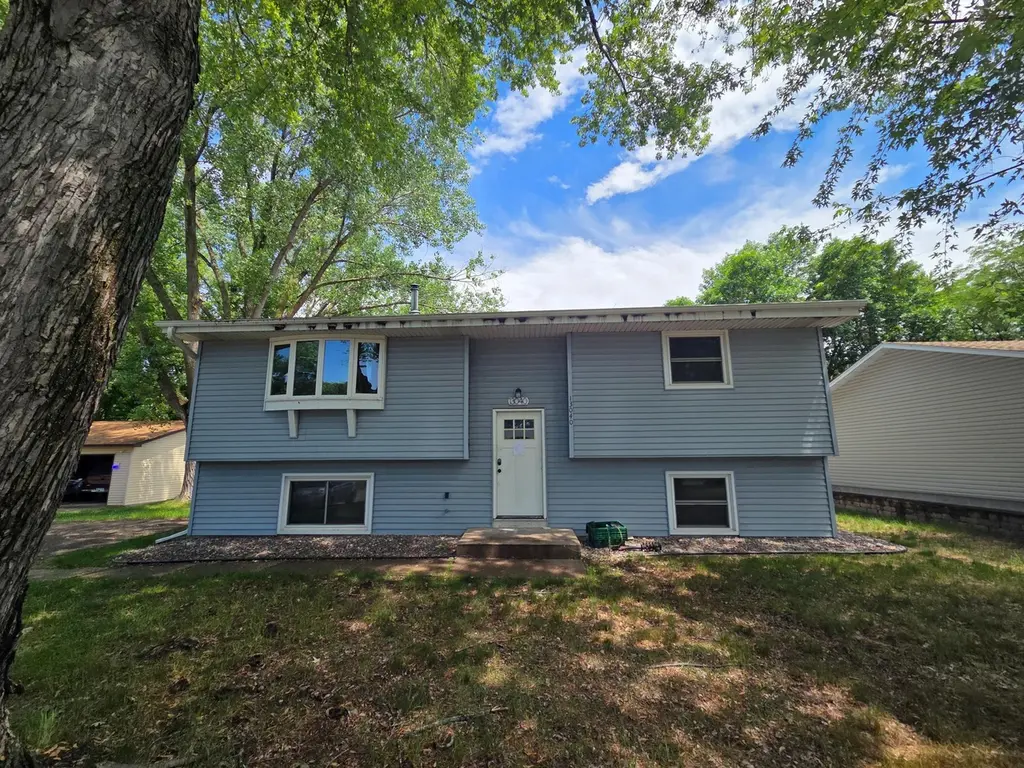
13040 Valley Forge Ln N · Champlin, MN
Flood risk 4/10 · Minor
- FEMA flood zone
- X (unshaded)
- Chance of flooding over 30 yrs
- 0.21%
- Est. flood insurance / yr
- $473 – $860
Fire risk 1/10 · Minimal
- Est. fire insurance / yr
- $888 – $1,650
Heat risk 2/10 · Minimal
- Hot days now (above 100°F)
- 7 days/yr
- Hot days in 30 yrs
- 14 days/yr
Wind risk 2/10 · Minimal
- Chance of severe wind over 30 yrs
- —
Air-quality risk 2/10 · Minimal
- Unhealthy air days now
- 2 days/yr
- Unhealthy air days in 30 yrs
- 2 days/yr
Risk factors via First Street. Map © Google.
Why this score? — see what drove the B grade
The composite is a weighted blend of 9 inputs, each scored 0–100. Each bar is that input's sub-score; the figure is the points it added to the 100-point composite (weight × sub-score).
- Cash flow +30.0/30.0
- 1% rule +10.0/10.0
- DSCR +10.0/10.0
- ARV discount +7.5/15.0
- Schools +4.7/10.0
- Livability +4.5/5.0
- Rent growth +2.5/5.0
- Condition / age +2.5/5.0
- Appreciation +0.0/10.0
$105,000
🖨 Deal sheet 📄 Offer letter ✓ Due diligence
Listing remarks
Investor special! Fire-damaged home with substantial damage to the rear of the property. Strong upside potential for rehab, rebuild, or redevelopment. Located on a desirable lot in an established neighborhood. Property is being sold strictly as-is. Seller makes no warranties regarding condition. Rare opportunity to add significant value.
Key facts
- Desirable lot
- 0.23 acre lot
- Built 1974
Tags
Property features AI
Finance
- Other: Living area reported as 1,600 sq ft (total building area 2,000 sq ft); Above-grade finished area reported as 1,000; below-grade finished area reported as 600; above- and below-grade totals listed as 1,000 each for some fields
- Financial info: Standard rental license in place
Exterior
- Parking: Asphalt parking
- Utilities: City water; City sewer; Electric and natural gas available
- Home design: Residential property; Split entry (bi-level) with two levels; Main/entry level plus lower level
- Construction: Block foundation; Foundation dimensions approximately 40 x 25
- Exterior features: Vinyl exterior; Lot approximately 0.23 acres (80 x 125)
Interior
- Bedrooms: 4 bedrooms
- Bathrooms: 1 full bathroom; 1 three-quarter bathroom
- Heating & cooling: Forced air heating; Central air conditioning
- Interior features: Partially finished basement; Split entry (bi-level) layout
Neighborhood map
What this means for you Summary
Snapshot
- This is a 3-bed/2.0-bath single-family listed at $105k.
Deal economics
- At list price, monthly cash flow is $910 ($11k/yr) — positive.
- The deal already cash-flows at list — no discount required.
- Meets the 1% rule at list price ($2k rent vs $105k).
- Cap rate 16.7% vs local median 3.9% in Champlin — top-decile yield for the area; either an underpriced asset or a hidden risk that comps aren't pricing in. Stress-test before assuming the spread holds.
Location & tenants
- Location reads 90/100 on livability (#4 in MN, #106 nationally) — a professional / high-income tenant draw. Strengths: commute A+, employment A+, housing A+.
- Anoka-Hennepin Public School District (suburban): math 49% / reading 55% proficiency, ranked #71 of 301 in MN (top 24%) — acceptable for families but not a draw, mixed tenant base, ~2y average lease.
- Market conditions: 106 active listings in the ZIP; 7 comparable units currently listed for rent nearby; rentals leasing fast (median 3d on market — plan ~1-2 weeks tenant-placement turnaround); high-income renter base; 4,651 units permitted in Hennepin County in 2024 (2,443 in 5+ unit buildings).
Forward outlook
- Local home prices are declining (-3.0%/yr); year-one equity from $726 of loan paydown is wiped out by about $3k of value loss. Plan a longer hold.
- Hennepin County population projected at +30% by 2050 — long-run rental-demand tailwind backs the buy-and-hold thesis.
- At projected returns (-3.0% appreciation + 3.0% rent growth), your $29k cash investment doubles in ~4 years — after that, you're playing with house money.
Negotiation context
- Only 2 days on market — expect competitive offers; lowballing is unlikely to land.
- 3 sale attempts with the ask held roughly flat each time — persistent listings suggest the price (not the market) is what's stuck; bring a comps-based counter.
Risks & watch-outs
- Watch-outs: property tax is 3.3% of price.
Questions for the listing agent
- Built in 1974 — when were the roof, HVAC, electrical panel, plumbing, and water heater last replaced?
- Property tax is high relative to price — has the assessment been appealed recently, and will the sale trigger a re-assessment?
- Is there a deadline driving the sale (1031 exchange, divorce, estate, relocation)? That informs how much negotiation room exists.
- Schools are A-rated — typically a magnet for longer-tenancy family renters. What's the average tenant stay here, and is there a school-zone premium baked into asking?
- What's the average days-on-market for RENTAL listings here right now (not sales)? A rising rental-DOM trend means longer vacancies and softer asking-rent achievability than the comps imply.
- What's the recent tenant-quality profile in this submarket — average credit score on applications, eviction rate, late-payment / NSF rate, and stable-employment percentage? A property-management company in the area should have these aggregated.
- How much new for-sale + rental construction is in the pipeline within 1–3 miles? Heavy new supply typically softens prices + rents 12–24 months out; constrained supply supports both.
Investment metrics
- 1% rule
- 2.16% ✓
- Cap rate
- 16.69%
- Cash-on-cash
- 37.12%
- DSCR
- 2.65
- GRM
- 3.9
CMA / ARV
No comps found within radius.
Projected returns pro-forma
-3.0% appreciation · 3.0% rent growth · sell at horizon
- IRR
- 33.1%
- Equity multiple
- 2.40×
- Total profit
- $41,044
- Equity at exit
- $15,656
- IRR
- 40.1%
- Equity multiple
- 4.77×
- Total profit
- $110,858
- Equity at exit
- $9,078
Cash invested: $29,400 (down + closing). Projections, not guarantees.
Landlord ↔ Tenant lean methodology
- Overall (STATE)
- 46 Balanced
- State Minnesota
- 46 Balanced · D+2
- County
- — inherits STATE
- City
- — inherits STATE
ZIP-level market 55316
- Active inventory
- 106
- Price-to-rent
- 3.9×
Monthly cashflow live
- Estimated rent
- $2,266 high interval (Pro) →
- Mortgage (P&I)
- −$551
- Tax from tax record
- −$286 /mo · $3,430/yr
- Insurance
- −$44
- HOA
- −$0
- Vacancy / Maint / Mgmt
- −$476
- Net cashflow
- $910
Break-even live
UW: 25.0% down · 7.5% · 30yr · 1.5% tax · 5.0% vac · 8.0% maint · 8.0% mgmt
Financing live
Cash to close
- Down payment
- $26,250
- Closing costs
- $3,150
- Reserves months
- —
- Total cash needed
- —
Loan-product check · same deal, 3 products live
Conventional
25% down · 7.5% · 30yr
- Down + closing
- —
- Monthly P&I
- —
- Monthly cashflow
- —
- DSCR
- —
- Eligible?
- —
Personal DTI + credit; lowest rate.
DSCR
20% down · 8.5% · 30yr
- Down + closing
- —
- Monthly P&I
- —
- Monthly cashflow
- —
- DSCR
- —
- Eligible?
- —
No personal income docs; deal must DSCR.
Hard money
10% down · 12.0% · 12mo
- Down + closing
- —
- Monthly P&I
- —
- Monthly cashflow
- —
- DSCR
- —
- Eligible?
- —
Short-term bridge; refi at stabilization.
Rent comps 7 comps
| Address | Beds | Baths | Sqft | Rent | $/sqft | DOM | Units | Dist |
|---|---|---|---|---|---|---|---|---|
| 13470 Linwood Forest Cir Champlin, MN | 4.0 | 3.0 | 1700 | $2,250 | $1.32 | 43d | 1 | 0.55mi |
| 807 Elm Creek Cir Champlin, MN | 3.0 | 1.0 | 1300 | $1,950 | $1.50 | 1d | 1 | 0.99mi |
| 2515 Fairoak Ave Anoka, MN | 1.0–2.0 | 1.0 | 950 | $1,560 | $1.64 | 2d | 18 | 1.15mi |
| 220 E River Pkwy Champlin, MN | 1.0–3.0 | 1.0–2.0 | 1079 | $3,347 | $3.10 | 1d | 14 | 1.15mi |
| 2901 Cutters Grove Ave Anoka, MN | 2.0–3.0 | 2.0 | 1155 | $2,365 | $2.05 | 1d | 7 | 1.35mi |
| 1718 2nd Ave Anoka, MN | 3.0 | 1.0 | 1300 | $1,750 | $1.35 | 16d | 1 | 1.39mi |
| 1718 2nd Ave Anoka, MN | 3.0 | 1.0 | 1300 | $1,850 | $1.42 | 43d | 1 | 1.39mi |
Listing history 3 events
-
2026-06-13statusdays on market $105,000 Pending 2 DOM
-
2026-06-10remarks 339-char remark
-
2026-06-10$105,000 Active 1 DOM
ⓘ Source: listings_history table (triggers on properties + properties_extension) + one-shot
backfill from property_details.listing_events for pre-trigger history.
Tax reassessment forecast MN · Partial reset (capped growth)
- Current annual tax
- $3,430 · $286/mo
- Projected year-2 tax
- $3,430 · $286/mo
- Expected delta
- $0/yr ($0/mo · 0.0%)
ⓘ Screening estimate from a state-policy table — verify with the county assessor before closing.
Climate risk First Street
- Flood 4/10 Moderate FEMA zone X (unshaded) · 21% chance over 30 yrs
- Wildfire 1/10 Low
- Heat 2/10 Low 7 d/yr ≥100°F today · 14 d/yr by 30 yrs out
- Wind 2/10 Low
- Air quality 2/10 Low 2 unhealthy d/yr today · 2 by 30 yrs out
Nearby sold comps map
Loading sold comps map…
Walkable amenities ~0.75 mi
Loading nearby amenities…
Taxation est. · year 1
- Rental income
- $27,186
- − Mortgage interest
- −$5,882
- − Property taxes
- −$3,430
- − Insurance
- −$525
- − Repairs & maintenance
- −$2,175
- − Management
- −$2,175
- − Depreciation
- −$3,055
- Taxable income
- $9,945
- Est. tax owed @ 24.0%
- −$2,387
- After-tax cash flow
- $8,528/yr
For passive investors: Depreciation is non-cash, so a rental often shows a tax loss while cash-flowing — sheltering income. Rental losses are passive: they offset passive income freely, and up to $25,000/yr can offset ordinary (W-2) income if you actively participate and your MAGI is under $100k (phasing out to $0 by $150k); unused losses carry forward. On sale, claimed depreciation is recaptured at up to 25%, and gains may owe capital-gains tax (a 1031 exchange can defer both). Figures are a year-1 estimate at your 24.0% rate — not tax advice; consult a CPA.
Schools (NCES district)
- District
- Anoka-Hennepin Public School District
- NCES district ID
- 2703180
- Math proficiency
- 49% ▼ -14.00%
- Reading proficiency
- 55% ▼ -10.00%
- Median HH income
- $73,837
- Composite
- 46.7/100
- National rank
- #2400
- State rank
- #71 of 301 in MN
Livability — Champlin
- Score
- 90/100
- State rank
- #4
- US rank
- #106
Category grades
Schools grade is shown separately in the Schools card above.
Census & demographics
- Census place
- Champlin, MN
- County
- Hennepin County · 1,150,272 people
- City population
- 23,294
- Metro
- Minneapolis-St. Paul-Bloomington, MN-WI
- Population (ZIP)
- 23,294
- Household income
- $116,102
- Rent vs Own
- Severe rent burden
- 270.0
Population outlook (Hennepin County) Hauer SSP2
- Today (2025)
- 1,405,227 people
- By 2030
- 1,492,650 · +6.2%
- By 2040
- 1,660,157 · +18.1%
- By 2050
- 1,823,498 · +29.8%
- By 2075
- 2,221,283 · +58.1%
- By 2100
- 2,509,976 · +78.6%
Race, ethnicity, and origin ACS 2023
- Neighborhood character
- Predominantly White (78%)
- Race & ethnicity
- White 78% Black 11% Asian 4% Two or more races 4% Hispanic / Latino 2%
- Common ancestry
- Portuguese 12% Romanian 4% Lithuanian 3%
- Foreign-born
- 11% · Canada, Vietnam, South Korea
- Languages at home
- 88% English-only · Russian/Polish/Slavic 2% Other Asian/Pacific 2% Spanish 1%
Political lean MEDSL · Hennepin
- 2024 margin
- Solid D (+42.6) · D 70.2% · R 27.5% · Other 2.3%
- 2008→2024 swing
- +14.0pp toward D · 2008: 28.6pp · 2024: 42.6pp
- All cycles
- 2024: D+42.6 2020: D+43.2 2016: D+35.3 2012: D+27.1 2008: D+28.6
Not yet ingested
- Civics
- —
Market trends
- HPI YoY
- ▼ -311.30%
- Current HPI
- 229.5956
- Rent YoY
- —
- Metro
- Minneapolis-St. Paul-Bloomington, MN-WI
- State GDP YoY
- ▲ 2.41%
- F500 in state
- 34
Industry mix (Fortune 500 HQ in MN)
| Industry | F500 HQs | Revenue |
|---|---|---|
| Healthcare | 2 | $407B |
|
||
| Retail | 2 | $150B |
|
||
| Consumer Goods | 2 | $32B |
|
||
| Industrial Machinery | 2 | $6B |
|
||
| Agriculture | 1 | $40B |
|
||
| Healthcare / Medical Devices | 1 | $32B |
|
||
Price history
+66.7% since first listed10 events — show timeline
- 2026-06-08 Listed $105,000 NORTHSTARMLS as Distributed by MLS Grid
- 2026-03-15 Rental Removed $2,730 RENTLY
- 2026-02-26 Listed for Rent $2,730 RENTLY
- 2025-08-11 Rental Removed $2,700 RENTLY
- 2025-08-03 Price Changed $2,700 RENTLY
- 2025-06-01 Listed for Rent $2,740 RENTLY
- 2022-04-08 Price Changed $2,250 RENT.
- 2021-09-27 Sold (Public Records) $205,000 Public Records
- 1981-11-01 Sold (Public Records) $66,500 Public Records
- 1980-01-01 Sold (Public Records) $63,000 Public Records
Property tax history
+3.7%/yrLatest (2025): $3,430 · +3.1% YoY. Source: county tax records.
Cash-flow waterfall
monthlySold comps — $/sqft
last 12 mo · ≤1 miLoading sold comps…