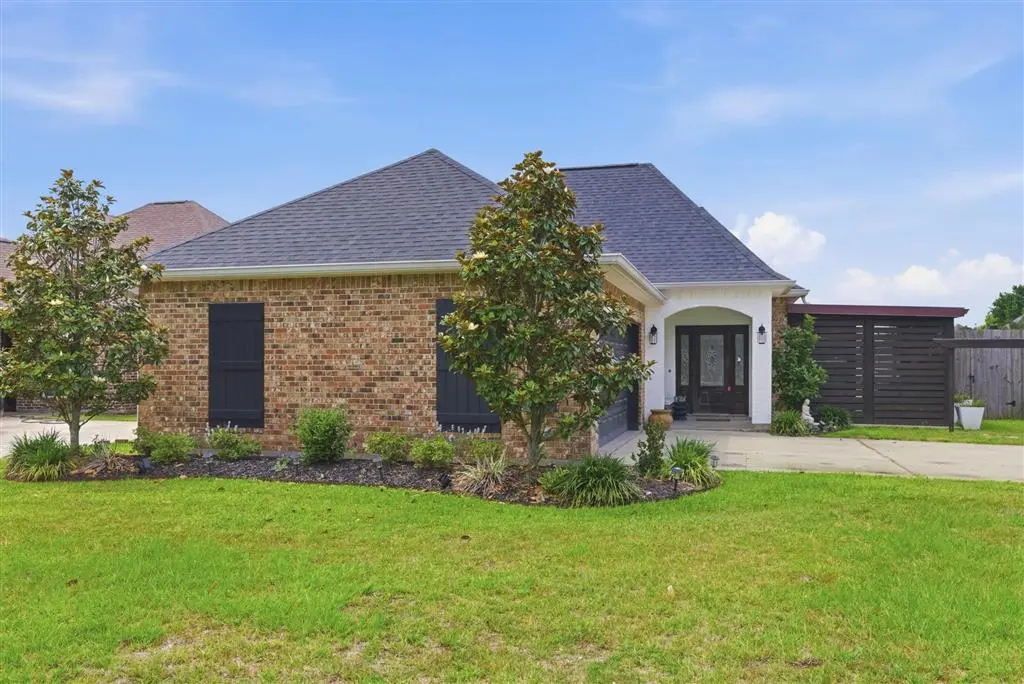
1040 Michelle Dr Dr · Sulphur, LA
Flood risk 5/10 · Moderate
- FEMA flood zone
- X (unshaded)
- Chance of flooding over 30 yrs
- 0.66%
- Est. flood insurance / yr
- $507 – $1,088
Fire risk 4/10 · Minor
- Est. fire insurance / yr
- $1,269 – $2,357
Heat risk 9/10 · Severe
- Hot days now (above 109°F)
- 7 days/yr
- Hot days in 30 yrs
- 23 days/yr
Wind risk 9/10 · Severe
- Chance of severe wind over 30 yrs
- 99.0%
Air-quality risk 2/10 · Minimal
- Unhealthy air days now
- 1 days/yr
- Unhealthy air days in 30 yrs
- 1 days/yr
Risk factors via First Street. Map © Google.
Why this score? — see what drove the D- grade
The composite is a weighted blend of 9 inputs, each scored 0–100. Each bar is that input's sub-score; the figure is the points it added to the 100-point composite (weight × sub-score).
- Cash flow +15.9/30.0
- DSCR +4.9/10.0
- Rent growth +4.4/5.0
- 1% rule +3.6/10.0
- Livability +3.6/5.0
- Schools +3.1/10.0
- Condition / age +2.5/5.0
- ARV discount +0.3/15.0
- Appreciation +0.0/10.0
$275,000
🖨 Deal sheet 📄 Offer letter ✓ Due diligence
Listing remarks MLS
This home is in mint, move-in condition. Very open floor plan located on a corner lot, landscaped, security system, fenced, covered patio perfect for entertaining, granite throughout and tumbled marble backsplash. Home owner will also supply a home warranty to buyer if buyer chooses one. All measurements M/L
Key facts
- Cul-de-sac location
- Brick accent wall
- Corner lot
Tags
Property features AI
Finance
- Other: City lot with paved city street frontage; Lot approximately 150' x 51' (0.18 acres); Has a view; Directions available to property
- HOA & community: Street lights; Sidewalks; Located in the FOREST PARK subdivision
Exterior
- Parking: Attached garage with 2 spaces; Driveway; Garage with garage door opener; Paved open parking
- Security: Smoke detectors; Fire alarm
- Utilities: Public water; Public sewer; Electricity connected; Water connected; Sewer connected
- Home design: Single-family house; One story; Faces north; Built by Joe Hardy; No shared/common walls
- Construction: Brick and stucco construction; Shingle roof; Slab foundation
- Exterior features: Outdoor lighting; Rain gutters; Covered porch and terrace; Privacy fencing
Interior
- Kitchen: Dishwasher; Garbage disposal; Microwave; Refrigerator; Range hood; Water heater
- Bedrooms: 3 bedrooms on the main level
- Bathrooms: 2 full bathrooms (both on the main level)
- Heating & cooling: Central heating; Central air conditioning
- Interior features: Crown molding; Granite counters; High ceilings; Open floor plan; Pantry; Recessed lighting; Double vanity; Gas fireplace
- Laundry & utility: Laundry room; Electric dryer hookup
Neighborhood map
What this means for you Summary
Snapshot
- This is a 3-bed/2.0-bath single-family listed at $275k.
Deal economics
- At list price, monthly cash flow is $131 ($2k/yr) — positive.
- The deal already cash-flows at list — no discount required.
- To meet the 1% rule (rent ≥ 1% of price), the offer needs to be $236k (14.2% below list).
- Recommended offer: $236k (14.2% below list) — sets the bar for 1% rule.
- Cap rate 6.9% vs local median 8.8% in Sulphur — below-typical yield; the buyer is paying a premium for something (appreciation thesis, condition, location) that the cap rate doesn't capture.
Location & tenants
- Location reads 71/100 on livability (#48 in LA) — a middle-class / working-renter tenant base. Strengths: cost of living A+, housing A+, health & safety A; Watch: crime D-, amenities F, commute F.
- Calcasieu Parish (other): math 30% / reading 44% proficiency, ranked #29 of 98 in LA (top 30%) — families likely to look elsewhere, expect single-tenant / working-renter base with shorter leases.
- Zoned schools: Maplewood Elementary (math 23% / reading 38%, grade F, #324 of 646 statewide, top 51%, 651 students, 55% FRL); Maplewood Middle School (math 31% / reading 50%, grade F, #62 of 218 statewide, top 29%, 335 students, 50% FRL) — zoned schools at 53% FRL track the district average.
- Market conditions: Rents rising fast (+7.7%/yr); 291 active listings in the ZIP; 7 comparable units currently listed for rent nearby; rentals lingering (median 44d on market — plan ~5-8 weeks vacancy on turnover, expect pricing pressure); 71% of comp listings sitting > 30 days — soft ceiling on asking rent; 1,298 units permitted in Calcasieu Parish in 2024 (526 in 5+ unit buildings).
- This rent runs 44% of the median local income ($65k/yr) — at the standard rent-burdened threshold; future hikes will face affordability resistance.
Forward outlook
- Local home prices are declining (-3.0%/yr); year-one equity from $2k of loan paydown is wiped out by about $8k of value loss. Plan a longer hold.
- Calcasieu County population projected at +11% by 2050 — modest demand growth; plan on rents tracking national, not racing it.
Negotiation context
- Only 10 days on market — expect competitive offers; lowballing is unlikely to land.
- 2 sale attempts since 11y ago with the ask held roughly flat each time — persistent listings suggest the price (not the market) is what's stuck; bring a comps-based counter.
- Current owner paid $212k; 30% above their basis — modest negotiation headroom, anchor on the comps not their cost.
Risks & watch-outs
- Climate carrying-cost: moderate flood risk; severe wind risk, 99% chance of damaging wind over 30y; extreme-heat days projected 7→23/yr by 2055 (HVAC capex compounding) — expect insurance premiums to compound above CPI over the hold.
Questions for the listing agent
- Is there a deadline driving the sale (1031 exchange, divorce, estate, relocation)? That informs how much negotiation room exists.
- Schools are A-rated — typically a magnet for longer-tenancy family renters. What's the average tenant stay here, and is there a school-zone premium baked into asking?
- Crime grade is D in this area — have there been break-ins, vandalism, or insurance claims at this property in the last 3 years? What carrier currently insures it and at what premium?
- The area grade is low — what's the realistic commute time and amenity access for the typical tenant pool here? Any planned neighborhood developments (good or bad) we should know about?
- What's the average days-on-market for RENTAL listings here right now (not sales)? A rising rental-DOM trend means longer vacancies and softer asking-rent achievability than the comps imply.
- What's the recent tenant-quality profile in this submarket — average credit score on applications, eviction rate, late-payment / NSF rate, and stable-employment percentage? A property-management company in the area should have these aggregated.
- How much new for-sale + rental construction is in the pipeline within 1–3 miles? Heavy new supply typically softens prices + rents 12–24 months out; constrained supply supports both.
Investment metrics
- 1% rule
- 0.86% ✗
- Cap rate
- 6.86%
- Cash-on-cash
- 2.04%
- DSCR
- 1.09
- GRM
- 9.7
CMA / ARV
- ARV (median comp)
- $236,909
- List price
- $275,000
- Delta
- 16.08%
- Verdict
- OVERPRICED
- Comps
- 20 within 1.0 mi
Show comp detail 11 sales within ~0.75 mi
| Address | Dist | Beds/Ba | Sqft | Sold | Price | $/sf | Match |
|---|---|---|---|---|---|---|---|
| 26 Horseshoe Ln | 0.32mi | 2/2.0 (-1) | 1,840 (+3%) | 1mo | $163,150 | $89 | 74 |
| 1415 Beth St | 0.44mi | 3/2.0 | 1,832 (+2%) | 3mo | $225,000 | $123 | 73 |
| 236 Genna Rd | 0.45mi | 3/2.0 | 1,751 (-2%) | 11mo | $249,000 | $142 | 66 |
| 1030 Michelle Dr | 0.05mi | 3/2.0 | 1,994 (+12%) | 15mo | $284,000 | $142 | 66 |
| 1005 Michelle Dr | 0.18mi | 3/2.0 | 1,992 (+12%) | 11mo | $285,000 | $143 | 63 |
| 202 Lynn Ln Ln | 0.50mi | 3/1.5 | 1,728 (-3%) | 8mo | $185,000 | $107 | 63 |
| 806 Frederick St | 0.60mi | 3/2.0 | 1,788 (+0%) | 11mo | $108,765 | $61 | 62 |
| 515 N Lebanon St N | 0.63mi | 3/2.0 | 1,728 (-3%) | 7mo | $179,700 | $104 | 60 |
| 1515 Camelia Ln | 0.48mi | 3/2.0 | 1,776 (-1%) | 21mo | $224,500 | $126 | 59 |
| 608 Shady Ln | 0.51mi | 3/3.0 | 1,903 (+6%) | 8mo | $215,000 | $113 | 54 |
| 2505 Jayson St | 0.73mi | 4/2.0 (+1) | 1,913 (+7%) | 1mo | $195,000 | $102 | 49 |
Match score weights: distance 35% · size 25% · config 20% · recency 20%. Top-matched comps best support the ARV.
Projected returns pro-forma
-3.0% appreciation · 7.65% rent growth · sell at horizon
- IRR
- -8.4%
- Equity multiple
- 0.68×
- Total profit
- $-24,754
- Equity at exit
- $41,003
- IRR
- 6.0%
- Equity multiple
- 1.53×
- Total profit
- $41,087
- Equity at exit
- $23,777
Cash invested: $77,000 (down + closing). Projections, not guarantees.
Landlord ↔ Tenant lean methodology
- Overall (STATE)
- 90 Strongly Landlord-Friendly
- State Louisiana
- 90 Strongly Landlord-Friendly · R+12
- County
- — inherits STATE
- City
- — inherits STATE
ZIP-level market 70663
- Rents YoY
- 7.7%
- Active inventory
- 291
- Price-to-rent
- 9.7×
Monthly cashflow live
- Estimated rent
- $2,359 high interval (Pro) →
- Mortgage (P&I)
- −$1,442
- Tax from tax record
- −$176 /mo · $2,116/yr
- Insurance
- −$115
- HOA
- −$0
- Vacancy / Maint / Mgmt
- −$495
- Net cashflow
- $131
Break-even live
UW: 25.0% down · 7.5% · 30yr · 1.5% tax · 5.0% vac · 8.0% maint · 8.0% mgmt
Financing live
Cash to close
- Down payment
- $68,750
- Closing costs
- $8,250
- Reserves months
- —
- Total cash needed
- —
Loan-product check · same deal, 3 products live
Conventional
25% down · 7.5% · 30yr
- Down + closing
- —
- Monthly P&I
- —
- Monthly cashflow
- —
- DSCR
- —
- Eligible?
- —
Personal DTI + credit; lowest rate.
DSCR
20% down · 8.5% · 30yr
- Down + closing
- —
- Monthly P&I
- —
- Monthly cashflow
- —
- DSCR
- —
- Eligible?
- —
No personal income docs; deal must DSCR.
Hard money
10% down · 12.0% · 12mo
- Down + closing
- —
- Monthly P&I
- —
- Monthly cashflow
- —
- DSCR
- —
- Eligible?
- —
Short-term bridge; refi at stabilization.
Rent comps 7 comps
| Address | Beds | Baths | Sqft | Rent | $/sqft | DOM | Units | Dist |
|---|---|---|---|---|---|---|---|---|
| 1016 Jacques Dr Sulphur, LA | 4.0 | 3.0 | 2350 | $3,000 | $1.28 | 43d | 1 | 0.19mi |
| 608 Shady Ln Sulphur, LA | 3.0 | 3.0 | 1903 | $2,200 | $1.16 | 43d | 1 | 0.51mi |
| 309 W Mimosa Dr Sulphur, LA | 3.0 | 2.0 | 1310 | $1,500 | $1.15 | 13d | 1 | 0.90mi |
| 103 Jackson Ave Sulphur, LA | 4.0 | 2.0 | 2114 | $4,500 | $2.13 | 43d | 1 | 1.02mi |
| 708 Alabama St Sulphur, LA | 4.0 | 2.5 | 2335 | $2,800 | $1.20 | 21d | 1 | 1.11mi |
| 2310 Timberlane Dr Sulphur, LA | 2.0 | 2.0 | 1350 | $2,450 | $1.81 | 43d | 1 | 1.20mi |
| 1917 Linda Ave Sulphur, LA | 3.0 | 2.0 | 1288 | $1,890 | $1.47 | 43d | 1 | 1.45mi |
Listing history 5 events
-
2026-05-09$275,000 Active 1880-char remark
-
2015-03-02soldstatus $211,500
-
2015-02-27soldstatus 309-char remark
Show marketing remark (309 chars)
This home is in mint, move-in condition. Very open floor plan located on a corner lot, landscaped, security system, fenced, covered patio perfect for entertaining, granite throughout and tumbled marble backsplash. Home owner will also supply a home warranty to buyer if buyer chooses one. All measurements M/L
-
2015-01-27$219,900 309-char remark
Show marketing remark (309 chars)
This home is in mint, move-in condition. Very open floor plan located on a corner lot, landscaped, security system, fenced, covered patio perfect for entertaining, granite throughout and tumbled marble backsplash. Home owner will also supply a home warranty to buyer if buyer chooses one. All measurements M/L
-
2012-06-01soldstatus $195,000
ⓘ Source: listings_history table (triggers on properties + properties_extension) + one-shot
backfill from property_details.listing_events for pre-trigger history.
Tax reassessment forecast LA · Resets to sale price
- Current annual tax
- $2,116 · $176/mo
- Projected year-2 tax
- $2,116 · $176/mo
- Expected delta
- $0/yr ($0/mo · 0.0%)
ⓘ Screening estimate from a state-policy table — verify with the county assessor before closing.
Climate risk First Street
- Flood 5/10 Major FEMA zone X (unshaded) · 66% chance over 30 yrs
- Wildfire 4/10 Moderate
- Heat 9/10 Extreme 7 d/yr ≥109°F today · 23 d/yr by 30 yrs out
- Wind 9/10 Extreme 99% chance of damaging wind over 30 yrs
- Air quality 2/10 Low 1 unhealthy d/yr today · 1 by 30 yrs out
Nearby sold comps map
Loading sold comps map…
Walkable amenities ~0.75 mi
Loading nearby amenities…
Taxation est. · year 1
- Rental income
- $28,309
- − Mortgage interest
- −$15,404
- − Property taxes
- −$2,116
- − Insurance
- −$1,375
- − Repairs & maintenance
- −$2,265
- − Management
- −$2,265
- − Depreciation
- −$8,000
- Taxable loss
- −$3,116
- Est. tax savings @ 24.0%
- +$748
- After-tax cash flow
- $2,315/yr
For passive investors: Depreciation is non-cash, so a rental often shows a tax loss while cash-flowing — sheltering income. Rental losses are passive: they offset passive income freely, and up to $25,000/yr can offset ordinary (W-2) income if you actively participate and your MAGI is under $100k (phasing out to $0 by $150k); unused losses carry forward. On sale, claimed depreciation is recaptured at up to 25%, and gains may owe capital-gains tax (a 1031 exchange can defer both). Figures are a year-1 estimate at your 24.0% rate — not tax advice; consult a CPA.
Schools (NCES district)
- District
- Calcasieu Parish
- NCES district ID
- 2200330
- Math proficiency
- 30% ▼ -39.00%
- Reading proficiency
- 44% ▼ -33.00%
- Median HH income
- $44,700
- Composite
- 31.45/100
- National rank
- #5979
- State rank
- #29 of 98 in LA
Livability — Sulphur
- Score
- 71/100
- State rank
- #48
- US rank
- #7164
Category grades
Schools grade is shown separately in the Schools card above.
Census & demographics
- Census place
- Sulphur, LA
- County
- Calcasieu Parish · 170,889 people
- City population
- 27,799
- Metro
- Lake Charles, LA
- Population (ZIP)
- 27,799
- Household income
- $64,707
- Rent vs Own
- Severe rent burden
- 197.0
Population outlook (Calcasieu County) Hauer SSP2
- Today (2025)
- 212,179 people
- By 2030
- 218,199 · +2.8%
- By 2040
- 228,486 · +7.7%
- By 2050
- 236,208 · +11.3%
- By 2075
- 251,696 · +18.6%
- By 2100
- 247,848 · +16.8%
Race, ethnicity, and origin ACS 2023
- Neighborhood character
- Predominantly White (82%)
- Race & ethnicity
- White 82% Black 8% Hispanic / Latino 5% Two or more races 4%
- Common ancestry
- Lithuanian 13% Slovak 2% Scandinavian 1%
- Foreign-born
- 3% · Canada, Vietnam
- Languages at home
- 94% English-only · Spanish 2% French/Haitian/Cajun 2% Other Indo-European 1%
Political lean MEDSL · Calcasieu
- 2024 margin
- Solid R (+39.6) · D 29.5% · R 69.0% · Other 1.5%
- 2008→2024 swing
- -15.0pp toward R · 2008: -24.6pp · 2024: -39.6pp
- All cycles
- 2024: R+39.6 2020: R+35.2 2016: R+33.3 2012: R+28.7 2008: R+24.6
Not yet ingested
- Civics
- —
Market trends
- HPI YoY
- ▼ -104.29%
- Current HPI
- 100.0895
- Rent YoY
- ▲ 7.65%
- Metro
- Lake Charles, LA
- State GDP YoY
- ▲ 3.29%
- F500 in state
- 10
Industry mix (Fortune 500 HQ in LA)
| Industry | F500 HQs | Revenue |
|---|---|---|
| Telecommunications | 2 | $23B |
|
||
| Utilities | 1 | $12B |
|
||
| Wholesale / Distribution | 1 | $5B |
|
||
| Advertising | 1 | $2B |
|
||
Price history
+41.0% since first listed7 events — show timeline
- 2026-06-05 Sold (MLS) — SWLAR
- 2026-05-20 Pending — SWLAR
- 2026-05-09 Listed $275,000 SWLAR
- 2015-03-02 Sold (Public Records) $211,500 Public Records
- 2015-02-27 Sold (MLS) — SWLAR
- 2015-01-27 Listed $219,900 SWLAR
- 2012-06-01 Sold (Public Records) $195,000 Public Records
Property tax history
-0.7%/yrLatest (2025): $2,116 · +0.8% YoY. Source: county tax records.
Cash-flow waterfall
monthlySold comps — $/sqft
last 12 mo · ≤1 miLoading sold comps…