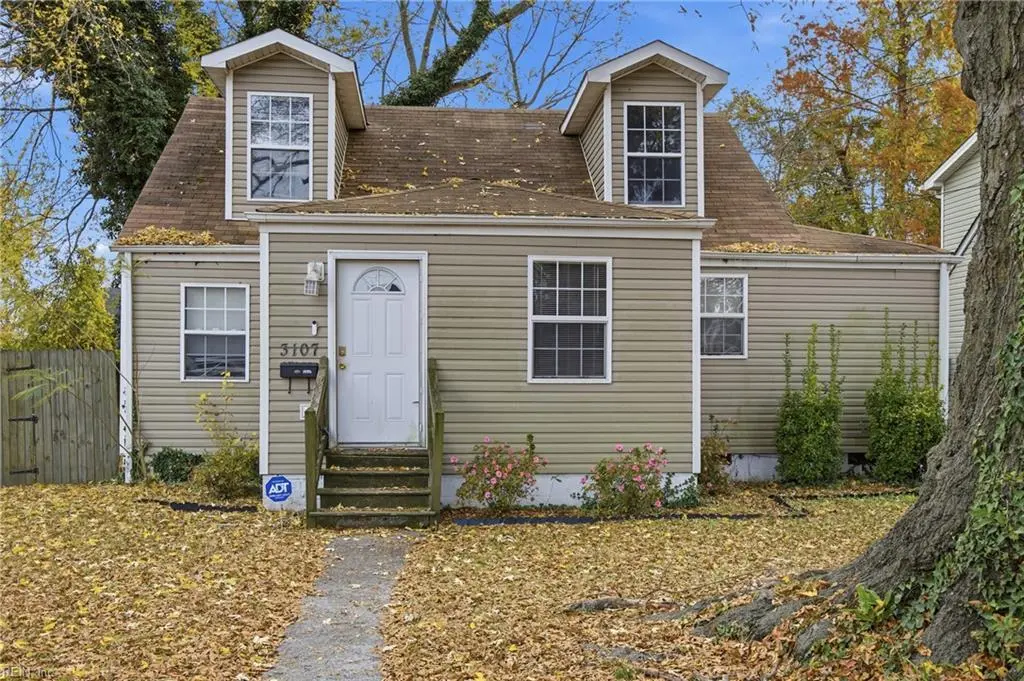
3107 Dartmouth St · Portsmouth, VA
Flood risk 4/10 · Minor
- FEMA flood zone
- X (unshaded)
- Chance of flooding over 30 yrs
- 0.13%
- Est. flood insurance / yr
- $507 – $1,088
Fire risk 1/10 · Minimal
- Est. fire insurance / yr
- $666 – $1,236
Heat risk 9/10 · Severe
- Hot days now (above 106°F)
- 7 days/yr
- Hot days in 30 yrs
- 16 days/yr
Wind risk 8/10 · Major
- Chance of severe wind over 30 yrs
- 80.0%
Air-quality risk 5/10 · Moderate
- Unhealthy air days now
- 6 days/yr
- Unhealthy air days in 30 yrs
- 7 days/yr
Risk factors via First Street. Map © Google.
Why this score? — see what drove the C- grade
The composite is a weighted blend of 9 inputs, each scored 0–100. Each bar is that input's sub-score; the figure is the points it added to the 100-point composite (weight × sub-score).
- Cash flow +16.3/30.0
- ARV discount +14.2/15.0
- DSCR +5.1/10.0
- 1% rule +4.2/10.0
- Schools +3.9/10.0
- Livability +3.7/5.0
- Rent growth +2.5/5.0
- Condition / age +2.5/5.0
- Appreciation +0.0/10.0
$229,000
🖨 Deal sheet (PDF) 📄 Offer letter ✓ Due diligence
Listing remarks MLS
Priced below comparable move-in-ready homes. This 4-bedroom, 2 full-bath home in Westhaven Park offers 1,520 sq ft with a large living room, sizable kitchen, and a generous fully fenced backyard. Convenient to your morning coffee, interstate access, and shopping. Quotes for repair work are in hand, and once completed, you’ll still be under market value; meaning built-in equity from day one. FHA and VA rehab loans encouraged. See photos for overall condition and schedule a showing to experience the layout in person. A great opportunity for buyers ready to move this winter.
Key facts
- Built 1941
- Listed 96 days
Neighborhood map
What this means for you Summary
Snapshot
- This is a 4-bed/2.0-bath single-family listed at $229k.
Deal economics
- At list price, monthly cash flow is $127 ($2k/yr) — positive.
- The deal already cash-flows at list — no discount required.
- To meet the 1% rule (rent ≥ 1% of price), the offer needs to be $210k (8.3% below list).
- Recommended offer: $208k (9.0% below list) — sets the bar for market timing.
- Cap rate 7.0% vs local median 4.6% in Portsmouth — top-decile yield for the area; either an underpriced asset or a hidden risk that comps aren't pricing in. Stress-test before assuming the spread holds.
Location & tenants
- Location reads 73/100 on livability (#172 in VA) — a middle-class / working-renter tenant base. Strengths: amenities A+, cost of living A+, housing A+; Watch: employment C-, crime F, commute F.
- Portsmouth City Public School District (urban): math 34% / reading 58% proficiency, ranked #107 of 131 in VA (top 82%) — families likely to look elsewhere, expect single-tenant / working-renter base with shorter leases.
- Zoned schools: Westhaven Elementary (math 22% / reading 52%, grade F, #933 of 1,108 statewide, top 86%, 442 students, 100% FRL); William E. Waters Middle (math 47% / reading 72%, grade B, #160 of 342 statewide, top 48%, 534 students, 99% FRL); Manor High (math 48% / reading 75%, grade B-, #240 of 319 statewide, top 75%, 1,236 students, 99% FRL) — zoned schools average 99% FRL vs 60% district-wide (39 pts higher); higher-poverty schools than district average — tighter screening recommended.
- Market conditions: 86 active listings in the ZIP; 31 comparable units currently listed for rent nearby; rentals at typical pace (median 26d on market — plan ~3-4 weeks tenant-placement turnaround); 300 units permitted in Portsmouth city in 2024 (112 in 5+ unit buildings).
- At $2,101/mo this rent would consume 52% of the median local household income ($49k/yr) (locally 963% of renters already pay >50% of income on rent) — very limited rent-growth headroom before tenants either downsize or default.
Forward outlook
- Local home prices are declining (-3.0%/yr); year-one equity from $2k of loan paydown is wiped out by about $7k of value loss. Plan a longer hold.
Negotiation context
- It's been on market 96 days — a 9% lower offer ($208k) is reasonable based on typical stale-listing flexibility.
- 4 sale attempts since 7y ago with the ask held roughly flat each time — persistent listings suggest the price (not the market) is what's stuck; bring a comps-based counter.
Risks & watch-outs
- Watch-outs: built in 1941 — expect roof / HVAC / electrical / plumbing capex.
- Climate carrying-cost: severe wind risk, 80% chance of damaging wind over 30y; extreme-heat days projected 7→16/yr by 2055 (HVAC capex compounding) — expect insurance premiums to compound above CPI over the hold.
Questions for the listing agent
- It's been on market 96 days. Have you received any prior offers? Is the seller open to a 9% concession, seller financing, or rate buy-down credit?
- Built in 1941 — when were the roof, HVAC, electrical panel, plumbing, and water heater last replaced?
- Why hasn't it sold? Are there any deal-killer items the seller is aware of (foundation, flood, title, zoning, code violations)?
- Is there a deadline driving the sale (1031 exchange, divorce, estate, relocation)? That informs how much negotiation room exists.
- Schools are B-rated — typically a magnet for longer-tenancy family renters. What's the average tenant stay here, and is there a school-zone premium baked into asking?
- Crime grade is F in this area — have there been break-ins, vandalism, or insurance claims at this property in the last 3 years? What carrier currently insures it and at what premium?
- What's the average days-on-market for RENTAL listings here right now (not sales)? A rising rental-DOM trend means longer vacancies and softer asking-rent achievability than the comps imply.
- What's the recent tenant-quality profile in this submarket — average credit score on applications, eviction rate, late-payment / NSF rate, and stable-employment percentage? A property-management company in the area should have these aggregated.
- How much new for-sale + rental construction is in the pipeline within 1–3 miles? Heavy new supply typically softens prices + rents 12–24 months out; constrained supply supports both.
Investment metrics
- 1% rule
- 0.92% ✗
- Cap rate
- 6.96%
- Cash-on-cash
- 2.37%
- DSCR
- 1.11
- GRM
- 9.1
CMA / ARV
- ARV (median comp)
- $269,346
- List price
- $229,000
- Delta
- -14.98%
- Verdict
- UNDERPRICED
- Comps
- 20 within 1.0 mi
Show comp detail 12 sales within ~0.75 mi
| Address | Dist | Beds/Ba | Sqft | Sold | Price | $/sf | Match |
|---|---|---|---|---|---|---|---|
| 3203 Dartmouth St | 0.05mi | 4/2.0 | 1,418 (-7%) | 3mo | $270,000 | $190 | 84 |
| 289 Choate St | 0.34mi | 4/2.0 | 1,500 (-1%) | 1mo | $303,000 | $202 | 81 |
| 3209 Arlington Pl | 0.13mi | 4/2.0 | 1,400 (-8%) | 1mo | $291,000 | $208 | 80 |
| 3403 Commonwealth Ave | 0.35mi | 4/2.0 | 1,361 (-10%) | 3mo | $301,496 | $222 | 63 |
| 3410 Arlington Pl | 0.25mi | 3/1.0 (-1) | 1,368 (-10%) | 2mo | $234,900 | $172 | 61 |
| 3409 Astor Ave | 0.66mi | 4/2.0 | 1,440 (-5%) | 2mo | $235,000 | $163 | 59 |
| 600 Phillips Ave | 0.51mi | 3/2.0 (-1) | 1,644 (+8%) | 1mo | $270,500 | $165 | 57 |
| 4013 Greenway Ct W | 0.73mi | 3/1.0 (-1) | 1,533 (+1%) | 2mo | $275,000 | $179 | 54 |
| 1370 Wool Ave | 0.51mi | 3/2.5 (-1) | 1,659 (+9%) | 2mo | $305,000 | $184 | 52 |
| 4021 Dartmouth St | 0.71mi | 3/2.0 (-1) | 1,600 (+5%) | 3mo | $320,000 | $200 | 51 |
| 4020 Greenway Ct W | 0.74mi | 3/1.5 (-1) | 1,437 (-6%) | 1mo | $285,000 | $198 | 49 |
| 2711 Magnolia St | 0.55mi | 4/3.0 | 1,739 (+14%) | 4mo | $315,000 | $181 | 44 |
Match score weights: distance 35% · size 25% · config 20% · recency 20%. Top-matched comps best support the ARV.
Projected returns pro-forma
-3.0% appreciation · 3.0% rent growth · sell at horizon
- IRR
- -12.5%
- Equity multiple
- 0.55×
- Total profit
- $-29,036
- Equity at exit
- $34,145
- IRR
- -3.5%
- Equity multiple
- 0.77×
- Total profit
- $-14,888
- Equity at exit
- $19,800
Cash invested: $64,120 (down + closing). Projections, not guarantees.
Landlord ↔ Tenant lean methodology
- Overall (STATE)
- 55 Moderately Landlord-Leaning
- State Virginia
- 55 Moderately Landlord-Leaning · D+2
- County
- — inherits STATE
- City
- — inherits STATE
ZIP-level market 23707
- Home prices YoY
- -23.7%
- Active inventory
- 86
- Price-to-rent
- 9.1×
Monthly cashflow live
- Estimated rent
- $2,101 high interval (Pro) →
- Mortgage (P&I)
- −$1,201
- Tax from tax record
- −$236 /mo · $2,837/yr
- Insurance
- −$95
- HOA
- −$0
- Vacancy / Maint / Mgmt
- −$441
- Net cashflow
- $127
Break-even live
Sensitivity live
| Price | -10% $256 | -5% $192 | +0% $127 | +5% $62 | +10% $-3 |
|---|---|---|---|---|---|
| Rent | -10% $-39 | -5% $44 | +0% $127 | +5% $210 | +10% $293 |
| Rate | -1.0pp $242 | -0.5pp $185 | base $127 | +0.5pp $67 | +1.0pp $7 |
UW: 25.0% down · 7.5% · 30yr · 1.5% tax · 5.0% vac · 8.0% maint · 8.0% mgmt
Financing live
Cash to close
- Down payment
- $57,250
- Closing costs
- $6,870
- Reserves months
- —
- Total cash needed
- —
Loan-product check · same deal, 3 products live
Conventional
25% down · 7.5% · 30yr
- Down + closing
- —
- Monthly P&I
- —
- Monthly cashflow
- —
- DSCR
- —
- Eligible?
- —
Personal DTI + credit; lowest rate.
DSCR
20% down · 8.5% · 30yr
- Down + closing
- —
- Monthly P&I
- —
- Monthly cashflow
- —
- DSCR
- —
- Eligible?
- —
No personal income docs; deal must DSCR.
Hard money
10% down · 12.0% · 12mo
- Down + closing
- —
- Monthly P&I
- —
- Monthly cashflow
- —
- DSCR
- —
- Eligible?
- —
Short-term bridge; refi at stabilization.
Rent comps 31 comps
| Address | Beds | Baths | Sqft | Rent | $/sqft | DOM | Units | Dist |
|---|---|---|---|---|---|---|---|---|
| 3401 Brighton St Portsmouth, VA | 3.0 | 2.5 | 1439 | $2,195 | $1.53 | 5d | 1 | 0.19mi |
| 3607 Bart St Portsmouth, VA | 3.0 | 2.0 | 1326 | $1,850 | $1.40 | 12d | 1 | 0.43mi |
| 3717 Scott St Portsmouth, VA | 3.0 | 1.0 | 1157 | $1,400 | $1.21 | 26d | 1 | 0.46mi |
| 22 Radford St Portsmouth, VA | 4.0 | 3.0 | 1651 | $2,550 | $1.54 | 5d | 1 | 0.64mi |
| 3317 Downes St Portsmouth, VA | 3.0 | 2.0 | 1148 | $1,995 | $1.74 | 12d | 1 | 0.74mi |
| 3317 Downes St Portsmouth, VA | 3.0 | 2.0 | 1148 | $1,995 | $1.74 | 5d | 1 | 0.74mi |
| 4205 Dartmouth St Portsmouth, VA | 4.0 | 3.5 | 2100 | $2,400 | $1.14 | 19d | 1 | 0.83mi |
| 300 Russell St Portsmouth, VA | 3.0 | 1.5 | 1534 | $2,250 | $1.47 | 26d | 1 | 0.89mi |
| 2304 Nashville Ave Portsmouth, VA | 3.0 | 1.5 | 1226 | $1,395 | $1.14 | 46d | 1 | 0.97mi |
| 213 Beacon Rd Portsmouth, VA | 3.0 | 2.0 | 1280 | $2,300 | $1.80 | 26d | 1 | 1.05mi |
| 1914 King St Portsmouth, VA | 3.0 | 2.5 | 1332 | $2,200 | $1.65 | 46d | 1 | 1.05mi |
| 2211 North St Portsmouth, VA | 4.0 | 1.5 | 1500 | $2,100 | $1.40 | 18d | 1 | 1.07mi |
| 2810 Roanoke Ave Portsmouth, VA | 3.0 | 1.5 | 1100 | $2,100 | $1.91 | 46d | 1 | 1.18mi |
| 3509 Floyd St Portsmouth, VA | 4.0 | 2.5 | 1670 | $2,400 | $1.44 | 4d | 1 | 1.20mi |
| 1915 Des Moines Ave Portsmouth, VA | 3.0 | 1.0 | 1070 | $1,700 | $1.59 | 18d | 1 | 1.21mi |
| 1915 Des Moines Ave Portsmouth, VA | 3.0 | 1.0 | 1070 | $1,700 | $1.59 | 26d | 1 | 1.21mi |
| 3817 High St Portsmouth, VA | 3.0 | 2.0 | 1999 | $2,300 | $1.15 | 12d | 1 | 1.22mi |
| 1915 Lansing Ave Portsmouth, VA | 3.0 | 1.0 | 1085 | $1,675 | $1.54 | 5d | 1 | 1.26mi |
| 1508 Richmond Ave Portsmouth, VA | 4.0 | 2.0 | 1600 | $2,000 | $1.25 | 5d | 1 | 1.31mi |
| 1447 Talley Cir Portsmouth, VA | 3.0 | 2.5 | 1440 | $2,000 | $1.39 | 26d | 1 | 1.32mi |
| 251 Independence St Portsmouth, VA | 3.0 | 2.5 | 1294 | $2,550 | $1.97 | 26d | 1 | 1.32mi |
| 509 Mount Vernon Ave Portsmouth, VA | 3.0 | 1.5 | 1125 | $1,250 | $1.11 | 23d | 1 | 1.34mi |
| 507 Broad St Unit 507 Portsmouth, VA | 3.0 | 1.5 | 1700 | $1,350 | $0.79 | 46d | 1 | 1.36mi |
| 207 Falcon Ave Portsmouth, VA | 3.0 | 2.5 | 1720 | $3,000 | $1.74 | 46d | 1 | 1.40mi |
| 430 Mt Vernon Ave Portsmouth, VA | 3.0 | 2.0 | 2179 | $2,100 | $0.96 | 46d | 1 | 1.41mi |
| 2750 Greenwood Dr Portsmouth, VA | 3.0 | 2.0 | 1200 | $1,700 | $1.42 | 26d | 1 | 1.44mi |
| 1321 Columbia St Unit 1533640P Portsmouth, VA | 3.0 | 2.5 | 1582 | $5,609 | $3.55 | 9d | 1 | 1.45mi |
| 112 Idlewood Ave Portsmouth, VA | 3.0 | 2.0 | 1508 | $2,200 | $1.46 | 46d | 1 | 1.46mi |
| 416 Maryland Ave Unit A Portsmouth, VA | 3.0 | 2.0 | 1450 | $2,300 | $1.59 | 46d | 1 | 1.47mi |
| 2111 Atlanta Ave Portsmouth, VA | 3.0 | 2.0 | 1418 | $2,395 | $1.69 | 46d | 1 | 1.48mi |
| 2215 Atlanta Ave Portsmouth, VA | 4.0 | 1.0 | 1628 | $2,150 | $1.32 | 9d | 1 | 1.49mi |
Listing history 29 events
-
2026-06-21days on market $229,000 Active 96 DOM
-
2026-06-18days on market $229,000 Active 93 DOM
-
2026-06-17days on market $229,000 Active 92 DOM
-
2026-06-16days on market $229,000 Active 91 DOM
-
2026-06-15days on market $229,000 Active 90 DOM
-
2026-06-13days on market $229,000 Active 88 DOM
-
2026-06-09days on market $229,000 Active 84 DOM
-
2026-06-08days on market $229,000 Active 83 DOM
-
2026-06-07days on market $229,000 Active 82 DOM
-
2026-06-03days on market $229,000 Active 78 DOM
-
2026-06-02days on market $229,000 Active 77 DOM
-
2026-06-01days on market $229,000 Active 76 DOM
-
2026-05-31days on market $229,000 Active 75 DOM
-
2026-05-12price $229,000 585-char remark
Show marketing remark (585 chars)
Priced below comparable move-in-ready homes. This 4-bedroom, 2 full-bath home in Westhaven Park offers 1,520 sq ft with a large living room, sizable kitchen, and a generous fully fenced backyard. Convenient to your morning coffee, interstate access, and shopping. Quotes for repair work are in hand, and once completed, you’ll still be under market value; meaning built-in equity from day one. FHA and VA rehab loans encouraged. See photos for overall condition and schedule a showing to experience the layout in person. A great opportunity for buyers ready to move this winter.
-
2026-05-05price $220,000 585-char remark
Show marketing remark (585 chars)
Priced below comparable move-in-ready homes. This 4-bedroom, 2 full-bath home in Westhaven Park offers 1,520 sq ft with a large living room, sizable kitchen, and a generous fully fenced backyard. Convenient to your morning coffee, interstate access, and shopping. Quotes for repair work are in hand, and once completed, you’ll still be under market value; meaning built-in equity from day one. FHA and VA rehab loans encouraged. See photos for overall condition and schedule a showing to experience the layout in person. A great opportunity for buyers ready to move this winter.
-
2026-03-17$229,000 Active 585-char remark
Show marketing remark (585 chars)
Priced below comparable move-in-ready homes. This 4-bedroom, 2 full-bath home in Westhaven Park offers 1,520 sq ft with a large living room, sizable kitchen, and a generous fully fenced backyard. Convenient to your morning coffee, interstate access, and shopping. Quotes for repair work are in hand, and once completed, you’ll still be under market value; meaning built-in equity from day one. FHA and VA rehab loans encouraged. See photos for overall condition and schedule a showing to experience the layout in person. A great opportunity for buyers ready to move this winter.
-
2026-03-17historical
Show marketing remark (585 chars)
Priced below comparable move-in-ready homes. This 4-bedroom, 2 full-bath home in Westhaven Park offers 1,520 sq ft with a large living room, sizable kitchen, and a generous fully fenced backyard. Convenient to your morning coffee, interstate access, and shopping. Quotes for repair work are in hand, and once completed, you’ll still be under market value; meaning built-in equity from day one. FHA and VA rehab loans encouraged. See photos for overall condition and schedule a showing to experience the layout in person. A great opportunity for buyers ready to move this winter.
-
2026-02-05price $235,000
-
2026-01-19price $249,900
-
2025-12-10price $257,000
-
2025-11-26$265,000 Active
-
2021-05-24soldstatus $200,000
-
2021-04-29status Under Contract
-
2021-04-19historical Active Under Contract
-
2021-04-17$175,000 Active
-
2019-11-22historical
-
2019-10-15price $149,900
-
2019-08-26price $155,888
-
2019-07-25$168,000 Active
ⓘ Source: listings_history table (triggers on properties + properties_extension) + one-shot
backfill from property_details.listing_events for pre-trigger history.
Tax reassessment forecast VA · Resets to sale price
- Current annual tax
- $2,837 · $236/mo
- Projected year-2 tax
- $2,837 · $236/mo
- Expected delta
- $0/yr ($0/mo · 0.0%)
ⓘ Screening estimate from a state-policy table — verify with the county assessor before closing.
Climate risk First Street
- Flood 4/10 Moderate FEMA zone X (unshaded) · 13% chance over 30 yrs
- Wildfire 1/10 Low
- Heat 9/10 Extreme 7 d/yr ≥106°F today · 16 d/yr by 30 yrs out
- Wind 8/10 Severe 80% chance of damaging wind over 30 yrs
- Air quality 5/10 Major 6 unhealthy d/yr today · 7 by 30 yrs out
Nearby sold comps map
Loading sold comps map…
Walkable amenities ~0.75 mi
Loading nearby amenities…
Taxation est. · year 1
- Rental income
- $25,207
- − Mortgage interest
- −$12,828
- − Property taxes
- −$2,837
- − Insurance
- −$1,145
- − Repairs & maintenance
- −$2,017
- − Management
- −$2,017
- − Depreciation
- −$6,662
- Taxable loss
- −$2,298
- Est. tax savings @ 24.0%
- +$551
- After-tax cash flow
- $2,072/yr
For passive investors: Depreciation is non-cash, so a rental often shows a tax loss while cash-flowing — sheltering income. Rental losses are passive: they offset passive income freely, and up to $25,000/yr can offset ordinary (W-2) income if you actively participate and your MAGI is under $100k (phasing out to $0 by $150k); unused losses carry forward. On sale, claimed depreciation is recaptured at up to 25%, and gains may owe capital-gains tax (a 1031 exchange can defer both). Figures are a year-1 estimate at your 24.0% rate — not tax advice; consult a CPA.
Schools (NCES district)
- District
- Portsmouth City Public School District
- NCES district ID
- 5103000
- Math proficiency
- 34% ▼ -40.00%
- Reading proficiency
- 58% ▼ -12.00%
- Median HH income
- $46,152
- Composite
- 39.01/100
- National rank
- #4071
- State rank
- #107 of 131 in VA
Livability — Portsmouth
- Score
- 73/100
- State rank
- #172
- US rank
- #5381
Category grades
Schools grade is shown separately in the Schools card above.
Census & demographics
- Census place
- Portsmouth, VA
- County
- Portsmouth City · 96,366 people
- City population
- 96,366
- Metro
- Virginia Beach-Norfolk-Newport News, VA-NC
- Population (ZIP)
- 14,766
- Household income
- $48,926
- Rent vs Own
- Severe rent burden
- 963.0
Population outlook (Portsmouth County) Hauer SSP2
- Today (2025)
- 96,730 people
- By 2030
- 96,760 · +0.0%
- By 2040
- 96,573 · -0.2%
- By 2050
- 95,606 · -1.2%
- By 2075
- 93,579 · -3.3%
- By 2100
- 83,756 · -13.4%
Race, ethnicity, and origin ACS 2023
- Neighborhood character
- Diverse neighborhood (Simpson 0.64)
- Race & ethnicity
- White 43% Black 41% Two or more races 9% Hispanic / Latino 3% Asian 3%
- Common ancestry
- Slovak 2% Italian 1% Serbian 1%
- Foreign-born
- 5% · Canada, China
- Languages at home
- 94% English-only · Spanish 2% Tagalog/Filipino 1% Chinese 1%
Political lean MEDSL · Portsmouth
- 2024 margin
- Solid D (+38.6) · D 68.6% · R 30.0% · Other 1.4%
- 2008→2024 swing
- -0.7pp no change · 2008: 39.3pp · 2024: 38.6pp
- All cycles
- 2024: D+38.6 2020: D+40.8 2016: D+36.5 2012: D+39.6 2008: D+39.3
Not yet ingested
- Civics
- —
Market trends
- HPI YoY
- ▼ -93.03%
- Current HPI
- 299.832
- Rent YoY
- —
- Metro
- Virginia Beach-Norfolk-Newport News, VA-NC
- State GDP YoY
- ▲ 2.40%
- F500 in state
- 50
Industry mix (Fortune 500 HQ in VA)
| Industry | F500 HQs | Revenue |
|---|---|---|
| Aerospace / Defense | 4 | $236B |
|
||
| Technology / Defense | 3 | $32B |
|
||
| Financial Services | 2 | $176B |
|
||
| Utilities | 2 | $27B |
|
||
| Insurance | 2 | $25B |
|
||
| Technology | 2 | $15B |
|
||
Price history
+36.3% since first listed16 events — show timeline
- 2026-05-12 Price Changed $229,000 REINMLS
- 2026-05-05 Price Changed $220,000 REINMLS
- 2026-03-17 Listing Removed — REINMLS
- 2026-03-17 Listed $229,000 REINMLS
- 2026-02-05 Price Changed $235,000 REINMLS
- 2026-01-19 Price Changed $249,900 REINMLS
- 2025-12-10 Price Changed $257,000 REINMLS
- 2025-11-26 Listed $265,000 REINMLS
- 2021-05-24 Sold (Public Records) $200,000 Public Records
- 2021-04-29 Pending — REINMLS
- 2021-04-19 Contingent — REINMLS
- 2021-04-17 Listed $175,000 REINMLS
- 2019-11-22 Listing Removed — REINMLS
- 2019-10-15 Price Changed $149,900 REINMLS
- 2019-08-26 Price Changed $155,888 REINMLS
- 2019-07-25 Listed $168,000 REINMLS
Property tax history
+3.8%/yrLatest (2025): $2,837 · +2.3% YoY. Source: county tax records.
Cash-flow waterfall
monthlySold comps — $/sqft
last 12 mo · ≤1 miLoading sold comps…