 Duplex
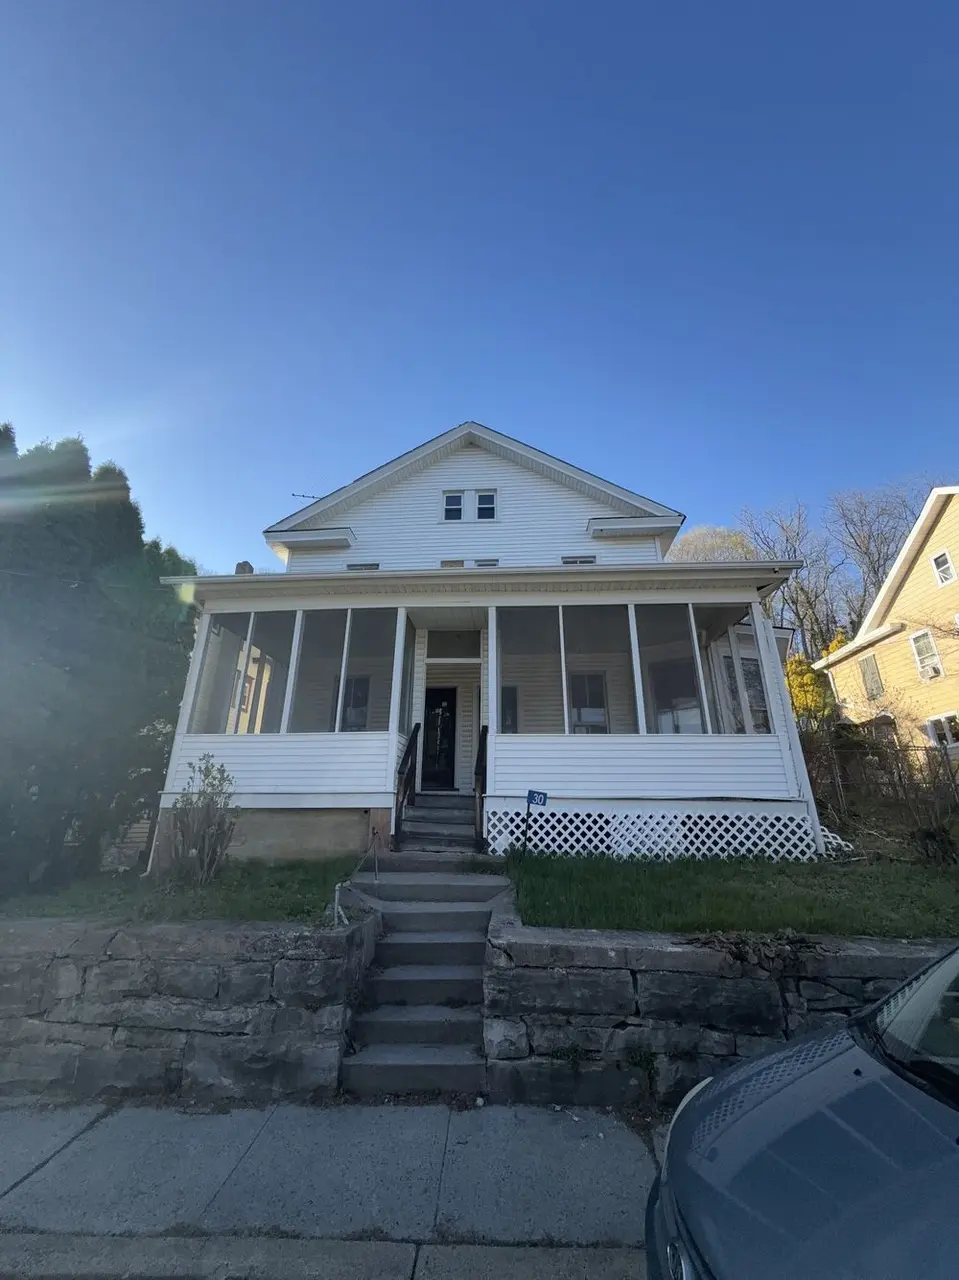
30 High St · Blairstown, NJ
Flood risk 1/10 · Minimal
- FEMA flood zone
- X (unshaded)
- Chance of flooding over 30 yrs
- 0.0%
- Est. flood insurance / yr
- $507 – $1,088
Fire risk 3/10 · Minor
- Est. fire insurance / yr
- $526 – $976
Heat risk 5/10 · Moderate
- Hot days now (above 99°F)
- 7 days/yr
- Hot days in 30 yrs
- 16 days/yr
Wind risk 4/10 · Minor
- Chance of severe wind over 30 yrs
- 13.0%
Air-quality risk 2/10 · Minimal
- Unhealthy air days now
- 1 days/yr
- Unhealthy air days in 30 yrs
- 2 days/yr
Risk factors via First Street. Map © Google.
Why this score? — see what drove the B- grade
The composite is a weighted blend of 9 inputs, each scored 0–100. Each bar is that input's sub-score; the figure is the points it added to the 100-point composite (weight × sub-score).
- Cash flow +30.0/30.0
- 1% rule +10.0/10.0
- DSCR +10.0/10.0
- ARV discount +7.5/15.0
- Schools +4.0/10.0
- Livability +3.0/5.0
- Rent growth +2.5/5.0
- Condition / age +2.2/5.0
- Appreciation +0.0/10.0
$299,999
🖨 Deal sheet (PDF) 📄 Offer letter ✓ Due diligence
Multi-family units
County records classify this as Multi-Family (2-4 Unit). Listing-text estimate: 2 units. confirmed
Listing remarks
Charming Historic Duplex in the Heart of Blairstown 30 High Street, Blairstown, NJ 07825 Step into timeless appeal with this classic 1890-built multi-family home (duplex) offering approximately 2,565 square feet of living space on a generous 0.3-acre lot. Featuring 4 bedrooms and 2 bathrooms total (2 bedrooms and 1 full bath per unit), this property is perfect for owner-occupants seeking income potential, multi-generational living, or investors looking for a solid rental opportunity in a desirable location. Each unit boasts its own living room, kitchen, bedrooms, and bath, providing comfortable, independent living spaces. Highlights include a shared enclosed porch for welcoming entryways,
Key facts
- Outbuilding
- Storage shed
- Vinyl siding
Tags
Property features AI
Exterior
- Home design: Multi-family property
- Construction: Approximately 2,564 total living area
- Exterior features: Lot of approximately 13,068 sq ft
Neighborhood map
What this means for you Summary
Snapshot
- This is a 2 × 2-bed/1.0-bath units multifamily listed at $300k. Condition is rated fair.
Deal economics
- At list price, monthly cash flow is $2k ($23k/yr) — positive. Per door: $939/mo.
- The deal already cash-flows at list — no discount required.
- Meets the 1% rule at list price ($5k rent vs $300k).
- Recommended offer: $295k (1.5% below list) — sets the bar for market timing.
Location & tenants
- Location reads 59/100 on livability (#490 in NJ) — a working-class tenant base; expect higher turnover. Strengths: health & safety A+, crime A; Watch: schools C-, cost of living C-, amenities D.
- North Warren Regional School District (rural): math 28% / reading 56% proficiency, ranked #193 of 472 in NJ (top 41%) — families likely to look elsewhere, expect single-tenant / working-renter base with shorter leases; only 6% free/reduced lunch — higher-income household profile.
- Market conditions: 18 active listings in the ZIP; solid renter incomes; 630 units permitted in Warren County in 2024 (315 in 5+ unit buildings).
- At $5,002/mo this rent would consume 57% of the median local household income ($106k/yr) (locally 1114% of renters already pay >50% of income on rent) — very limited rent-growth headroom before tenants either downsize or default.
Forward outlook
- Local home prices are declining (-3.0%/yr); year-one equity from $2k of loan paydown is wiped out by about $9k of value loss. Plan a longer hold.
- Warren County population projected at -10% by 2050 — secular population decline; favor cash flow + early exit over multi-decade hold.
- At projected returns (-3.0% appreciation + 3.0% rent growth), your $84k cash investment doubles in ~5 years — after that, you're playing with house money.
Negotiation context
- It's been on market 17 days — a 2% lower offer ($295k) is reasonable based on typical stale-listing flexibility.
Risks & watch-outs
- Watch-outs: built in 1890 — expect roof / HVAC / electrical / plumbing capex.
- Climate carrying-cost: extreme-heat days projected 7→16/yr by 2055 (HVAC capex compounding) — expect insurance premiums to compound above CPI over the hold.
Questions for the listing agent
- Can we see the unit-by-unit rent roll, current vacancy, and any below-market leases? What's the average tenancy length?
- What capital expenditures (roof, boiler, parking lot, exteriors) have been made in the last 5 years, and what's planned in the next 2?
- Have any recent inspections been done? Can we get a copy of the seller's disclosures and any deferred-maintenance estimates?
- Built in 1890 — when were the roof, HVAC, electrical panel, plumbing, and water heater last replaced?
- Is there a deadline driving the sale (1031 exchange, divorce, estate, relocation)? That informs how much negotiation room exists.
- What's the average days-on-market for RENTAL listings here right now (not sales)? A rising rental-DOM trend means longer vacancies and softer asking-rent achievability than the comps imply.
- What's the recent tenant-quality profile in this submarket — average credit score on applications, eviction rate, late-payment / NSF rate, and stable-employment percentage? A property-management company in the area should have these aggregated.
- How much new apartment / multifamily construction is in the pipeline within 1–3 miles? Heavy new supply (>2% of stock underway) typically softens rents 12–24 months out; light construction supports rent growth.
Investment metrics
- 1% rule
- 1.67% ✓
- Cap rate
- 13.81%
- Cash-on-cash
- 26.83%
- DSCR
- 2.19
- GRM
- 5.0
CMA / ARV
No comps found within radius.
Projected returns pro-forma
-3.0% appreciation · 3.0% rent growth · sell at horizon
- IRR
- 20.7%
- Equity multiple
- 1.85×
- Total profit
- $71,096
- Equity at exit
- $44,731
- IRR
- 28.9%
- Equity multiple
- 3.57×
- Total profit
- $216,263
- Equity at exit
- $25,938
Cash invested: $84,000 (down + closing). Projections, not guarantees.
Landlord ↔ Tenant lean methodology
- Overall (STATE)
- 21 Tenant-Leaning
- State New Jersey
- 21 Tenant-Leaning · D+6
- County
- — inherits STATE
- City
- — inherits STATE
ZIP-level market 07840
- Active inventory
- 18
- Price-to-rent
- 10.0×
Monthly cashflow live
- Estimated rent
- $5,002 medium interval (Pro) →
- Mortgage (P&I)
- −$1,573
- Tax est. 1.5%
- −$375 /mo · $4,500/yr
- Insurance
- −$125
- HOA
- −$0
- Vacancy / Maint / Mgmt
- −$1,050
- Net cashflow
- $1,878
Break-even live
Sensitivity live
| Price | -10% $2,086 | -5% $1,982 | +0% $1,878 | +5% $1,775 | +10% $1,671 |
|---|---|---|---|---|---|
| Rent | -10% $1,483 | -5% $1,681 | +0% $1,878 | +5% $2,076 | +10% $2,274 |
| Rate | -1.0pp $2,029 | -0.5pp $1,955 | base $1,878 | +0.5pp $1,801 | +1.0pp $1,722 |
2-unit breakdown (identical units grouped — click to expand)
| Units | Beds | Baths | Est. rent |
|---|---|---|---|
| 2× units | 2 | 1 | $5,002 |
| #1 | 2 | 1 | $2,501 |
| #2 | 2 | 1 | $2,501 |
| Total (2 units) | $5,002 | ||
UW: 25.0% down · 7.5% · 30yr · 1.5% tax · 5.0% vac · 8.0% maint · 8.0% mgmt
Financing live
Cash to close
- Down payment
- $75,000
- Closing costs
- $9,000
- Reserves months
- —
- Total cash needed
- —
Loan-product check · same deal, 3 products live
Conventional
25% down · 7.5% · 30yr
- Down + closing
- —
- Monthly P&I
- —
- Monthly cashflow
- —
- DSCR
- —
- Eligible?
- —
Personal DTI + credit; lowest rate.
DSCR
20% down · 8.5% · 30yr
- Down + closing
- —
- Monthly P&I
- —
- Monthly cashflow
- —
- DSCR
- —
- Eligible?
- —
No personal income docs; deal must DSCR.
Hard money
10% down · 12.0% · 12mo
- Down + closing
- —
- Monthly P&I
- —
- Monthly cashflow
- —
- DSCR
- —
- Eligible?
- —
Short-term bridge; refi at stabilization.
Listing history 14 events
-
2026-06-21days on market $299,999 Active 17 DOM
-
2026-06-19days on market $299,999 Active 15 DOM
-
2026-06-18days on market $299,999 Active 14 DOM
-
2026-06-17days on market $299,999 Active 13 DOM
-
2026-06-16days on market $299,999 Active 12 DOM
-
2026-06-15days on market $299,999 Active 11 DOM
-
2026-06-14days on market $299,999 Active 9 DOM
-
2026-06-13days on market $299,999 Active 8 DOM
-
2026-06-10days on market $299,999 Active 6 DOM
-
2026-06-09days on market $299,999 Active 5 DOM
-
2026-06-08days on market $299,999 Active 4 DOM
-
2026-06-07days on market $299,999 Active 3 DOM
-
2026-06-05remarks 699-char remark
-
2026-06-05$299,999 Active 1 DOM
ⓘ Source: listings_history table (triggers on properties + properties_extension) + one-shot
backfill from property_details.listing_events for pre-trigger history.
Climate risk First Street
- Flood 1/10 Low FEMA zone X (unshaded) · 0% chance over 30 yrs
- Wildfire 3/10 Moderate
- Heat 5/10 Major 7 d/yr ≥99°F today · 16 d/yr by 30 yrs out
- Wind 4/10 Moderate 13% chance of damaging wind over 30 yrs
- Air quality 2/10 Low 1 unhealthy d/yr today · 2 by 30 yrs out
Nearby sold comps map
Loading sold comps map…
Walkable amenities ~0.75 mi
Loading nearby amenities…
Taxation est. · year 1
- Rental income
- $60,024
- − Mortgage interest
- −$16,805
- − Property taxes
- −$4,500
- − Insurance
- −$1,500
- − Repairs & maintenance
- −$4,802
- − Management
- −$4,802
- − Depreciation
- −$8,727
- Taxable income
- $18,888
- Est. tax owed @ 24.0%
- −$4,533
- After-tax cash flow
- $18,007/yr
For passive investors: Depreciation is non-cash, so a rental often shows a tax loss while cash-flowing — sheltering income. Rental losses are passive: they offset passive income freely, and up to $25,000/yr can offset ordinary (W-2) income if you actively participate and your MAGI is under $100k (phasing out to $0 by $150k); unused losses carry forward. On sale, claimed depreciation is recaptured at up to 25%, and gains may owe capital-gains tax (a 1031 exchange can defer both). Figures are a year-1 estimate at your 24.0% rate — not tax advice; consult a CPA.
Condition & rehab AI · 7 photos
This historic duplex requires moderate renovations, including exterior painting, landscaping, and deep cleaning of the bathroom. These updates will significantly improve its resale and rental value.
Repairs flagged
- Major Bathroom cleaning and repairs — Dirty and cluttered, likely needs cleaning and possibly repairs.
- Major Exterior painting — Siding appears weathered, paint chipping.
- Major Landscaping and trimming — Overgrown and in need of trimming and maintenance.
Value-add opportunities
- Both Painting the exterior — Fresh paint can significantly improve curb appeal and property value.
- Both Landscaping and trimming — A well-maintained yard can enhance the property's overall appearance and attract potential buyers/tenants.
- Both Deep cleaning and repairs in the bathroom — A clean and well-maintained bathroom is crucial for both resale and rental value, as it impacts the overall impression of the property.
Renovation cost estimate screening
| Repair item | Severity | Est. cost |
|---|---|---|
| Bathroom cleaning and repairs · Dirty and cluttered, likely needs cleaning and possibly repairs. | Major | $15,000–50,000 |
| Exterior painting · Siding appears weathered, paint chipping. | Major | $15,000–50,000 |
| Landscaping and trimming · Overgrown and in need of trimming and maintenance. | Major | $15,000–50,000 |
| Total estimated repair cost · 3 items | $45,000–150,000 |
Value-add ROI direction
- Both Painting the exterior — Fresh paint can significantly improve curb appeal and property value. ↑
- Both Landscaping and trimming — A well-maintained yard can enhance the property's overall appearance and attract potential buyers/tenants. ↑
- Both Deep cleaning and repairs in the bathroom — A clean and well-maintained bathroom is crucial for both resale and rental value, as it impacts the overall impression of the property. ↑
ⓘ Cost ranges are severity-bucket heuristics (US national rule-of-thumb). Get contractor quotes + a written scope before underwriting a rehab budget.
Schools (NCES district)
- District
- North Warren Regional School District
- NCES district ID
- 3409550
- Math proficiency
- 28% ▼ -13.00%
- Reading proficiency
- 56% ▼ -1.00%
- Median HH income
- $86,925
- Composite
- 39.57/100
- National rank
- #3931
- State rank
- #193 of 472 in NJ
Livability — Blairstown
- Score
- 59/100
- State rank
- #490
- US rank
- #19828
Category grades
Schools grade is shown separately in the Schools card above.
Census & demographics
- Census place
- Blairstown, NJ
- County
- Warren County · 63,532 people
- City population
- 9,271
- Metro
- Allentown-Bethlehem-Easton, PA-NJ
- Population (ZIP)
- 32,105
- Household income
- $105,866
- Rent vs Own
- Severe rent burden
- 1114.0
Population outlook (Warren County) Hauer SSP2
- Today (2025)
- 105,498 people
- By 2030
- 103,974 · -1.4%
- By 2040
- 99,748 · -5.5%
- By 2050
- 94,535 · -10.4%
- By 2075
- 87,220 · -17.3%
- By 2100
- 80,421 · -23.8%
Race, ethnicity, and origin ACS 2023
- Neighborhood character
- Predominantly White (70%)
- Race & ethnicity
- White 70% Hispanic / Latino 17% Two or more races 9% Asian 7% Black 5%
- Hispanic origin (detail)
- Mexican 1% Puerto Rican 4% Cuban 1% Dominican 1%
- Common ancestry
- Romanian 8% Subsaharan African 2% Iranian 2%
- Foreign-born
- 17% · Canada, Jamaica, Guatemala
- Languages at home
- 78% English-only · Spanish 12% Other Indo-European 4% Russian/Polish/Slavic 3%
Political lean MEDSL · Warren
- 2024 margin
- Strong R (+20.7) · D 38.8% · R 59.5% · Other 1.8%
- 2008→2024 swing
- -6.7pp toward R · 2008: -14.0pp · 2024: -20.7pp
- All cycles
- 2024: R+20.7 2020: R+16.2 2016: R+25.6 2012: R+15.8 2008: R+14.0
Not yet ingested
- Civics
- —
Market trends
- HPI YoY
- ▼ -214.76%
- Current HPI
- 245.9967
- Rent YoY
- —
- Metro
- Allentown-Bethlehem-Easton, PA-NJ
- State GDP YoY
- ▲ 2.05%
- F500 in state
- 34
Industry mix (Fortune 500 HQ in NJ)
| Industry | F500 HQs | Revenue |
|---|---|---|
| Consumer Goods | 3 | $31B |
|
||
| Pharmaceuticals | 2 | $153B |
|
||
| Technology | 2 | $21B |
|
||
| Insurance | 2 | $20B |
|
||
| Healthcare | 2 | $19B |
|
||
| Financial Services | 1 | $70B |
|
||
Price history
1 event — show timeline
- 2026-06-04 Listed $299,999 ForSaleByOwner.com
Cash-flow waterfall
monthlySold comps — $/sqft
last 12 mo · ≤1 miLoading sold comps…