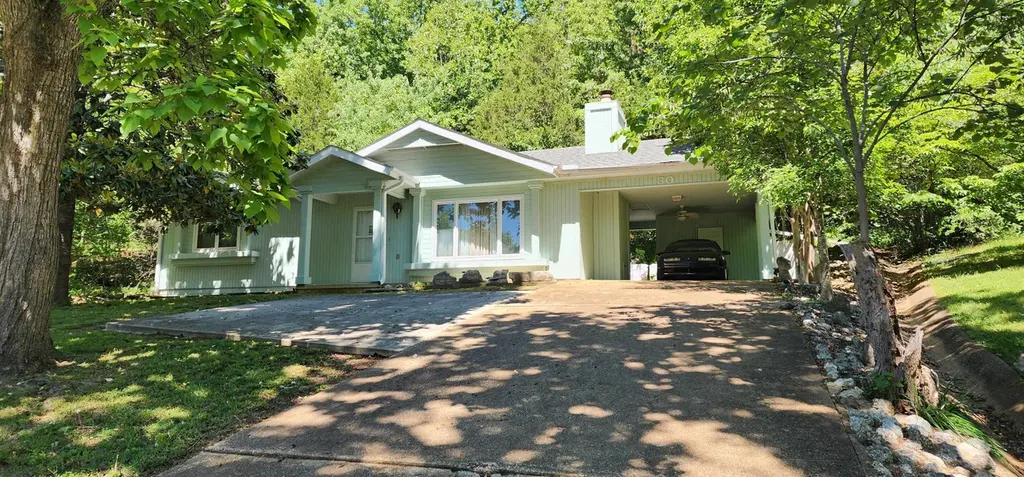
30 Wahoo Dr · Cherokee Village, AR
Flood risk 1/10 · Minimal
- FEMA flood zone
- X (unshaded)
- Chance of flooding over 30 yrs
- 0.0%
- Est. flood insurance / yr
- $507 – $1,088
Fire risk 3/10 · Minor
- Est. fire insurance / yr
- $1,499 – $2,785
Heat risk 5/10 · Moderate
- Hot days now (above 108°F)
- 7 days/yr
- Hot days in 30 yrs
- 20 days/yr
Wind risk 2/10 · Minimal
- Chance of severe wind over 30 yrs
- 4.0%
Air-quality risk 1/10 · Minimal
- Unhealthy air days now
- 0 days/yr
- Unhealthy air days in 30 yrs
- 0 days/yr
Risk factors via First Street. Map © Google.
Why this score? — see what drove the D grade
The composite is a weighted blend of 9 inputs, each scored 0–100. Each bar is that input's sub-score; the figure is the points it added to the 100-point composite (weight × sub-score).
- Cash flow +18.9/30.0
- DSCR +6.0/10.0
- 1% rule +4.0/10.0
- Schools +3.4/10.0
- Livability +3.1/5.0
- Rent growth +2.5/5.0
- Condition / age +2.5/5.0
- ARV discount +0.0/15.0
- Appreciation +0.0/10.0
$149,900
🖨 Deal sheet 📄 Offer letter ✓ Due diligence
Listing remarks MLS
Welcome to this charming single level 2 bed 1.5 bath, perfectly situated across the street from Lake Thunderbird! Enjoy easy lake living with beautiful views year round without lakeshore or dock maintenance! This home is currently an income producing property!!!
Key facts
- Lake views
- 0.29 acre lot
- Parking
Tags
Neighborhood map
What this means for you Summary
Snapshot
- This is a 2-bed/1.5-bath single-family listed at $150k.
Deal economics
- At list price, monthly cash flow is $154 ($2k/yr) — positive.
- The deal already cash-flows at list — no discount required.
- To meet the 1% rule (rent ≥ 1% of price), the offer needs to be $135k (10.2% below list).
- Recommended offer: $135k (10.2% below list) — sets the bar for 1% rule.
- Cap rate 7.5% vs local median 5.7% in Cherokee Village — top-decile yield for the area; either an underpriced asset or a hidden risk that comps aren't pricing in. Stress-test before assuming the spread holds.
Location & tenants
- Location reads 62/100 on livability (#227 in AR) — a middle-class / working-renter tenant base. Strengths: cost of living A+, crime A, housing B+; Watch: schools F, amenities F, commute F.
- Highland School District (town): math 43% / reading 39% proficiency, ranked #66 of 238 in AR (top 28%) — families likely to look elsewhere, expect single-tenant / working-renter base with shorter leases.
- Market conditions: 688 active listings in the ZIP; 2 comparable units currently listed for rent nearby; 4 units permitted in Sharp County in 2024 (0 in 5+ unit buildings).
Forward outlook
- Local home prices are declining (-3.0%/yr); year-one equity from $1k of loan paydown is wiped out by about $4k of value loss. Plan a longer hold.
- Sharp County population projected at -11% by 2050 — secular population decline; favor cash flow + early exit over multi-decade hold.
Negotiation context
- It's been on market 43 days — a 3% lower offer ($145k) is reasonable based on typical stale-listing flexibility.
- 2 sale attempts; this cycle's ask has dropped $9k (6%) from the opening price — seller is motivated, your offer sets the floor, not the list.
- Current owner paid $66k; list at $150k implies a 126% gain — meaningful room to come down on a strong offer.
Risks & watch-outs
- Climate carrying-cost: extreme-heat days projected 7→20/yr by 2055 (HVAC capex compounding) — expect insurance premiums to compound above CPI over the hold.
Questions for the listing agent
- It's been on market 43 days. Have you received any prior offers? Is the seller open to a 10% concession, seller financing, or rate buy-down credit?
- Is there a deadline driving the sale (1031 exchange, divorce, estate, relocation)? That informs how much negotiation room exists.
- Schools are F-rated, which usually means shorter tenancies and higher turnover. Who's the typical renter profile here, and what's been the actual vacancy rate?
- The area grade is low — what's the realistic commute time and amenity access for the typical tenant pool here? Any planned neighborhood developments (good or bad) we should know about?
- What's the average days-on-market for RENTAL listings here right now (not sales)? A rising rental-DOM trend means longer vacancies and softer asking-rent achievability than the comps imply.
- What's the recent tenant-quality profile in this submarket — average credit score on applications, eviction rate, late-payment / NSF rate, and stable-employment percentage? A property-management company in the area should have these aggregated.
- How much new for-sale + rental construction is in the pipeline within 1–3 miles? Heavy new supply typically softens prices + rents 12–24 months out; constrained supply supports both.
Investment metrics
- 1% rule
- 0.90% ✗
- Cap rate
- 7.52%
- Cash-on-cash
- 4.39%
- DSCR
- 1.20
- GRM
- 9.3
CMA / ARV
- ARV (median comp)
- $120,535
- List price
- $149,900
- Delta
- 24.36%
- Verdict
- OVERPRICED
- Comps
- 20 within 1.0 mi
Show comp detail 6 sales within ~0.75 mi
| Address | Dist | Beds/Ba | Sqft | Sold | Price | $/sf | Match |
|---|---|---|---|---|---|---|---|
| 5 Winnebago Cir | 0.63mi | 2/1.5 | 1,024 (+2%) | 10mo | $138,000 | $135 | 60 |
| 36 Delaware Dr | 0.71mi | 2/1.0 | 1,032 (+2%) | 10mo | $135,000 | $131 | 53 |
| 110 Iroquois Dr | 0.40mi | 2/1.0 | 1,056 (+5%) | 23mo | $90,000 | $85 | 52 |
| 16 War Eagle Dr | 0.45mi | 2/1.5 | 1,140 (+13%) | 10mo | $150,000 | $132 | 48 |
| 59 Okmulgee Dr Dr | 0.74mi | 2/1.5 | 1,032 (+2%) | 23mo | $159,000 | $154 | 42 |
| 170 E Lakeshore Dr | 0.74mi | 2/2.0 | 1,152 (+14%) | 2mo | $266,000 | $231 | 38 |
Match score weights: distance 35% · size 25% · config 20% · recency 20%. Top-matched comps best support the ARV.
Projected returns pro-forma
-3.0% appreciation · 3.0% rent growth · sell at horizon
- IRR
- -9.5%
- Equity multiple
- 0.65×
- Total profit
- $-14,566
- Equity at exit
- $22,351
- IRR
- -0.1%
- Equity multiple
- 0.99×
- Total profit
- $-321
- Equity at exit
- $12,961
Cash invested: $41,972 (down + closing). Projections, not guarantees.
Landlord ↔ Tenant lean methodology
- Overall (STATE)
- 92 Strongly Landlord-Friendly
- State Arkansas
- 92 Strongly Landlord-Friendly · R+14
- County
- — inherits STATE
- City
- — inherits STATE
ZIP-level market 72529
- Home prices YoY
- -18.2%
- Active inventory
- 688
- Price-to-rent
- 9.3×
Monthly cashflow live
- Estimated rent
- $1,346 medium interval (Pro) →
- Mortgage (P&I)
- −$786
- Tax from tax record
- −$61 /mo · $734/yr
- Insurance
- −$62
- HOA
- −$0
- Vacancy / Maint / Mgmt
- −$283
- Net cashflow
- $154
Break-even live
UW: 25.0% down · 7.5% · 30yr · 1.5% tax · 5.0% vac · 8.0% maint · 8.0% mgmt
Financing live
Cash to close
- Down payment
- $37,475
- Closing costs
- $4,497
- Reserves months
- —
- Total cash needed
- —
Loan-product check · same deal, 3 products live
Conventional
25% down · 7.5% · 30yr
- Down + closing
- —
- Monthly P&I
- —
- Monthly cashflow
- —
- DSCR
- —
- Eligible?
- —
Personal DTI + credit; lowest rate.
DSCR
20% down · 8.5% · 30yr
- Down + closing
- —
- Monthly P&I
- —
- Monthly cashflow
- —
- DSCR
- —
- Eligible?
- —
No personal income docs; deal must DSCR.
Hard money
10% down · 12.0% · 12mo
- Down + closing
- —
- Monthly P&I
- —
- Monthly cashflow
- —
- DSCR
- —
- Eligible?
- —
Short-term bridge; refi at stabilization.
Rent comps 2 comps
| Address | Beds | Baths | Sqft | Rent | $/sqft | DOM | Units | Dist |
|---|---|---|---|---|---|---|---|---|
| 128 W Lakeshore Dr Cherokee Village, AR | 2.0 | 2.0 | 1344 | $1,500 | $1.12 | 43d | 1 | 0.60mi |
| 16 Annette Rd Cherokee Village, AR | 3.0 | 2.5 | 1500 | $1,100 | $0.73 | 43d | 1 | 0.86mi |
Listing history 24 events
-
2026-06-19days on market $149,900 Active 43 DOM
-
2026-06-18days on market $149,900 Active 42 DOM
-
2026-06-17statusdays on market $149,900 Active 41 DOM
-
2026-06-16days on market $149,900 Price Change 40 DOM
-
2026-06-15days on market $149,900 Price Change 39 DOM
-
2026-06-14days on market $149,900 Price Change 37 DOM
-
2026-06-12pricestatusdays on market $149,900 Price Change 36 DOM
-
2026-06-09days on market $154,900 Active 33 DOM
-
2026-06-08days on market $154,900 Active 32 DOM
-
2026-06-07days on market $154,900 Active 31 DOM
-
2026-06-07days on market $154,900 Active 30 DOM
-
2026-06-04days on market $154,900 Active 27 DOM
-
2026-06-02days on market $154,900 Active 26 DOM
-
2026-06-01days on market $154,900 Active 25 DOM
-
2026-05-31days on market $154,900 Active 24 DOM
-
2026-05-31days on market $154,900 Active 23 DOM
-
2026-05-13price $154,900 263-char remark
Show marketing remark (263 chars)
Welcome to this charming single level 2 bed 1.5 bath, perfectly situated across the street from Lake Thunderbird! Enjoy easy lake living with beautiful views year round without lakeshore or dock maintenance! This home is currently an income producing property!!!
-
2026-05-12status Price Change 263-char remark
Show marketing remark (263 chars)
Welcome to this charming single level 2 bed 1.5 bath, perfectly situated across the street from Lake Thunderbird! Enjoy easy lake living with beautiful views year round without lakeshore or dock maintenance! This home is currently an income producing property!!!
-
2026-04-20historical 263-char remark
Show marketing remark (263 chars)
Welcome to this charming single level 2 bed 1.5 bath, perfectly situated across the street from Lake Thunderbird! Enjoy easy lake living with beautiful views year round without lakeshore or dock maintenance! This home is currently an income producing property!!!
-
2026-04-01$159,000 New Listing 263-char remark
Show marketing remark (263 chars)
Welcome to this charming single level 2 bed 1.5 bath, perfectly situated across the street from Lake Thunderbird! Enjoy easy lake living with beautiful views year round without lakeshore or dock maintenance! This home is currently an income producing property!!!
-
2007-05-15soldstatus $66,450
-
2005-02-28soldstatus $51,800
-
1999-03-19soldstatus $39,000
-
1995-10-11soldstatus $47,000
ⓘ Source: listings_history table (triggers on properties + properties_extension) + one-shot
backfill from property_details.listing_events for pre-trigger history.
Tax reassessment forecast AR · Resets to sale price
- Current annual tax
- $734 · $61/mo
- Projected year-2 tax
- $959 · $80/mo
- Expected delta
- +$225/yr (+$19/mo · 30.7%)
ⓘ Screening estimate from a state-policy table — verify with the county assessor before closing.
Climate risk First Street
- Flood 1/10 Low FEMA zone X (unshaded) · 0% chance over 30 yrs
- Wildfire 3/10 Moderate
- Heat 5/10 Major 7 d/yr ≥108°F today · 20 d/yr by 30 yrs out
- Wind 2/10 Low 4% chance of damaging wind over 30 yrs
- Air quality 1/10 Low 0 unhealthy d/yr today · 0 by 30 yrs out
Nearby sold comps map
Loading sold comps map…
Walkable amenities ~0.75 mi
Loading nearby amenities…
Taxation est. · year 1
- Rental income
- $16,152
- − Mortgage interest
- −$8,397
- − Property taxes
- −$734
- − Insurance
- −$750
- − Repairs & maintenance
- −$1,292
- − Management
- −$1,292
- − Depreciation
- −$4,361
- Taxable loss
- −$674
- Est. tax savings @ 24.0%
- +$162
- After-tax cash flow
- $2,005/yr
For passive investors: Depreciation is non-cash, so a rental often shows a tax loss while cash-flowing — sheltering income. Rental losses are passive: they offset passive income freely, and up to $25,000/yr can offset ordinary (W-2) income if you actively participate and your MAGI is under $100k (phasing out to $0 by $150k); unused losses carry forward. On sale, claimed depreciation is recaptured at up to 25%, and gains may owe capital-gains tax (a 1031 exchange can defer both). Figures are a year-1 estimate at your 24.0% rate — not tax advice; consult a CPA.
Schools (NCES district)
- District
- Highland School District
- NCES district ID
- 0507770
- Math proficiency
- 43% ▼ -7.00%
- Reading proficiency
- 39% ▼ -9.00%
- Median HH income
- $32,066
- Composite
- 33.63/100
- National rank
- #5400
- State rank
- #66 of 238 in AR
Livability — Cherokee Village
- Score
- 62/100
- State rank
- #227
- US rank
- #17211
Category grades
Schools grade is shown separately in the Schools card above.
Census & demographics
- Census place
- Cherokee Village, AR
- City population
- 5,090
- Population (ZIP)
- 5,090
Population outlook (Sharp County) Hauer SSP2
- Today (2025)
- 16,170 people
- By 2030
- 15,711 · -2.8%
- By 2040
- 14,974 · -7.4%
- By 2050
- 14,420 · -10.8%
- By 2075
- 13,235 · -18.2%
- By 2100
- 11,492 · -28.9%
Race, ethnicity, and origin ACS 2023
- Neighborhood character
- Predominantly White (90%)
- Race & ethnicity
- White 90% Two or more races 5% Hispanic / Latino 4% Native American 2%
- Common ancestry
- Lithuanian 6% Italian 3% Romanian 3%
- Foreign-born
- 1%
Political lean MEDSL · Sharp
- 2024 margin
- Solid R (+62.7) · D 17.7% · R 80.4% · Other 1.9%
- 2008→2024 swing
- -33.7pp toward R · 2008: -28.9pp · 2024: -62.7pp
- All cycles
- 2024: R+62.7 2020: R+60.0 2016: R+54.7 2012: R+38.8 2008: R+28.9
Not yet ingested
- Civics
- —
Market trends
- HPI YoY
- ▼ -40.53%
- Current HPI
- 182.4438
- Rent YoY
- —
- Metro
- —
- State GDP YoY
- ▲ 3.80%
- F500 in state
- 10
Industry mix (Fortune 500 HQ in AR)
| Industry | F500 HQs | Revenue |
|---|---|---|
| Retail | 1 | $681B |
|
||
| Food / Agriculture | 1 | $53B |
|
||
| Retail / Energy | 1 | $22B |
|
||
| Transportation / Logistics | 1 | $12B |
|
||
| Energy | 1 | $4B |
|
||
Price history
+229.6% since first listed8 events — show timeline
- 2026-05-13 Price Changed $154,900 CARMLS
- 2026-05-12 Relisted — CARMLS
- 2026-04-20 Listing Removed — CARMLS
- 2026-04-01 Listed $159,000 CARMLS
- 2007-05-15 Sold (Public Records) $66,450 Public Records
- 2005-02-28 Sold (Public Records) $51,800 Public Records
- 1999-03-19 Sold (Public Records) $39,000 Public Records
- 1995-10-11 Sold (Public Records) $47,000 Public Records
Property tax history
+1.0%/yrLatest (2025): $734 · +8.1% YoY. Source: county tax records.
Cash-flow waterfall
monthlySold comps — $/sqft
last 12 mo · ≤1 miLoading sold comps…