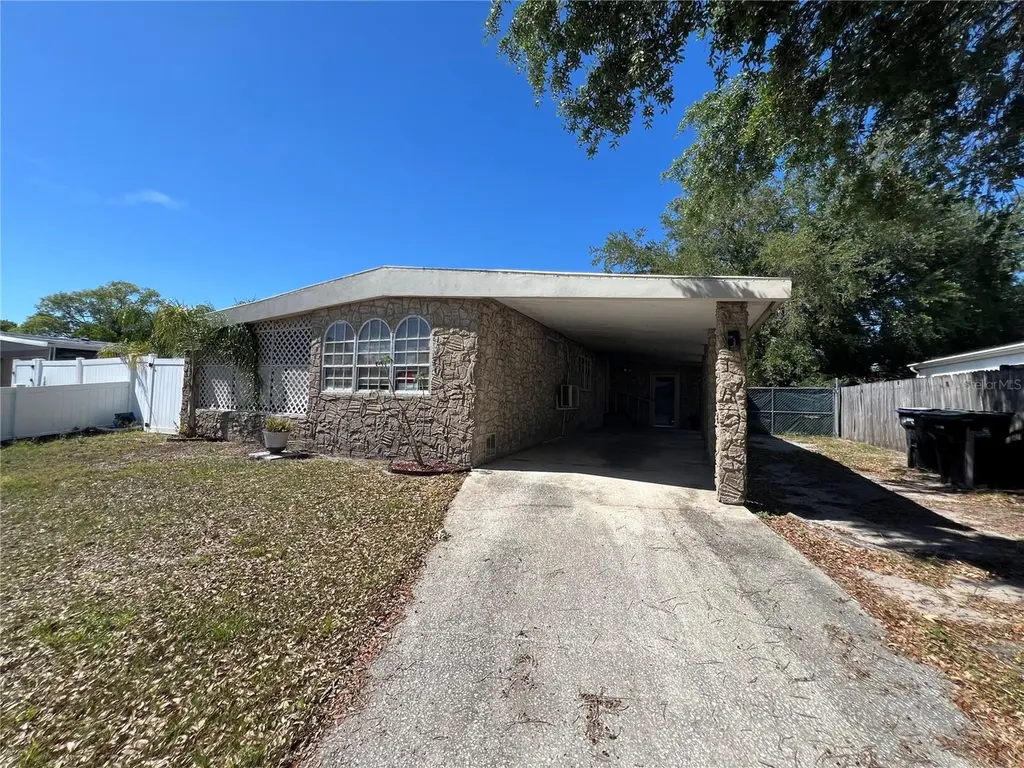
6937 Gibraltar Rd · Orlando, FL
Flood risk 1/10 · Minimal
- FEMA flood zone
- X (unshaded)
- Chance of flooding over 30 yrs
- 0.0%
- Est. flood insurance / yr
- $507 – $1,088
Fire risk 1/10 · Minimal
- Est. fire insurance / yr
- $947 – $1,759
Heat risk 9/10 · Severe
- Hot days now (above 108°F)
- 7 days/yr
- Hot days in 30 yrs
- 22 days/yr
Wind risk 9/10 · Severe
- Chance of severe wind over 30 yrs
- 99.0%
Air-quality risk 2/10 · Minimal
- Unhealthy air days now
- 1 days/yr
- Unhealthy air days in 30 yrs
- 1 days/yr
Risk factors via First Street. Map © Google.
Why this score? — see what drove the C- grade
The composite is a weighted blend of 9 inputs, each scored 0–100. Each bar is that input's sub-score; the figure is the points it added to the 100-point composite (weight × sub-score).
- Cash flow +18.9/30.0
- ARV discount +7.5/15.0
- DSCR +6.0/10.0
- 1% rule +4.6/10.0
- Livability +4.3/5.0
- Schools +4.1/10.0
- Condition / age +2.5/5.0
- Rent growth +2.3/5.0
- Appreciation +0.0/10.0
$219,000
🖨 Deal sheet 📄 Offer letter ✓ Due diligence
Listing remarks
Discover this move-in ready mobile home located in the desirable Lynwood Estates community of Orlando, FL—where there’s no HOA to worry about! Perfectly situated in a prime location, this home places you just minutes from Orlando International Airport, Downtown Orlando, Disney, and Universal Studios, offering unbeatable convenience to world-class entertainment, dining, and travel. This well-maintained home features a spacious layout with a bonus den, ideal for a home office, playroom, or guest area. Enjoy a private, fully fenced backyard—perfect for outdoor activities, pets, or weekend gatherings. Whether you’re a first-time buyer, investor, or someone looking for a
Key facts
- Move in ready
- Bonus den
- 7,606 sq ft lot
Tags
Property features AI
Finance
- Other: Property classified as residential, mobile home; Zoned R-T-1; Lot approximately 0.17 acres (about 707 sq meters); Property homesteaded
- HOA & community: No association indicated
Exterior
- Parking: Carport (1 space)
- Utilities: Public water; Public sewer; Electricity connected
- Home design: Residential mobile home (single wide); One level; Faces south
- Construction: Stone construction; Other roof type; Crawlspace foundation; Built on/last recorded building area 2,030 square feet
- Exterior features: Sidewalk
Interior
- Kitchen: Range; Microwave; Refrigerator; Electric water heater
- Bedrooms: 4 bedrooms
- Flooring: Laminate
- Bathrooms: 2 full bathrooms
- Heating & cooling: Electric heating; Mini-split cooling unit(s)
- Interior features: Ceiling fans
- Laundry & utility: Dedicated laundry room
Neighborhood map
What this means for you Summary
Snapshot
- This is a 4-bed/2.0-bath land listed at $219k.
Deal economics
- At list price, monthly cash flow is $225 ($3k/yr) — positive.
- The deal already cash-flows at list — no discount required.
- To meet the 1% rule (rent ≥ 1% of price), the offer needs to be $210k (3.9% below list).
- Recommended offer: $206k (6.0% below list) — sets the bar for market timing.
- Cap rate 7.5% vs local median 3.0% in Orlando — top-decile yield for the area; either an underpriced asset or a hidden risk that comps aren't pricing in. Stress-test before assuming the spread holds.
Location & tenants
- Location reads 86/100 on livability (#12 in FL, #360 nationally) — a professional / high-income tenant draw. Strengths: amenities A+, commute A+, housing A+.
- Orange (suburban): math 46% / reading 51% proficiency, ranked #43 of 73 in FL (top 59%) — families likely to look elsewhere, expect single-tenant / working-renter base with shorter leases.
- Market conditions: Rents soft (-0.7%/yr); 372 active listings in the ZIP; 31 comparable units currently listed for rent nearby; rentals leasing fast (median 13d on market — plan ~1-2 weeks tenant-placement turnaround); 8,053 units permitted in Orange County in 2024 (3,133 in 5+ unit buildings).
- This rent runs 45% of the median local income ($57k/yr) — at the standard rent-burdened threshold; future hikes will face affordability resistance.
Forward outlook
- Local home prices are declining (-3.0%/yr); year-one equity from $2k of loan paydown is wiped out by about $7k of value loss. Plan a longer hold.
- Orange County population projected at +52% by 2050 — long-run rental-demand tailwind backs the buy-and-hold thesis.
Negotiation context
- It's been on market 74 days — a 6% lower offer ($206k) is reasonable based on typical stale-listing flexibility.
- 4 sale attempts since 2y ago with the ask held roughly flat each time — persistent listings suggest the price (not the market) is what's stuck; bring a comps-based counter.
- Current owner paid $44k; list at $219k implies a 395% gain — meaningful room to come down on a strong offer.
Risks & watch-outs
- Climate carrying-cost: severe wind risk, 99% chance of damaging wind over 30y; extreme-heat days projected 7→22/yr by 2055 (HVAC capex compounding) — expect insurance premiums to compound above CPI over the hold.
Questions for the listing agent
- It's been on market 74 days. Have you received any prior offers? Is the seller open to a 6% concession, seller financing, or rate buy-down credit?
- Built in 1971 — when were the roof, HVAC, electrical panel, plumbing, and water heater last replaced?
- Why hasn't it sold? Are there any deal-killer items the seller is aware of (foundation, flood, title, zoning, code violations)?
- Is there a deadline driving the sale (1031 exchange, divorce, estate, relocation)? That informs how much negotiation room exists.
- Schools are B-rated — typically a magnet for longer-tenancy family renters. What's the average tenant stay here, and is there a school-zone premium baked into asking?
- What's the average days-on-market for RENTAL listings here right now (not sales)? A rising rental-DOM trend means longer vacancies and softer asking-rent achievability than the comps imply.
- What's the recent tenant-quality profile in this submarket — average credit score on applications, eviction rate, late-payment / NSF rate, and stable-employment percentage? A property-management company in the area should have these aggregated.
- How much new for-sale + rental construction is in the pipeline within 1–3 miles? Heavy new supply typically softens prices + rents 12–24 months out; constrained supply supports both.
Investment metrics
- 1% rule
- 0.96% ✗
- Cap rate
- 7.53%
- Cash-on-cash
- 4.41%
- DSCR
- 1.20
- GRM
- 8.7
CMA / ARV
No comps found within radius.
Projected returns pro-forma
-3.0% appreciation · 0.0% rent growth · sell at horizon
- IRR
- -12.7%
- Equity multiple
- 0.55×
- Total profit
- $-27,322
- Equity at exit
- $32,654
- IRR
- -8.8%
- Equity multiple
- 0.52×
- Total profit
- $-29,212
- Equity at exit
- $18,935
Cash invested: $61,320 (down + closing). Projections, not guarantees.
Landlord ↔ Tenant lean methodology
- Overall (STATE)
- 87 Strongly Landlord-Friendly
- State Florida
- 87 Strongly Landlord-Friendly · R+3
- County
- — inherits STATE
- City
- — inherits STATE
ZIP-level market 32822
- Home prices YoY
- -21.1%
- Rents YoY
- -0.7%
- Active inventory
- 372
- Price-to-rent
- 8.7×
Monthly cashflow live
- Estimated rent
- $2,104 high interval (Pro) →
- Mortgage (P&I)
- −$1,148
- Tax from tax record
- −$198 /mo · $2,370/yr
- Insurance
- −$91
- HOA
- −$0
- Vacancy / Maint / Mgmt
- −$442
- Net cashflow
- $225
Break-even live
UW: 25.0% down · 7.5% · 30yr · 1.5% tax · 5.0% vac · 8.0% maint · 8.0% mgmt
Financing live
Cash to close
- Down payment
- $54,750
- Closing costs
- $6,570
- Reserves months
- —
- Total cash needed
- —
Loan-product check · same deal, 3 products live
Conventional
25% down · 7.5% · 30yr
- Down + closing
- —
- Monthly P&I
- —
- Monthly cashflow
- —
- DSCR
- —
- Eligible?
- —
Personal DTI + credit; lowest rate.
DSCR
20% down · 8.5% · 30yr
- Down + closing
- —
- Monthly P&I
- —
- Monthly cashflow
- —
- DSCR
- —
- Eligible?
- —
No personal income docs; deal must DSCR.
Hard money
10% down · 12.0% · 12mo
- Down + closing
- —
- Monthly P&I
- —
- Monthly cashflow
- —
- DSCR
- —
- Eligible?
- —
Short-term bridge; refi at stabilization.
Rent comps 31 comps
| Address | Beds | Baths | Sqft | Rent | $/sqft | DOM | Units | Dist |
|---|---|---|---|---|---|---|---|---|
| 6960 Gibraltar Rd Orlando, FL | 3.0 | 2.0 | 1383 | $1,500 | $1.08 | 24d | 1 | 0.08mi |
| 5927 Lake Pointe Village Cir Orlando, FL | 3.0 | 2.0 | 1307 | $1,980 | $1.51 | 22d | 1 | 0.62mi |
| 6791 Tussilago Way Orlando, FL | 3.0 | 2.5 | 1648 | $2,295 | $1.39 | 24d | 1 | 0.62mi |
| 4117 Berkshire Bay Ct Orlando, FL | 3.0 | 2.0 | 1075 | $2,026 | $1.88 | 8d | 1 | 0.65mi |
| 5926 Lake Pointe Village Cir Orlando, FL | 3.0 | 2.0 | 1307 | $2,125 | $1.63 | 15d | 1 | 0.65mi |
| 5975 Lake Pointe Village Cir Orlando, FL | 2.0–3.0 | 2.0–2.5 | 1236 | $2,015 | $1.63 | 4d | 12 | 0.67mi |
| 5119 Jalisco Ln Orlando, FL | 3.0 | 2.0 | 1504 | $2,350 | $1.56 | 12d | 1 | 0.68mi |
| 3049 Jon Jon Ct Orlando, FL | 3.0 | 2.0 | 1050 | $1,995 | $1.90 | 24d | 1 | 0.69mi |
| 6898 Tussilago Way Orlando, FL | 3.0 | 2.5 | 1648 | $2,250 | $1.37 | 24d | 1 | 0.70mi |
| 5015 Edmee Cir Orlando, FL | 5.0 | 2.0 | 1173 | $1,950 | $1.66 | 12d | 1 | 0.75mi |
| 3950 Southpointe Dr #418 Orlando, FL | 3.0 | 2.0 | 1226 | $1,985 | $1.62 | 16d | 1 | 0.80mi |
| 4528 Commander Dr #2011 Orlando, FL | 3.0 | 2.0 | 1253 | $1,895 | $1.51 | 18d | 1 | 0.83mi |
| 4403 S Semoran Blvd #6 Orlando, FL | 3.0 | 2.0 | 1426 | $2,095 | $1.47 | 8d | 1 | 0.88mi |
| 4407 S Semoran Blvd #2 Orlando, FL | 3.0 | 2.0 | 1426 | $1,860 | $1.30 | 24d | 1 | 0.91mi |
| 4401 S Semoran Blvd #1 Orlando, FL | 3.0 | 2.5 | 1660 | $2,150 | $1.30 | 12d | 1 | 0.92mi |
| 7528 Marbella Pointe Dr Orlando, FL | 1.0–4.0 | 1.0–3.0 | 1141 | $2,209 | $1.94 | 2d | 22 | 0.97mi |
| 3528 Idle Hour Dr Orlando, FL | 3.0 | 2.0 | 1494 | $2,600 | $1.74 | 18d | 1 | 1.06mi |
| 3432 Idlegrove Ct Orlando, FL | 4.0 | 2.5 | 2071 | $3,600 | $1.74 | 17d | 1 | 1.09mi |
| 5575 Rosebriar Way Orlando, FL | 2.0–3.0 | 1.0–2.0 | 980 | $1,862 | $1.90 | 2d | 6 | 1.14mi |
| 4233 Anthony Ln Orlando, FL | 3.0 | 1.0 | 1210 | $1,925 | $1.59 | 14d | 1 | 1.17mi |
| 2813 Whippet Ct Orlando, FL | 3.0 | 2.0 | 1368 | $2,349 | $1.72 | 3d | 1 | 1.18mi |
| 5545 Devonbriar Way Orlando, FL | 3.0 | 2.0 | 1150 | $1,450 | $1.26 | 24d | 1 | 1.26mi |
| 7305 Marseille Cir Orlando, FL | 3.0 | 2.0 | 1138 | $2,199 | $1.93 | 15d | 1 | 1.30mi |
| 4750 Kempston Dr Orlando, FL | 4.0 | 2.0 | 1638 | $2,511 | $1.53 | 8d | 1 | 1.31mi |
| 5789 Bent Pine Dr Orlando, FL | 3.0 | 1.0–2.0 | 802 | $2,067 | $2.58 | 2d | 49 | 1.36mi |
| 5901 Bent Pine Dr Orlando, FL | 1.0–3.0 | 1.0–2.0 | 1001 | $2,239 | $2.24 | 2d | 24 | 1.36mi |
| 6400 Narcoossee Rd Orlando, FL | 1.0–3.0 | 1.0–2.0 | 977 | $2,171 | $2.22 | 2d | 13 | 1.39mi |
| 7870 Pine Fork Dr Orlando, FL | 3.0 | 2.0 | 1119 | $2,223 | $1.99 | 22d | 1 | 1.42mi |
| 5900 Bent Pine Dr Orlando, FL | 1.0–3.0 | 1.0–2.0 | 908 | $1,945 | $2.14 | 3d | 21 | 1.43mi |
| 7632 Harbor Lake Dr Orlando, FL | 3.0 | 2.0 | 1292 | $2,100 | $1.63 | 11d | 1 | 1.46mi |
| 8467 Fort Thomas Way Orlando, FL | 3.0 | 2.0 | 1646 | $2,300 | $1.40 | 4d | 1 | 1.46mi |
Listing history 31 events
-
2026-06-18days on market $219,000 Active 74 DOM
-
2026-06-17days on market $219,000 Active 73 DOM
-
2026-06-16days on market $219,000 Active 72 DOM
-
2026-06-15days on market $219,000 Active 71 DOM
-
2026-06-13days on market $219,000 Active 69 DOM
-
2026-06-13days on market $219,000 Active 68 DOM
-
2026-06-09days on market $219,000 Active 65 DOM
-
2026-06-08days on market $219,000 Active 64 DOM
-
2026-06-07days on market $219,000 Active 63 DOM
-
2026-06-04days on market $219,000 Active 60 DOM
-
2026-06-03days on market $219,000 Active 59 DOM
-
2026-06-02days on market $219,000 Active 58 DOM
-
2026-06-02days on market $219,000 Active 57 DOM
-
2026-05-31days on market $219,000 Active 56 DOM
-
2026-04-05$219,000 Active
-
2025-12-16historical
-
2025-09-17$229,900 Active
-
2025-07-15historical
-
2025-05-26price $244,900
-
2025-05-08price $249,900
-
2025-04-28price $259,900
-
2025-04-16$264,900 Active
-
2025-02-19historical
-
2025-01-11price $260,000
-
2024-12-09price $265,000
-
2024-11-12price $269,900
-
2024-11-04price $274,900
-
2024-10-03$279,900 Active
-
2003-12-18soldstatus $44,200
-
1992-09-01soldstatus $36,000
-
1976-06-01soldstatus $11,200
ⓘ Source: listings_history table (triggers on properties + properties_extension) + one-shot
backfill from property_details.listing_events for pre-trigger history.
Tax reassessment forecast FL · Resets to sale price
- Current annual tax
- $2,370 · $198/mo
- Projected year-2 tax
- $2,370 · $198/mo
- Expected delta
- $0/yr ($0/mo · 0.0%)
ⓘ Screening estimate from a state-policy table — verify with the county assessor before closing.
Climate risk First Street
- Flood 1/10 Low FEMA zone X (unshaded) · 0% chance over 30 yrs
- Wildfire 1/10 Low
- Heat 9/10 Extreme 7 d/yr ≥108°F today · 22 d/yr by 30 yrs out
- Wind 9/10 Extreme 99% chance of damaging wind over 30 yrs
- Air quality 2/10 Low 1 unhealthy d/yr today · 1 by 30 yrs out
Nearby sold comps map
Loading sold comps map…
Walkable amenities ~0.75 mi
Loading nearby amenities…
Taxation est. · year 1
- Rental income
- $25,253
- − Mortgage interest
- −$12,267
- − Property taxes
- −$2,370
- − Insurance
- −$1,095
- − Repairs & maintenance
- −$2,020
- − Management
- −$2,020
- − Depreciation
- −$6,371
- Taxable loss
- −$891
- Est. tax savings @ 24.0%
- +$214
- After-tax cash flow
- $2,917/yr
For passive investors: Depreciation is non-cash, so a rental often shows a tax loss while cash-flowing — sheltering income. Rental losses are passive: they offset passive income freely, and up to $25,000/yr can offset ordinary (W-2) income if you actively participate and your MAGI is under $100k (phasing out to $0 by $150k); unused losses carry forward. On sale, claimed depreciation is recaptured at up to 25%, and gains may owe capital-gains tax (a 1031 exchange can defer both). Figures are a year-1 estimate at your 24.0% rate — not tax advice; consult a CPA.
Schools (NCES district)
- District
- Orange
- NCES district ID
- 1201440
- Math proficiency
- 46% ▼ -9.00%
- Reading proficiency
- 51% ▼ -2.00%
- Median HH income
- $49,350
- Composite
- 41.47/100
- National rank
- #3461
- State rank
- #43 of 73 in FL
Livability — Orlando
- Score
- 86/100
- State rank
- #12
- US rank
- #360
Category grades
Schools grade is shown separately in the Schools card above.
Census & demographics
- County
- Orange County · 1,471,359 people
- City population
- 964,969
- Metro
- Orlando-Kissimmee-Sanford, FL
- Population (ZIP)
- 67,081
- Household income
- $56,540
- Rent vs Own
- Severe rent burden
- 4246.0
Population outlook (Orange County) Hauer SSP2
- Today (2025)
- 1,618,226 people
- By 2030
- 1,787,404 · +10.5%
- By 2040
- 2,125,621 · +31.4%
- By 2050
- 2,454,016 · +51.6%
- By 2075
- 3,173,711 · +96.1%
- By 2100
- 3,607,781 · +122.9%
Race, ethnicity, and origin ACS 2023
- Neighborhood character
- Predominantly Hispanic (68%)
- Race & ethnicity
- Hispanic / Latino 68% Two or more races 36% White 17% Black 10% Asian 2%
- Hispanic origin (detail)
- Mexican 2% Puerto Rican 38% Cuban 5% Dominican 5%
- Common ancestry
- Lithuanian 1% Romanian 1% Slovak 1%
- Foreign-born
- 27% · Canada, Jamaica, China
- Languages at home
- 36% English-only · Spanish 60% French/Haitian/Cajun 1% Arabic 1%
Political lean MEDSL · Orange
- 2024 margin
- D (+13.6) · D 56.1% · R 42.5% · Other 1.3%
- 2008→2024 swing
- -5.0pp toward R · 2008: 18.6pp · 2024: 13.6pp
- All cycles
- 2024: D+13.6 2020: D+23.1 2016: D+24.6 2012: D+18.2 2008: D+18.6
Not yet ingested
- Civics
- —
Market trends
- HPI YoY
- ▼ -95.17%
- Current HPI
- 355.5775
- Rent YoY
- ▼ -0.68%
- Metro
- Orlando-Kissimmee-Sanford, FL
- State GDP YoY
- ▲ 3.28%
- F500 in state
- 36
Industry mix (Fortune 500 HQ in FL)
| Industry | F500 HQs | Revenue |
|---|---|---|
| Industrial Technology | 2 | $29B |
|
||
| Insurance | 2 | $17B |
|
||
| Retail | 1 | $60B |
|
||
| Technology Distribution | 1 | $58B |
|
||
| Homebuilding | 1 | $35B |
|
||
| Technology Manufacturing | 1 | $35B |
|
||
Price history
+1855.4% since first listed17 events — show timeline
- 2026-04-05 Listed $219,000 Stellar MLS as Distributed by MLS Grid
- 2025-12-16 Listing Removed — Stellar MLS as Distributed by MLS Grid
- 2025-09-17 Listed $229,900 Stellar MLS as Distributed by MLS Grid
- 2025-07-15 Listing Removed — Stellar MLS as Distributed by MLS Grid
- 2025-05-26 Price Changed $244,900 Stellar MLS as Distributed by MLS Grid
- 2025-05-08 Price Changed $249,900 Stellar MLS as Distributed by MLS Grid
- 2025-04-28 Price Changed $259,900 Stellar MLS as Distributed by MLS Grid
- 2025-04-16 Listed $264,900 Stellar MLS as Distributed by MLS Grid
- 2025-02-19 Listing Removed — Stellar MLS as Distributed by MLS Grid
- 2025-01-11 Price Changed $260,000 Stellar MLS as Distributed by MLS Grid
- 2024-12-09 Price Changed $265,000 Stellar MLS as Distributed by MLS Grid
- 2024-11-12 Price Changed $269,900 Stellar MLS as Distributed by MLS Grid
- 2024-11-04 Price Changed $274,900 Stellar MLS as Distributed by MLS Grid
- 2024-10-03 Listed $279,900 Stellar MLS as Distributed by MLS Grid
- 2003-12-18 Sold (Public Records) $44,200 Public Records
- 1992-09-01 Sold (Public Records) $36,000 Public Records
- 1976-06-01 Sold (Public Records) $11,200 Public Records
Property tax history
+12.4%/yrLatest (2025): $2,370 · +36.5% YoY. Source: county tax records.
Cash-flow waterfall
monthlySold comps — $/sqft
last 12 mo · ≤1 miLoading sold comps…