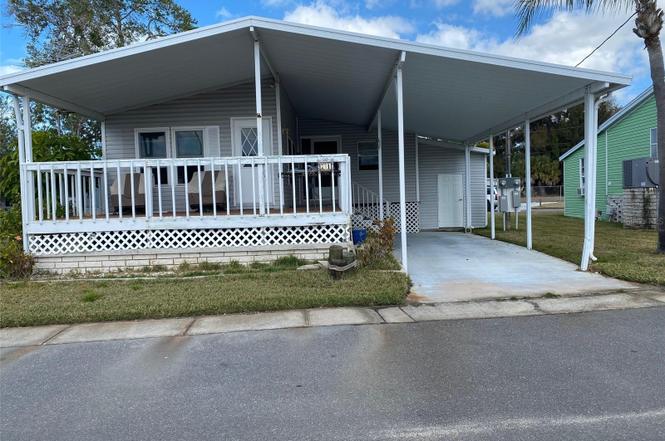
71 Schooner Dr #71 · Palm Harbor, FL
Flood risk 10/10 · Severe
- FEMA flood zone
- AE
- Chance of flooding over 30 yrs
- 0.99%
- Est. flood insurance / yr
- $1,737 – $8,500
Fire risk 1/10 · Minimal
- Est. fire insurance / yr
- $947 – $1,759
Heat risk 10/10 · Severe
- Hot days now (above 108°F)
- 6 days/yr
- Hot days in 30 yrs
- 23 days/yr
Wind risk 10/10 · Severe
- Chance of severe wind over 30 yrs
- 99.0%
Air-quality risk 3/10 · Minor
- Unhealthy air days now
- 3 days/yr
- Unhealthy air days in 30 yrs
- 3 days/yr
Risk factors via First Street. Map © Google.
Why this score? — see what drove the B- grade
The composite is a weighted blend of 9 inputs, each scored 0–100. Each bar is that input's sub-score; the figure is the points it added to the 100-point composite (weight × sub-score).
- Cash flow +30.0/30.0
- 1% rule +10.0/10.0
- DSCR +10.0/10.0
- ARV discount +7.5/15.0
- Schools +4.3/10.0
- Livability +4.0/5.0
- Condition / age +2.5/5.0
- Rent growth +1.4/5.0
- Appreciation +0.0/10.0
$80,000
🖨 Deal sheet 📄 Offer letter ✓ Due diligence
Listing remarks
Welcome to Crystal Bay Mobile Home Club; a charming seaside community in beautiful Palm Harbor, Florida. This quant and very active 55+ community is a RESIDENT OWNED COOP and features amenities including community dock and boat slips, fishing, clubhouse, pool, shuffleboard, beautiful Sunsets and a fantastic walking/biking path right outside of the community, known as the Pinellas Trail! This unit unfortunately sustained water damage from Hurricane Helene and has been deemed SUBSTANTIALLY DAMAGED. There are several options available to a new owner, including picking up where the seller left off on the appeal process to possibly renovate if approved, raise the current unit to put on a higher
Key facts
- Boat slips
- Clubhouse
- Community dock
Tags
Property features AI
Finance
- Other: Association total annual fees $2,580; Unfurnished
- Financial info: Lease restrictions apply
- HOA & community: Has HOA (Crystal Bay Mobile Home Club) with required approval; Monthly association fee $215; Association fee covers pool, grounds maintenance, management, private road, recreational facilities, sewer, trash and water; Community clubhouse, pool and recreation facilities including shuffleboard; Senior community; Pets allowed (cats and dogs) with max pet weight ~25 lbs; Golf carts allowed
Exterior
- Parking: Carport (1 space)
- Utilities: Public water; Public sewer; Cable available; High-speed internet available; Electricity connected
- Home design: Manufactured double wide; Residential property; Fixer condition; One level; Faces south; Entry on one level
- Construction: Vinyl siding with frame construction; Other roof type; Crawlspace foundation; Building area ~1,796 square feet; Living area ~984 square feet; Land area ~14.28 acres
- Exterior features: Storage; Asphalt road access
Interior
- Bedrooms: 2 bedrooms
- Flooring: Other flooring
- Bathrooms: 2 full bathrooms
- Heating & cooling: Central heating; Central air conditioning
- Interior features: Ceiling fans
- Laundry & utility: Laundry room; Dryer; Washer; Electric water heater
Neighborhood map
What this means for you Summary
Snapshot
- This is a 2-bed/2.0-bath manufactured listed at $80k.
Deal economics
- At list price, monthly cash flow is $278 ($3k/yr) — positive.
- The deal already cash-flows at list — no discount required.
- Meets the 1% rule at list price ($2k rent vs $80k).
- Recommended offer: $73k (9.0% below list) — sets the bar for market timing.
- Cap rate 16.9% vs local median 3.1% in Palm Harbor — top-decile yield for the area; either an underpriced asset or a hidden risk that comps aren't pricing in. Stress-test before assuming the spread holds.
Location & tenants
- Location reads 81/100 on livability (#95 in FL, #1,470 nationally) — a professional / high-income tenant draw. Strengths: schools A+, housing A+, commute A; Watch: amenities F.
- Pinellas (suburban): math 51% / reading 51% proficiency, ranked #31 of 73 in FL (top 42%) — acceptable for families but not a draw, mixed tenant base, ~2y average lease.
- Market conditions: Rents falling (-4.3%/yr); 387 active listings in the ZIP; 15 comparable units currently listed for rent nearby; rentals at typical pace (median 24d on market — plan ~3-4 weeks tenant-placement turnaround); solid renter incomes; 2,676 units permitted in Pinellas County in 2024 (1,422 in 5+ unit buildings).
Forward outlook
- Local home prices are declining (-3.0%/yr); year-one equity from $553 of loan paydown is wiped out by about $2k of value loss. Plan a longer hold.
- Pinellas County population projected at +14% by 2050 — modest demand growth; plan on rents tracking national, not racing it.
Negotiation context
- It's been on market 116 days — a 9% lower offer ($73k) is reasonable based on typical stale-listing flexibility.
- Current owner paid $24k; list at $80k implies a 233% gain — meaningful room to come down on a strong offer.
Risks & watch-outs
- Watch-outs: flood insurance adds $427/mo.
- Climate carrying-cost: in FEMA flood zone AE (mandatory federal flood insurance); severe wind risk, 99% chance of damaging wind over 30y; extreme-heat days projected 6→23/yr by 2055 (HVAC capex compounding) — expect insurance premiums to compound above CPI over the hold.
Questions for the listing agent
- It's been on market 116 days. Have you received any prior offers? Is the seller open to a 9% concession, seller financing, or rate buy-down credit?
- What's the actual annual flood-insurance premium (NFIP or private), and is the property in a SFHA with mandatory coverage?
- What does the HOA fee cover, when was the last increase, and are there any pending special assessments or reserve-fund shortfalls?
- Why hasn't it sold? Are there any deal-killer items the seller is aware of (foundation, flood, title, zoning, code violations)?
- Is there a deadline driving the sale (1031 exchange, divorce, estate, relocation)? That informs how much negotiation room exists.
- Schools are A-rated — typically a magnet for longer-tenancy family renters. What's the average tenant stay here, and is there a school-zone premium baked into asking?
- What's the average days-on-market for RENTAL listings here right now (not sales)? A rising rental-DOM trend means longer vacancies and softer asking-rent achievability than the comps imply.
- What's the recent tenant-quality profile in this submarket — average credit score on applications, eviction rate, late-payment / NSF rate, and stable-employment percentage? A property-management company in the area should have these aggregated.
- How much new for-sale + rental construction is in the pipeline within 1–3 miles? Heavy new supply typically softens prices + rents 12–24 months out; constrained supply supports both.
Investment metrics
- 1% rule
- 2.30% ✓
- Cap rate
- 16.86%
- Cash-on-cash
- 37.74%
- DSCR
- 2.68
- GRM
- 3.6
CMA / ARV
No comps found within radius.
Projected returns pro-forma
-3.0% appreciation · 0.0% rent growth · sell at horizon
- IRR
- -0.3%
- Equity multiple
- 0.99×
- Total profit
- $-245
- Equity at exit
- $11,928
- IRR
- 2.8%
- Equity multiple
- 1.15×
- Total profit
- $3,399
- Equity at exit
- $6,917
Cash invested: $22,400 (down + closing). Projections, not guarantees.
Landlord ↔ Tenant lean methodology
- Overall (STATE)
- 87 Strongly Landlord-Friendly
- State Florida
- 87 Strongly Landlord-Friendly · R+3
- County
- — inherits STATE
- City
- — inherits STATE
ZIP-level market 34683
- Rents YoY
- -4.3%
- Active inventory
- 387
- Price-to-rent
- 3.6×
Monthly cashflow live
- Estimated rent
- $1,841 high interval (Pro) →
- Mortgage (P&I)
- −$420
- Tax from tax record
- −$82 /mo · $986/yr
- Insurance
- −$33
- Flood insurance flood zone
- −$427 /mo · $5,118/yr
- HOA
- −$215
- Vacancy / Maint / Mgmt
- −$387
- Net cashflow
- $278
Break-even live
UW: 25.0% down · 7.5% · 30yr · 1.5% tax · 5.0% vac · 8.0% maint · 8.0% mgmt
Financing live
Cash to close
- Down payment
- $20,000
- Closing costs
- $2,400
- Reserves months
- —
- Total cash needed
- —
Loan-product check · same deal, 3 products live
Conventional
25% down · 7.5% · 30yr
- Down + closing
- —
- Monthly P&I
- —
- Monthly cashflow
- —
- DSCR
- —
- Eligible?
- —
Personal DTI + credit; lowest rate.
DSCR
20% down · 8.5% · 30yr
- Down + closing
- —
- Monthly P&I
- —
- Monthly cashflow
- —
- DSCR
- —
- Eligible?
- —
No personal income docs; deal must DSCR.
Hard money
10% down · 12.0% · 12mo
- Down + closing
- —
- Monthly P&I
- —
- Monthly cashflow
- —
- DSCR
- —
- Eligible?
- —
Short-term bridge; refi at stabilization.
Rent comps 15 comps
| Address | Beds | Baths | Sqft | Rent | $/sqft | DOM | Units | Dist |
|---|---|---|---|---|---|---|---|---|
| 1865 Orange Boulevard Way Palm Harbor, FL | 2.0 | 2.0 | 1000 | $1,950 | $1.95 | 24d | 1 | 0.40mi |
| 1825 Orange Boulevard Way Palm Harbor, FL | 2.0 | 2.0 | 1000 | $1,950 | $1.95 | 12d | 1 | 0.43mi |
| 1851 Orange Boulevard Way Palm Harbor, FL | 2.0 | 2.0 | 1000 | $1,750 | $1.75 | 24d | 1 | 0.44mi |
| 1833 Orange Boulevard Way Palm Harbor, FL | 2.0 | 2.0 | 1000 | $1,950 | $1.95 | 2d | 1 | 0.45mi |
| 508 Ulelah Ave Unit 2 Palm Harbor, FL | 1.0 | 1.0 | 576 | $1,650 | $2.86 | 17d | 1 | 0.65mi |
| 514 Ulelah Ave Palm Harbor, FL | 2.0 | 1.0 | 816 | $2,300 | $2.82 | 11d | 1 | 0.65mi |
| 514 Ulelah Ave Palm Harbor, FL | 2.0 | 1.0 | 816 | $2,300 | $2.82 | 4d | 1 | 0.65mi |
| 1328 Illinois Ave Palm Harbor, FL | 2.0 | 1.5 | 1000 | $1,700 | $1.70 | 24d | 1 | 1.13mi |
| 455 Alt 19 S #214 Palm Harbor, FL | 1.0 | 1.0 | 705 | $1,650 | $2.34 | 24d | 1 | 1.23mi |
| 455 Alt 19 S #54 Palm Harbor, FL | 2.0 | 2.0 | 898 | $1,600 | $1.78 | 4d | 1 | 1.23mi |
| 455 Alt 19 S #87 Palm Harbor, FL | 2.0 | 2.0 | 898 | $1,600 | $1.78 | 24d | 1 | 1.23mi |
| 455 Alt 19 S #65 Palm Harbor, FL | 1.0 | 1.0 | 705 | $1,425 | $2.02 | 24d | 1 | 1.23mi |
| 455 Alt 19 S #123 Palm Harbor, FL | 2.0 | 2.0 | 898 | $1,700 | $1.89 | 24d | 1 | 1.23mi |
| 455 Alt 19 Palm Harbor, FL | 1.0 | 1.0 | 563 | $1,450 | $2.58 | 24d | 1 | 1.23mi |
| 182 Margie St Palm Harbor, FL | 2.0 | 1.0 | 800 | $1,495 | $1.87 | 24d | 1 | 1.28mi |
HOA detail
- Monthly dues
- $215 · $2,580/yr
- Likely covers
- waterpool
Listing history 15 events
-
2026-06-18days on market $80,000 Active 116 DOM
-
2026-06-17days on market $80,000 Active 115 DOM
-
2026-06-16days on market $80,000 Active 114 DOM
-
2026-06-15days on market $80,000 Active 113 DOM
-
2026-06-13days on market $80,000 Active 111 DOM
-
2026-06-09days on market $80,000 Active 107 DOM
-
2026-06-08days on market $80,000 Active 106 DOM
-
2026-06-07days on market $80,000 Active 105 DOM
-
2026-06-04days on market $80,000 Active 102 DOM
-
2026-06-03days on market $80,000 Active 101 DOM
-
2026-06-01days on market $80,000 Active 99 DOM
-
2026-05-31days on market $80,000 Active 98 DOM
-
2026-04-24price $80,000
-
2026-02-22$90,000 Active
-
1998-09-09soldstatus $24,000
ⓘ Source: listings_history table (triggers on properties + properties_extension) + one-shot
backfill from property_details.listing_events for pre-trigger history.
Tax reassessment forecast FL · Resets to sale price
- Current annual tax
- $986 · $82/mo
- Projected year-2 tax
- $986 · $82/mo
- Expected delta
- $0/yr ($0/mo · 0.0%)
ⓘ Screening estimate from a state-policy table — verify with the county assessor before closing.
Climate risk First Street
- Flood 10/10 Extreme FEMA zone AE · 99% chance over 30 yrs
- Wildfire 1/10 Low
- Heat 10/10 Extreme 6 d/yr ≥108°F today · 23 d/yr by 30 yrs out
- Wind 10/10 Extreme 99% chance of damaging wind over 30 yrs
- Air quality 3/10 Moderate 3 unhealthy d/yr today · 3 by 30 yrs out
Nearby sold comps map
Loading sold comps map…
Walkable amenities ~0.75 mi
Loading nearby amenities…
Taxation est. · year 1
- Rental income
- $22,095
- − Mortgage interest
- −$4,481
- − Property taxes
- −$986
- − Insurance
- −$5,518
- − Repairs & maintenance
- −$1,768
- − Management
- −$1,768
- − HOA
- −$2,580
- − Depreciation
- −$2,327
- Taxable income
- $2,666
- Est. tax owed @ 24.0%
- −$640
- After-tax cash flow
- $2,696/yr
For passive investors: Depreciation is non-cash, so a rental often shows a tax loss while cash-flowing — sheltering income. Rental losses are passive: they offset passive income freely, and up to $25,000/yr can offset ordinary (W-2) income if you actively participate and your MAGI is under $100k (phasing out to $0 by $150k); unused losses carry forward. On sale, claimed depreciation is recaptured at up to 25%, and gains may owe capital-gains tax (a 1031 exchange can defer both). Figures are a year-1 estimate at your 24.0% rate — not tax advice; consult a CPA.
Schools (NCES district)
- District
- Pinellas
- NCES district ID
- 1201560
- Math proficiency
- 51% ▼ -5.00%
- Reading proficiency
- 51% ▼ -3.00%
- Median HH income
- $46,270
- Composite
- 43.27/100
- National rank
- #3046
- State rank
- #31 of 73 in FL
Livability — Palm Harbor
- Score
- 81/100
- State rank
- #95
- US rank
- #1470
Category grades
Schools grade is shown separately in the Schools card above.
Census & demographics
- Census place
- Palm Harbor, FL
- County
- Pinellas County · 939,478 people
- City population
- 79,072
- Metro
- Tampa-St. Petersburg-Clearwater, FL
- Population (ZIP)
- 33,911
- Household income
- $92,885
- Rent vs Own
- Severe rent burden
- 919.0
Population outlook (Pinellas County) Hauer SSP2
- Today (2025)
- 1,027,532 people
- By 2030
- 1,063,586 · +3.5%
- By 2040
- 1,125,020 · +9.5%
- By 2050
- 1,168,637 · +13.7%
- By 2075
- 1,265,188 · +23.1%
- By 2100
- 1,260,357 · +22.7%
Race, ethnicity, and origin ACS 2023
- Neighborhood character
- Predominantly White (85%)
- Race & ethnicity
- White 85% Hispanic / Latino 8% Two or more races 7% Asian 2% Black 1%
- Hispanic origin (detail)
- Mexican 2% Puerto Rican 2% Cuban 1%
- Common ancestry
- Romanian 5% Lithuanian 2% Slovak 2%
- Foreign-born
- 14% · Canada, China, Dominican Republic
- Languages at home
- 83% English-only · Spanish 5% Arabic 4% Russian/Polish/Slavic 3%
Political lean MEDSL · Pinellas
- 2024 margin
- Lean R (+5.2) · D 46.9% · R 52.1%
- 2008→2024 swing
- -13.5pp toward R · 2008: 8.3pp · 2024: -5.2pp
- All cycles
- 2024: R+5.2 2020: D+0.2 2016: R+1.1 2012: D+5.6 2008: D+8.3
Not yet ingested
- Civics
- —
Market trends
- HPI YoY
- ▼ -295.95%
- Current HPI
- 314.8777
- Rent YoY
- ▼ -4.33%
- Metro
- Tampa-St. Petersburg-Clearwater, FL
- State GDP YoY
- ▲ 3.28%
- F500 in state
- 36
Industry mix (Fortune 500 HQ in FL)
| Industry | F500 HQs | Revenue |
|---|---|---|
| Industrial Technology | 2 | $29B |
|
||
| Insurance | 2 | $17B |
|
||
| Retail | 1 | $60B |
|
||
| Technology Distribution | 1 | $58B |
|
||
| Homebuilding | 1 | $35B |
|
||
| Technology Manufacturing | 1 | $35B |
|
||
Price history
+233.3% since first listed3 events — show timeline
- 2026-04-24 Price Changed $80,000 Stellar MLS as Distributed by MLS Grid
- 2026-02-22 Listed $90,000 Stellar MLS as Distributed by MLS Grid
- 1998-09-09 Sold (Public Records) $24,000 Public Records
Property tax history
-2.8%/yrLatest (2025): $986 · -64.1% YoY. Source: county tax records.
Cash-flow waterfall
monthlySold comps — $/sqft
last 12 mo · ≤1 miLoading sold comps…