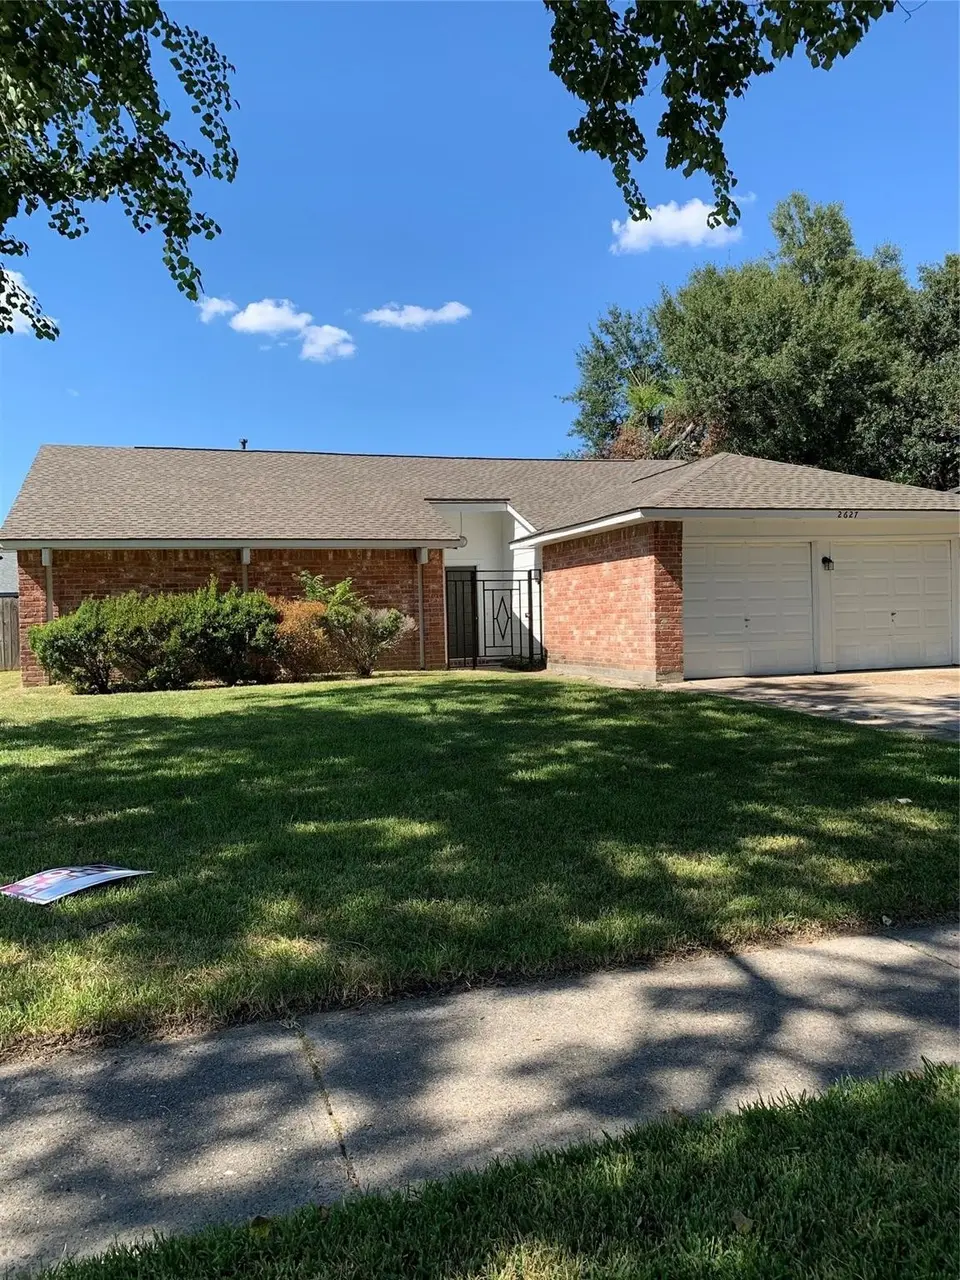
2627 N Spring Dr · Spring, TX
Flood risk 6/10 · Moderate
- FEMA flood zone
- X (unshaded)
- Chance of flooding over 30 yrs
- 0.68%
- Est. flood insurance / yr
- $507 – $1,088
Fire risk 3/10 · Minor
- Est. fire insurance / yr
- $1,222 – $2,270
Heat risk 9/10 · Severe
- Hot days now (above 110°F)
- 7 days/yr
- Hot days in 30 yrs
- 24 days/yr
Wind risk 8/10 · Major
- Chance of severe wind over 30 yrs
- 99.0%
Air-quality risk 3/10 · Minor
- Unhealthy air days now
- 3 days/yr
- Unhealthy air days in 30 yrs
- 3 days/yr
Risk factors via First Street. Map © Google.
Why this score? — see what drove the D+ grade
The composite is a weighted blend of 9 inputs, each scored 0–100. Each bar is that input's sub-score; the figure is the points it added to the 100-point composite (weight × sub-score).
- Cash flow +17.3/30.0
- ARV discount +10.2/15.0
- 1% rule +6.5/10.0
- DSCR +5.4/10.0
- Livability +3.3/5.0
- Condition / age +2.5/5.0
- Rent growth +2.4/5.0
- Schools +2.0/10.0
- Appreciation +0.0/10.0
$199,000
🖨 Deal sheet 📄 Offer letter ✓ Due diligence
Listing remarks MLS
Property is in middle of make ready. Paint on inside just refreshed, carpet put in April 18th, quartz countertops replaced April 1, Bathrooms updated April. Roof is 2022, electrical box update 7 years ago. Outside to get paint and replace rotted wood and decks..This house has lots of upgrades...Must See!!! Owner / agent
Key facts
- 7,230 sq ft lot
- 2 garage spots
- Community pool
Neighborhood map
What this means for you Summary
Snapshot
- This is a 3-bed/2.0-bath single-family listed at $199k.
Deal economics
- At list price, monthly cash flow is $147 ($2k/yr) — positive.
- The deal already cash-flows at list — no discount required.
- Meets the 1% rule at list price ($2k rent vs $199k).
- Recommended offer: $196k (1.5% below list) — sets the bar for market timing.
- Cap rate 7.2% vs local median 4.5% in Spring — top-decile yield for the area; either an underpriced asset or a hidden risk that comps aren't pricing in. Stress-test before assuming the spread holds.
Location & tenants
- Location reads 66/100 on livability (#635 in TX) — a middle-class / working-renter tenant base. Strengths: cost of living A+, housing A+, employment B; Watch: schools C-, crime D, amenities F.
- Spring ISD (suburban): math 19% / reading 26% proficiency, ranked #730 of 826 in TX (top 88%) — low school quality limits family demand, transient renter base, plan for 1-2y turnover; 66% free/reduced lunch — lower-income household profile, screen leases tightly.
- Market conditions: Rents soft (-0.3%/yr); 595 active listings in the ZIP; solid renter incomes; 29,883 units permitted in Harris County in 2024 (8,621 in 5+ unit buildings).
- This rent runs 31% of the median local income ($89k/yr) — at the standard rent-burdened threshold; future hikes will face affordability resistance.
Forward outlook
- Local home prices are declining (-3.0%/yr); year-one equity from $1k of loan paydown is wiped out by about $6k of value loss. Plan a longer hold.
- Harris County population projected at +47% by 2050 — long-run rental-demand tailwind backs the buy-and-hold thesis.
Negotiation context
- It's been on market 16 days — a 2% lower offer ($196k) is reasonable based on typical stale-listing flexibility.
- Current owner paid $69k; list at $199k implies a 187% gain — meaningful room to come down on a strong offer.
Risks & watch-outs
- Watch-outs: property tax is 3.1% of price.
- Climate carrying-cost: major flood risk; severe wind risk, 99% chance of damaging wind over 30y; extreme-heat days projected 7→24/yr by 2055 (HVAC capex compounding) — expect insurance premiums to compound above CPI over the hold.
Questions for the listing agent
- Property tax is high relative to price — has the assessment been appealed recently, and will the sale trigger a re-assessment?
- What does the HOA fee cover, when was the last increase, and are there any pending special assessments or reserve-fund shortfalls?
- Is there a deadline driving the sale (1031 exchange, divorce, estate, relocation)? That informs how much negotiation room exists.
- Crime grade is D in this area — have there been break-ins, vandalism, or insurance claims at this property in the last 3 years? What carrier currently insures it and at what premium?
- The area grade is low — what's the realistic commute time and amenity access for the typical tenant pool here? Any planned neighborhood developments (good or bad) we should know about?
- What's the average days-on-market for RENTAL listings here right now (not sales)? A rising rental-DOM trend means longer vacancies and softer asking-rent achievability than the comps imply.
- What's the recent tenant-quality profile in this submarket — average credit score on applications, eviction rate, late-payment / NSF rate, and stable-employment percentage? A property-management company in the area should have these aggregated.
- How much new for-sale + rental construction is in the pipeline within 1–3 miles? Heavy new supply typically softens prices + rents 12–24 months out; constrained supply supports both.
Investment metrics
- 1% rule
- 1.15% ✓
- Cap rate
- 7.18%
- Cash-on-cash
- 3.17%
- DSCR
- 1.14
- GRM
- 7.2
CMA / ARV
- ARV (median comp)
- $211,891
- List price
- $199,000
- Delta
- -6.08%
- Verdict
- FAIR
- Comps
- 20 within 1.0 mi
Show comp detail 6 sales within ~0.75 mi
| Address | Dist | Beds/Ba | Sqft | Sold | Price | $/sf | Match |
|---|---|---|---|---|---|---|---|
| 2514 Spring Day Ct | 0.20mi | 3/2.0 | 1,648 (-2%) | 10mo | $215,000 | $130 | 79 |
| 23715 Farm Hill Rd | 0.37mi | 3/2.0 | 1,660 (-2%) | 15mo | $189,000 | $114 | 68 |
| 23918 Spring Mill Ln | 0.31mi | 3/2.0 | 1,748 (+4%) | 21mo | $225,000 | $129 | 62 |
| 23803 Ironside Rd | 0.43mi | 3/2.5 | 1,822 (+8%) | 14mo | $250,000 | $137 | 53 |
| 23819 Creek Ridge Dr | 0.31mi | 4/3.0 (+1) | 1,878 (+12%) | 7mo | $210,000 | $112 | 52 |
| 23611 Blodgett Peak Trl | 0.66mi | 4/2.0 (+1) | 1,750 (+4%) | 24mo | $275,000 | $157 | 38 |
Match score weights: distance 35% · size 25% · config 20% · recency 20%. Top-matched comps best support the ARV.
Projected returns pro-forma
-3.0% appreciation · 0.0% rent growth · sell at horizon
- IRR
- -15.3%
- Equity multiple
- 0.47×
- Total profit
- $-29,384
- Equity at exit
- $29,672
- IRR
- -14.4%
- Equity multiple
- 0.31×
- Total profit
- $-38,614
- Equity at exit
- $17,206
Cash invested: $55,720 (down + closing). Projections, not guarantees.
Landlord ↔ Tenant lean methodology
- Overall (STATE)
- 87 Strongly Landlord-Friendly
- State Texas
- 87 Strongly Landlord-Friendly · R+5
- County
- — inherits STATE
- City
- — inherits STATE
ZIP-level market 77373
- Rents YoY
- -0.3%
- Active inventory
- 595
- Price-to-rent
- 7.2×
Monthly cashflow live
- Estimated rent
- $2,290 medium interval (Pro) →
- Mortgage (P&I)
- −$1,044
- Tax from tax record
- −$518 /mo · $6,216/yr
- Insurance
- −$83
- HOA
- −$18
- Vacancy / Maint / Mgmt
- −$481
- Net cashflow
- $147
Break-even live
UW: 25.0% down · 7.5% · 30yr · 1.5% tax · 5.0% vac · 8.0% maint · 8.0% mgmt
Financing live
Cash to close
- Down payment
- $49,750
- Closing costs
- $5,970
- Reserves months
- —
- Total cash needed
- —
Loan-product check · same deal, 3 products live
Conventional
25% down · 7.5% · 30yr
- Down + closing
- —
- Monthly P&I
- —
- Monthly cashflow
- —
- DSCR
- —
- Eligible?
- —
Personal DTI + credit; lowest rate.
DSCR
20% down · 8.5% · 30yr
- Down + closing
- —
- Monthly P&I
- —
- Monthly cashflow
- —
- DSCR
- —
- Eligible?
- —
No personal income docs; deal must DSCR.
Hard money
10% down · 12.0% · 12mo
- Down + closing
- —
- Monthly P&I
- —
- Monthly cashflow
- —
- DSCR
- —
- Eligible?
- —
Short-term bridge; refi at stabilization.
HOA detail
- Monthly dues
- $18 · $216/yr
- Likely covers
- electric
Listing history 5 events
-
2026-05-10$199,000 Active 322-char remark
Show marketing remark (322 chars)
Property is in middle of make ready. Paint on inside just refreshed, carpet put in April 18th, quartz countertops replaced April 1, Bathrooms updated April. Roof is 2022, electrical box update 7 years ago. Outside to get paint and replace rotted wood and decks..This house has lots of upgrades...Must See!!! Owner / agent
-
2026-04-20historical $199,000 322-char remark
Show marketing remark (322 chars)
Property is in middle of make ready. Paint on inside just refreshed, carpet put in April 18th, quartz countertops replaced April 1, Bathrooms updated April. Roof is 2022, electrical box update 7 years ago. Outside to get paint and replace rotted wood and decks..This house has lots of upgrades...Must See!!! Owner / agent
-
2003-07-22soldstatus
-
1999-03-08soldstatus
-
1992-11-01soldstatus $69,370
ⓘ Source: listings_history table (triggers on properties + properties_extension) + one-shot
backfill from property_details.listing_events for pre-trigger history.
Tax reassessment forecast TX · Resets to sale price
- Current annual tax
- $6,216 · $518/mo
- Projected year-2 tax
- $6,216 · $518/mo
- Expected delta
- $0/yr ($0/mo · 0.0%)
ⓘ Screening estimate from a state-policy table — verify with the county assessor before closing.
Climate risk First Street
- Flood 6/10 Major FEMA zone X (unshaded) · 68% chance over 30 yrs
- Wildfire 3/10 Moderate
- Heat 9/10 Extreme 7 d/yr ≥110°F today · 24 d/yr by 30 yrs out
- Wind 8/10 Severe 99% chance of damaging wind over 30 yrs
- Air quality 3/10 Moderate 3 unhealthy d/yr today · 3 by 30 yrs out
Nearby sold comps map
Loading sold comps map…
Walkable amenities ~0.75 mi
Loading nearby amenities…
Taxation est. · year 1
- Rental income
- $27,486
- − Mortgage interest
- −$11,147
- − Property taxes
- −$6,216
- − Insurance
- −$995
- − Repairs & maintenance
- −$2,199
- − Management
- −$2,199
- − HOA
- −$216
- − Depreciation
- −$5,789
- Taxable loss
- −$1,275
- Est. tax savings @ 24.0%
- +$306
- After-tax cash flow
- $2,070/yr
For passive investors: Depreciation is non-cash, so a rental often shows a tax loss while cash-flowing — sheltering income. Rental losses are passive: they offset passive income freely, and up to $25,000/yr can offset ordinary (W-2) income if you actively participate and your MAGI is under $100k (phasing out to $0 by $150k); unused losses carry forward. On sale, claimed depreciation is recaptured at up to 25%, and gains may owe capital-gains tax (a 1031 exchange can defer both). Figures are a year-1 estimate at your 24.0% rate — not tax advice; consult a CPA.
Schools (NCES district)
- District
- Spring ISD
- NCES district ID
- 4841220
- Math proficiency
- 19% ▼ -13.00%
- Reading proficiency
- 26% ▼ -6.00%
- Median HH income
- $51,584
- Composite
- 20.12/100
- National rank
- #8643
- State rank
- #730 of 826 in TX
Livability — Spring
- Score
- 66/100
- State rank
- #635
- US rank
- #12101
Category grades
Schools grade is shown separately in the Schools card above.
Census & demographics
- Census place
- Spring, TX
- County
- Harris County · 4,702,590 people
- City population
- 430,529
- Metro
- Houston-The Woodlands-Sugar Land, TX
- Population (ZIP)
- 69,739
- Household income
- $88,617
- Rent vs Own
- Severe rent burden
- 1050.0
Population outlook (Harris County) Hauer SSP2
- Today (2025)
- 5,571,493 people
- By 2030
- 6,089,821 · +9.3%
- By 2040
- 7,142,806 · +28.2%
- By 2050
- 8,185,864 · +46.9%
- By 2075
- 10,574,329 · +89.8%
- By 2100
- 12,109,958 · +117.4%
Race, ethnicity, and origin ACS 2023
- Neighborhood character
- Diverse neighborhood (Simpson 0.69)
- Race & ethnicity
- Hispanic / Latino 40% White 30% Black 23% Two or more races 22% Asian 3%
- Hispanic origin (detail)
- Mexican 27% Puerto Rican 2% Cuban 2% Dominican 2%
- Common ancestry
- Lithuanian 2% Italian 1% Slovak 1%
- Foreign-born
- 17% · Canada, Jamaica, Vietnam
- Languages at home
- 64% English-only · Spanish 32% Vietnamese 1% Other Indo-European 1%
Political lean MEDSL · Harris
- 2024 margin
- Lean D (+5.5) · D 52.0% · R 46.4% · Other 1.6%
- 2008→2024 swing
- +3.9pp toward D · 2008: 1.6pp · 2024: 5.5pp
- All cycles
- 2024: D+5.5 2020: D+13.3 2016: D+12.4 2012: D+0.1 2008: D+1.6
Not yet ingested
- Civics
- —
Market trends
- HPI YoY
- ▼ -142.98%
- Current HPI
- 251.7231
- Rent YoY
- ▼ -0.30%
- Metro
- Houston-The Woodlands-Sugar Land, TX
- State GDP YoY
- ▲ 3.95%
- F500 in state
- 110
Industry mix (Fortune 500 HQ in TX)
| Industry | F500 HQs | Revenue |
|---|---|---|
| Energy | 16 | $1,198B |
|
||
| Technology | 5 | $198B |
|
||
| Engineering / Construction | 4 | $72B |
|
||
| Energy Services | 3 | $60B |
|
||
| Utilities | 3 | $41B |
|
||
| Healthcare | 2 | $330B |
|
||
Price history
+186.9% since first listed5 events — show timeline
- 2026-05-10 Listed $199,000 HARMLS
- 2026-04-20 Coming Soon $199,000 HARMLS
- 2003-07-22 Sold (Public Records) — Public Records
- 1999-03-08 Sold (Public Records) — Public Records
- 1992-11-01 Sold (Public Records) $69,370 Public Records
Property tax history
+4.5%/yrLatest (2025): $6,216 · +12.1% YoY. Source: county tax records.
Cash-flow waterfall
monthlySold comps — $/sqft
last 12 mo · ≤1 miLoading sold comps…