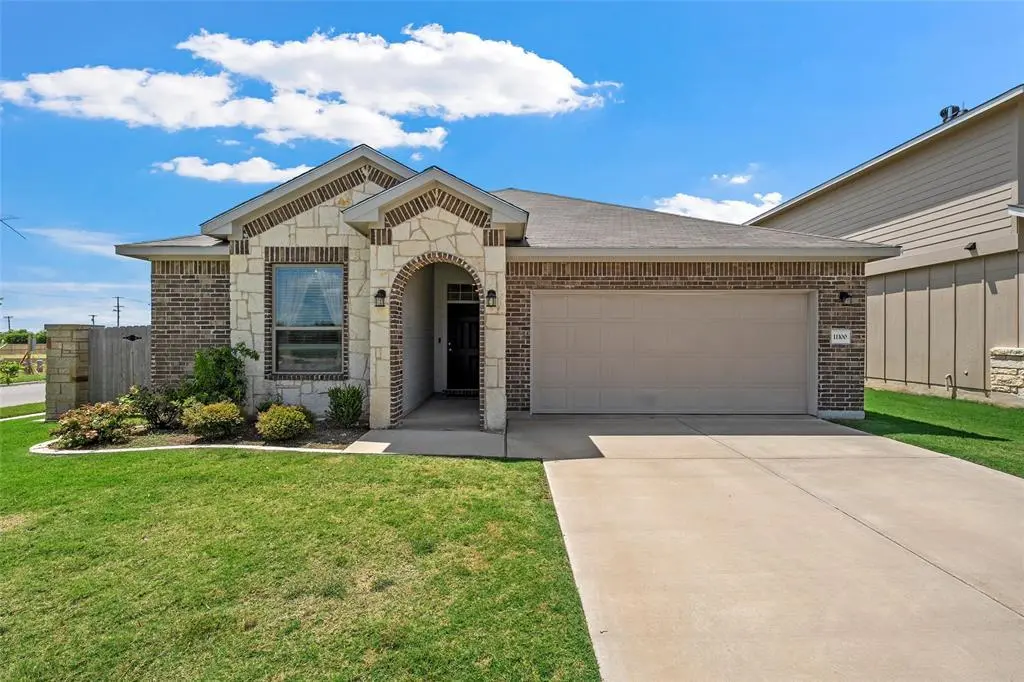
11100 Solar St · Waco, TX
Flood risk 1/10 · Minimal
- FEMA flood zone
- X (unshaded)
- Chance of flooding over 30 yrs
- 0.0%
- Est. flood insurance / yr
- $507 – $1,088
Fire risk 5/10 · Moderate
- Est. fire insurance / yr
- $1,222 – $2,270
Heat risk 7/10 · Major
- Hot days now (above 108°F)
- 7 days/yr
- Hot days in 30 yrs
- 24 days/yr
Wind risk 6/10 · Moderate
- Chance of severe wind over 30 yrs
- 77.0%
Air-quality risk 2/10 · Minimal
- Unhealthy air days now
- 0 days/yr
- Unhealthy air days in 30 yrs
- 1 days/yr
Risk factors via First Street. Map © Google.
Why this score? — see what drove the F grade
The composite is a weighted blend of 9 inputs, each scored 0–100. Each bar is that input's sub-score; the figure is the points it added to the 100-point composite (weight × sub-score).
- Cash flow +8.1/30.0
- ARV discount +7.5/15.0
- Schools +5.2/10.0
- Livability +3.7/5.0
- 1% rule +3.3/10.0
- Rent growth +2.5/5.0
- Condition / age +2.5/5.0
- DSCR +2.1/10.0
- Appreciation +0.0/10.0
$304,000
🖨 Deal sheet (PDF) 📄 Offer letter ✓ Due diligence
Listing remarks
This beautiful 2022, 4 bedroom, 2 bath home in the highly sought after Park Meadows community was built by Omega Builders, a recipient of the Silver Award in the National Housing Quality Awards in 2026. Designed with both comfort and functionality in mind, the home features a well thought out layout with three spacious bedrooms and an additional versatile room that can easily serve as a home office, workspace, or flex room. Step outside and enjoy the charm of a community focused neighborhood, complete with a nearby playground and a dedicated pedestrian path leading to a neighborhood park. Conveniently located within minutes of highly rated Midway ISD schools, major shopping centers, and loc
Key facts
- 7,623 sq ft lot
- 2 garage spots
- Built 2022
Property features AI
Finance
- Other: Subdivision: Park Meadows; County: McLennan
- Financial info: Accepts Cash, Conventional, FHA, VA loan
- HOA & community: Mandatory HOA; Annual association fee of $240; HOA covers grounds maintenance; HOA managed by Berkshire Hathaway
Exterior
- Parking: Attached 2-car garage; 2 covered parking spaces; Garage with garage door opener; garage faces front
- Security: Smoke detectors; Carbon monoxide detectors
- Utilities: City water; City sewer; Sidewalk (community); Not in a municipal utility district
- Home design: Single family residence; One story; Residential property
- Construction: Built in 2022; Shingle roof; Slab foundation
- Exterior features: Covered patio/porch; Sidewalks; Community mailbox; Jogging/bike path; Perimeter fencing
Interior
- Kitchen: Built-in gas range; Electric oven; Dishwasher; Microwave; Disposal; Electric water heater
- Bedrooms: 4 bedrooms (primary bedroom on level 1)
- Flooring: Carpet; Luxury vinyl plank
- Bathrooms: 2 full bathrooms
- Heating & cooling: Central heating (electric); Central air conditioning (electric); Ceiling fans; ENERGY STAR qualified equipment
- Interior features: Open floorplan; Vaulted ceilings; Kitchen island; Granite counters; Pantry; Walk-in closets; One living area; One dining area; Room count: 2
- Laundry & utility: Full-size washer/dryer area; Utility room; Electric dryer hookup
Neighborhood map
What this means for you Summary
Snapshot
- This is a 3-bed/2.0-bath single-family listed at $304k.
Deal economics
- At list price, monthly cash flow is $-296 ($-4k/yr) — negative.
- To cash-flow at today's rent, offer at most $252k (17.2% below list).
- To meet the 1% rule (rent ≥ 1% of price), the offer needs to be $252k (17.0% below list).
- Recommended offer: $252k (17.2% below list) — sets the bar for cash-flow.
- Cap rate 5.1% vs local median 3.9% in Waco — top-decile yield for the area; either an underpriced asset or a hidden risk that comps aren't pricing in. Stress-test before assuming the spread holds.
Location & tenants
- Location reads 74/100 on livability (#166 in TX, #4,378 nationally) — a middle-class / working-renter tenant base. Strengths: cost of living A+, housing A+, health & safety A+; Watch: crime D, commute F, employment D-.
- Midway ISD (other): math 61% / reading 58% proficiency, ranked #56 of 826 in TX (top 7%) — acceptable for families but not a draw, mixed tenant base, ~2y average lease.
- Zoned schools: Park Hill El (611 students, 43% FRL); Midway Middle (math 58% / reading 58%, grade B, #197 of 1,662 statewide, top 12%, 1,075 students, 47% FRL); Midway H S (math 66% / reading 67%, grade B, #186 of 1,632 statewide, top 11%, 2,648 students, 32% FRL).
- Market conditions: 269 active listings in the ZIP; 8 comparable units currently listed for rent nearby; rentals lingering (median 46d on market — plan ~5-8 weeks vacancy on turnover, expect pricing pressure); 75% of comp listings sitting > 30 days — soft ceiling on asking rent; solid renter incomes; 1,014 units permitted in McLennan County in 2024 (200 in 5+ unit buildings).
- This rent runs 30% of the median local income ($100k/yr) — at the standard rent-burdened threshold; future hikes will face affordability resistance.
Forward outlook
- Local home prices are declining (-3.0%/yr); year-one equity from $2k of loan paydown is wiped out by about $9k of value loss. Plan a longer hold.
- McLennan County population projected at +17% by 2050 — long-run rental-demand tailwind backs the buy-and-hold thesis.
Negotiation context
- Only 9 days on market — expect competitive offers; lowballing is unlikely to land.
Risks & watch-outs
- Climate carrying-cost: major wind risk, 77% chance of damaging wind over 30y; moderate wildfire risk; extreme-heat days projected 7→24/yr by 2055 (HVAC capex compounding) — expect insurance premiums to compound above CPI over the hold.
Questions for the listing agent
- What do current leases actually rent for vs. the listed asking? Can we see a recent rent roll and the last 12 months of T-12 income?
- What does the HOA fee cover, when was the last increase, and are there any pending special assessments or reserve-fund shortfalls?
- Is there a deadline driving the sale (1031 exchange, divorce, estate, relocation)? That informs how much negotiation room exists.
- Schools are D-rated, which usually means shorter tenancies and higher turnover. Who's the typical renter profile here, and what's been the actual vacancy rate?
- Crime grade is D in this area — have there been break-ins, vandalism, or insurance claims at this property in the last 3 years? What carrier currently insures it and at what premium?
- The area grade is low — what's the realistic commute time and amenity access for the typical tenant pool here? Any planned neighborhood developments (good or bad) we should know about?
- What's the average days-on-market for RENTAL listings here right now (not sales)? A rising rental-DOM trend means longer vacancies and softer asking-rent achievability than the comps imply.
- What's the recent tenant-quality profile in this submarket — average credit score on applications, eviction rate, late-payment / NSF rate, and stable-employment percentage? A property-management company in the area should have these aggregated.
- How much new for-sale + rental construction is in the pipeline within 1–3 miles? Heavy new supply typically softens prices + rents 12–24 months out; constrained supply supports both.
Investment metrics
- 1% rule
- 0.83% ✗
- Cap rate
- 5.13%
- Cash-on-cash
- -4.17%
- DSCR
- 0.81
- GRM
- 10.0
CMA / ARV
No comps found within radius.
Projected returns pro-forma
-3.0% appreciation · 3.0% rent growth · sell at horizon
- IRR
- -23.3%
- Equity multiple
- 0.20×
- Total profit
- $-67,930
- Equity at exit
- $45,327
- IRR
- -17.8%
- Equity multiple
- 0.03×
- Total profit
- $-82,765
- Equity at exit
- $26,284
Cash invested: $85,120 (down + closing). Projections, not guarantees.
Landlord ↔ Tenant lean methodology
- Overall (STATE)
- 87 Strongly Landlord-Friendly
- State Texas
- 87 Strongly Landlord-Friendly · R+5
- County
- — inherits STATE
- City
- — inherits STATE
ZIP-level market 76655
- Home prices YoY
- -31.3%
- Active inventory
- 269
- Price-to-rent
- 10.0×
Monthly cashflow live
- Estimated rent
- $2,524 high interval (Pro) →
- Mortgage (P&I)
- −$1,594
- Tax from tax record
- −$531 /mo · $6,366/yr
- Insurance
- −$127
- HOA
- −$38
- Vacancy / Maint / Mgmt
- −$530
- Net cashflow
- $-296
Break-even live
Sensitivity live
| Price | -10% $-123 | -5% $-209 | +0% $-296 | +5% $-382 | +10% $-468 |
|---|---|---|---|---|---|
| Rent | -10% $-495 | -5% $-395 | +0% $-296 | +5% $-196 | +10% $-96 |
| Rate | -1.0pp $-142 | -0.5pp $-218 | base $-296 | +0.5pp $-374 | +1.0pp $-454 |
UW: 25.0% down · 7.5% · 30yr · 1.5% tax · 5.0% vac · 8.0% maint · 8.0% mgmt
Financing live
Cash to close
- Down payment
- $76,000
- Closing costs
- $9,120
- Reserves months
- —
- Total cash needed
- —
Loan-product check · same deal, 3 products live
Conventional
25% down · 7.5% · 30yr
- Down + closing
- —
- Monthly P&I
- —
- Monthly cashflow
- —
- DSCR
- —
- Eligible?
- —
Personal DTI + credit; lowest rate.
DSCR
20% down · 8.5% · 30yr
- Down + closing
- —
- Monthly P&I
- —
- Monthly cashflow
- —
- DSCR
- —
- Eligible?
- —
No personal income docs; deal must DSCR.
Hard money
10% down · 12.0% · 12mo
- Down + closing
- —
- Monthly P&I
- —
- Monthly cashflow
- —
- DSCR
- —
- Eligible?
- —
Short-term bridge; refi at stabilization.
Rent comps 8 comps
| Address | Beds | Baths | Sqft | Rent | $/sqft | DOM | Units | Dist |
|---|---|---|---|---|---|---|---|---|
| 3217 Jackal Dr Lorena, TX | 4.0 | 2.0 | 1840 | $2,400 | $1.30 | 22d | 1 | 0.25mi |
| 3225 Marston Rd Lorena, TX | 4.0 | 2.0 | 1850 | $2,800 | $1.51 | 45d | 1 | 0.56mi |
| 3128 Brosnan Rd Lorena, TX | 3.0 | 2.0 | 1717 | $2,350 | $1.37 | 45d | 1 | 0.65mi |
| 2813 Gilchrist Dr Lorena, TX | 3.0 | 2.0 | 1529 | $2,200 | $1.44 | 45d | 1 | 0.65mi |
| 2809 Keathley Dr Lorena, TX | 3.0 | 2.0 | 1565 | $2,100 | $1.34 | 45d | 1 | 0.68mi |
| 3117 Sherco Rd Lorena, TX | 3.0 | 2.0 | 1469 | $2,000 | $1.36 | 45d | 1 | 0.74mi |
| 2701 Skinner Dr Lorena, TX | 3.0 | 2.0 | 1573 | $2,400 | $1.53 | 45d | 1 | 0.77mi |
| 10312 Sierra West Dr Waco, TX | 3.0 | 2.0 | 1560 | $2,300 | $1.47 | 22d | 1 | 0.88mi |
HOA detail
- Monthly dues
- $38 · $456/yr
Listing history 9 events
-
2026-06-21days on market $304,000 Active 9 DOM
-
2026-06-21days on market $304,000 Active 8 DOM
-
2026-06-18days on market $304,000 Active 6 DOM
-
2026-06-17days on market $304,000 Active 5 DOM
-
2026-06-16days on market $304,000 Active 4 DOM
-
2026-06-15days on market $304,000 Active 3 DOM
-
2026-06-15days on market $304,000 Active 2 DOM
-
2026-06-12remarks 699-char remark
-
2026-06-12$304,000 Active 1 DOM
ⓘ Source: listings_history table (triggers on properties + properties_extension) + one-shot
backfill from property_details.listing_events for pre-trigger history.
Tax reassessment forecast TX · Resets to sale price
- Current annual tax
- $6,366 · $531/mo
- Projected year-2 tax
- $6,366 · $531/mo
- Expected delta
- $0/yr ($0/mo · 0.0%)
ⓘ Screening estimate from a state-policy table — verify with the county assessor before closing.
Climate risk First Street
- Flood 1/10 Low FEMA zone X (unshaded) · 0% chance over 30 yrs
- Wildfire 5/10 Major
- Heat 7/10 Severe 7 d/yr ≥108°F today · 24 d/yr by 30 yrs out
- Wind 6/10 Major 77% chance of damaging wind over 30 yrs
- Air quality 2/10 Low 0 unhealthy d/yr today · 1 by 30 yrs out
Nearby sold comps map
Loading sold comps map…
Walkable amenities ~0.75 mi
Loading nearby amenities…
Taxation est. · year 1
- Rental income
- $30,287
- − Mortgage interest
- −$17,029
- − Property taxes
- −$6,366
- − Insurance
- −$1,520
- − Repairs & maintenance
- −$2,423
- − Management
- −$2,423
- − HOA
- −$456
- − Depreciation
- −$8,844
- Taxable loss
- −$8,774
- Est. tax savings @ 24.0%
- +$2,106
- After-tax cash flow
- $-1,441/yr
For passive investors: Depreciation is non-cash, so a rental often shows a tax loss while cash-flowing — sheltering income. Rental losses are passive: they offset passive income freely, and up to $25,000/yr can offset ordinary (W-2) income if you actively participate and your MAGI is under $100k (phasing out to $0 by $150k); unused losses carry forward. On sale, claimed depreciation is recaptured at up to 25%, and gains may owe capital-gains tax (a 1031 exchange can defer both). Figures are a year-1 estimate at your 24.0% rate — not tax advice; consult a CPA.
Schools (NCES district)
- District
- Midway ISD
- NCES district ID
- 4830640
- Math proficiency
- 61% ▼ -8.00%
- Reading proficiency
- 58% ▼ -7.00%
- Median HH income
- $67,076
- Composite
- 52.32/100
- National rank
- #1593
- State rank
- #56 of 826 in TX
Livability — Waco
- Score
- 74/100
- State rank
- #166
- US rank
- #4378
Category grades
Schools grade is shown separately in the Schools card above.
Census & demographics
- Census place
- Waco, TX
- County
- McLennan County · 213,088 people
- City population
- 125,319
- Metro
- Waco, TX
- Population (ZIP)
- 10,603
- Household income
- $99,917
- Rent vs Own
- Severe rent burden
- 62.0
Population outlook (McLennan County) Hauer SSP2
- Today (2025)
- 264,191 people
- By 2030
- 273,578 · +3.6%
- By 2040
- 291,506 · +10.3%
- By 2050
- 308,044 · +16.6%
- By 2075
- 349,648 · +32.3%
- By 2100
- 364,779 · +38.1%
Race, ethnicity, and origin ACS 2023
- Neighborhood character
- Predominantly White (76%)
- Race & ethnicity
- White 76% Hispanic / Latino 17% Two or more races 12% Black 3%
- Hispanic origin (detail)
- Mexican 14%
- Common ancestry
- Lithuanian 3% Slovak 3% Serbian 2%
- Foreign-born
- 2% · Canada
- Languages at home
- 93% English-only · Spanish 5% Arabic 2%
Political lean MEDSL · McLennan
- 2024 margin
- Solid R (+30.9) · D 34.0% · R 64.9% · Other 1.0%
- 2008→2024 swing
- -7.0pp toward R · 2008: -23.9pp · 2024: -30.9pp
- All cycles
- 2024: R+30.9 2020: R+23.4 2016: R+27.1 2012: R+29.8 2008: R+23.9
Not yet ingested
- Civics
- —
Market trends
- HPI YoY
- ▼ -105.10%
- Current HPI
- 230.4333
- Rent YoY
- —
- Metro
- Waco, TX
- State GDP YoY
- ▲ 3.95%
- F500 in state
- 110
Industry mix (Fortune 500 HQ in TX)
| Industry | F500 HQs | Revenue |
|---|---|---|
| Energy | 16 | $1,198B |
|
||
| Technology | 5 | $198B |
|
||
| Engineering / Construction | 4 | $72B |
|
||
| Energy Services | 3 | $60B |
|
||
| Utilities | 3 | $41B |
|
||
| Healthcare | 2 | $330B |
|
||
Price history
1 event — show timeline
- 2026-06-11 Listed $304,000 NTREIS
Property tax history
+93.3%/yrLatest (2025): $6,366 · -3.8% YoY. Source: county tax records.
Cash-flow waterfall
monthlySold comps — $/sqft
last 12 mo · ≤1 miLoading sold comps…