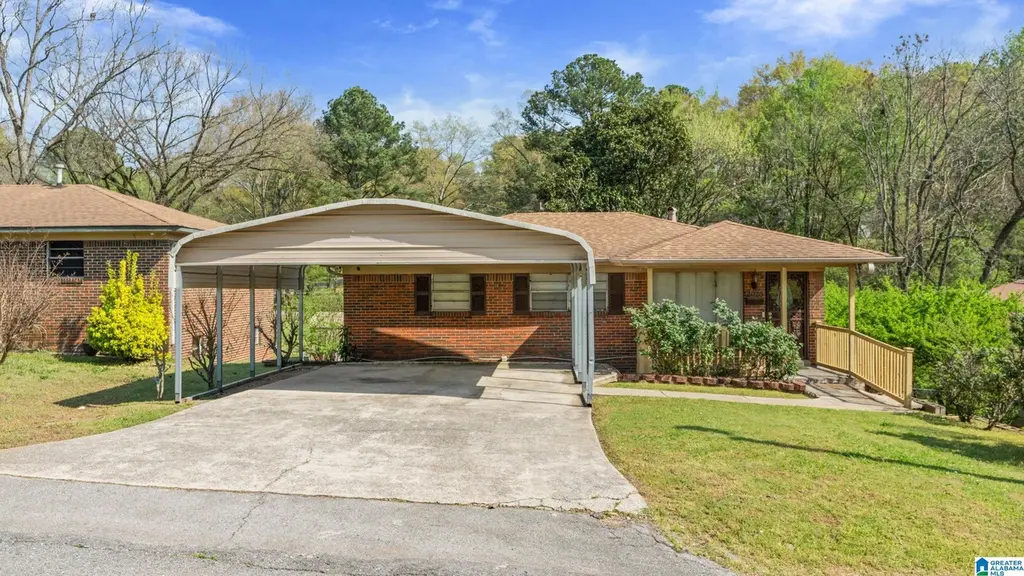
2025 Fairfax Ave · Bessemer, AL
Flood risk 7/10 · Major
- FEMA flood zone
- X (unshaded)
- Chance of flooding over 30 yrs
- 0.77%
- Est. flood insurance / yr
- $473 – $860
Fire risk 3/10 · Minor
- Est. fire insurance / yr
- $916 – $1,700
Heat risk 6/10 · Moderate
- Hot days now (above 108°F)
- 7 days/yr
- Hot days in 30 yrs
- 19 days/yr
Wind risk 6/10 · Moderate
- Chance of severe wind over 30 yrs
- 37.0%
Air-quality risk 3/10 · Minor
- Unhealthy air days now
- 2 days/yr
- Unhealthy air days in 30 yrs
- 5 days/yr
Risk factors via First Street. Map © Google.
Why this score? — see what drove the D+ grade
The composite is a weighted blend of 9 inputs, each scored 0–100. Each bar is that input's sub-score; the figure is the points it added to the 100-point composite (weight × sub-score).
- Cash flow +24.9/30.0
- DSCR +8.1/10.0
- 1% rule +5.6/10.0
- Livability +3.0/5.0
- Condition / age +2.5/5.0
- Rent growth +1.7/5.0
- Schools +0.8/10.0
- ARV discount +0.2/15.0
- Appreciation +0.0/10.0
$95,000
🖨 Deal sheet 📄 Offer letter ✓ Due diligence
Listing remarks MLS
This home has been well cared for and would make a great home or investment property for the right person. This home features a nice living room and a separate den that's great for entertaining. There is a finished basement that could be used at a 3rd bedroom. It also has a large oversized deck overlooking the huge fenced in backyard. The only thing missing is you. Schedule your showings today!
Key facts
- Oversized deck
- Fenced in backyard
- Finished basement
Tags
Property features AI
Finance
- Other: Lot size about 0.22 acres; Located in Bessemer subdivision
Exterior
- Parking: Driveway parking; 2-car carport
- Utilities: Public water; Connected sewer; Gas water heater; Spectrum internet available
- Home design: Existing single-family residence; 4-side brick construction
- Construction: Basement foundation; Daylight basement; 4-side brick exterior
- Exterior features: Open deck; No pool, patio, garden/patio, or waterfront
Interior
- Kitchen: Solid surface countertops; Refrigerator included
- Bedrooms: Two bedrooms on main level
- Flooring: Hardwood; Tile
- Bathrooms: One full bath with tub/shower combo
- Heating & cooling: Gas heat; Central cooling with window units
- Interior features: Hardwood and tile flooring; Ceilings: see remarks; Living area reported as 1,298 (per tax report); Main level living area indicated (per tax report); Full unfinished daylight basement (basement foundation); Pull-down attic; No additional interior features listed
- Laundry & utility: Laundry in basement; Washer hookup; Electric dryer hookup
Neighborhood map
What this means for you Summary
Snapshot
- This is a 2-bed/1.0-bath single-family listed at $95k.
Deal economics
- At list price, monthly cash flow is $148 ($2k/yr) — positive.
- The deal already cash-flows at list — no discount required.
- Meets the 1% rule at list price ($1k rent vs $95k).
- Cap rate 8.9% vs local median 5.9% in Bessemer — top-decile yield for the area; either an underpriced asset or a hidden risk that comps aren't pricing in. Stress-test before assuming the spread holds.
Location & tenants
- Location reads 59/100 on livability (#331 in AL) — a working-class tenant base; expect higher turnover. Strengths: commute A+, cost of living A+, housing A; Watch: crime F, amenities F, employment F.
- Bessemer City (suburban): math 3% / reading 19% proficiency, ranked #120 of 129 in AL (top 93%) — low school quality limits family demand, transient renter base, plan for 1-2y turnover; 87% free/reduced lunch — lower-income household profile, screen leases tightly.
- Zoned schools: Bessemer City High School (math 2% / reading 8%, grade F, #276 of 305 statewide, top 95%, 850 students, 61% FRL) — zoned schools average 61% FRL vs 87% district-wide (26 pts lower); this property's tenant base skews higher-income than the district average.
- Market conditions: Rents falling (-3.1%/yr); 115 active listings in the ZIP; 19 comparable units currently listed for rent nearby; rentals at typical pace (median 24d on market — plan ~3-4 weeks tenant-placement turnaround); 47% of comp listings sitting > 30 days — soft ceiling on asking rent; lower-income renter base — watch delinquency; 2,114 units permitted in Jefferson County in 2024 (556 in 5+ unit buildings).
- This rent runs 34% of the median local income ($35k/yr) — at the standard rent-burdened threshold; future hikes will face affordability resistance.
Forward outlook
- Local home prices are declining (-3.0%/yr); year-one equity from $657 of loan paydown is wiped out by about $3k of value loss. Plan a longer hold.
- Jefferson County population projected to shrink 4% by 2050 — rents likely to lag national; underwrite the cash flow, not the appreciation.
Negotiation context
- Only 11 days on market — expect competitive offers; lowballing is unlikely to land.
- 3 sale attempts since 3y ago with the ask held roughly flat each time — persistent listings suggest the price (not the market) is what's stuck; bring a comps-based counter.
Risks & watch-outs
- Watch-outs: flood insurance adds $56/mo.
- Climate carrying-cost: major flood risk; major wind risk, 37% chance of damaging wind over 30y; extreme-heat days projected 7→19/yr by 2055 (HVAC capex compounding) — expect insurance premiums to compound above CPI over the hold.
Questions for the listing agent
- Built in 1962 — when were the roof, HVAC, electrical panel, plumbing, and water heater last replaced?
- What's the actual annual flood-insurance premium (NFIP or private), and is the property in a SFHA with mandatory coverage?
- Is there a deadline driving the sale (1031 exchange, divorce, estate, relocation)? That informs how much negotiation room exists.
- Schools are D-rated, which usually means shorter tenancies and higher turnover. Who's the typical renter profile here, and what's been the actual vacancy rate?
- Crime grade is F in this area — have there been break-ins, vandalism, or insurance claims at this property in the last 3 years? What carrier currently insures it and at what premium?
- The area grade is low — what's the realistic commute time and amenity access for the typical tenant pool here? Any planned neighborhood developments (good or bad) we should know about?
- What's the average days-on-market for RENTAL listings here right now (not sales)? A rising rental-DOM trend means longer vacancies and softer asking-rent achievability than the comps imply.
- What's the recent tenant-quality profile in this submarket — average credit score on applications, eviction rate, late-payment / NSF rate, and stable-employment percentage? A property-management company in the area should have these aggregated.
- How much new for-sale + rental construction is in the pipeline within 1–3 miles? Heavy new supply typically softens prices + rents 12–24 months out; constrained supply supports both.
Investment metrics
- 1% rule
- 1.06% ✓
- Cap rate
- 8.87%
- Cash-on-cash
- 9.20%
- DSCR
- 1.41
- GRM
- 7.9
CMA / ARV
- ARV (on-the-fly)
- $81,774
- Comps found
- 10
Show comp detail 10 sales within ~0.75 mi
| Address | Dist | Beds/Ba | Sqft | Sold | Price | $/sf | Match |
|---|---|---|---|---|---|---|---|
| 1711 Holbrook Ave | 0.37mi | 3/2.0 (+1) | 1,300 (+0%) | 11mo | $124,000 | $95 | 65 |
| 419 19th St S | 0.20mi | 3/2.0 (+1) | 1,430 (+10%) | 1mo | $28,000 | $20 | 64 |
| 1607 Holbrook Ave | 0.45mi | 3/2.0 (+1) | 1,264 (-3%) | 5mo | $31,000 | $25 | 61 |
| 1625 Holbrook Ave | 0.42mi | 3/2.0 (+1) | 1,288 (-1%) | 14mo | $123,500 | $96 | 58 |
| 1615 Dartmouth Ave | 0.44mi | 3/1.0 (+1) | 1,186 (-9%) | 4mo | $47,500 | $40 | 56 |
| 1506 Avenue I | 0.52mi | 3/2.0 (+1) | 1,312 (+1%) | 12mo | $141,000 | $107 | 55 |
| 2232 Dartmouth Ave | 0.29mi | 3/1.0 (+1) | 1,176 (-9%) | 16mo | $79,900 | $68 | 52 |
| 2306 Clarendon Ave | 0.38mi | 3/2.0 (+1) | 1,492 (+15%) | 5mo | $10,000 | $7 | 44 |
| 2619 Exeter Ave | 0.54mi | 2/1.0 | 1,428 (+10%) | 17mo | $24,950 | $17 | 43 |
| 2831 Granville Ave | 0.74mi | 3/1.0 (+1) | 1,200 (-8%) | 19mo | $75,000 | $63 | 32 |
Match score weights: distance 35% · size 25% · config 20% · recency 20%. Top-matched comps best support the ARV.
Projected returns pro-forma
-3.0% appreciation · 0.0% rent growth · sell at horizon
- IRR
- -9.4%
- Equity multiple
- 0.67×
- Total profit
- $-8,879
- Equity at exit
- $14,165
- IRR
- -4.6%
- Equity multiple
- 0.74×
- Total profit
- $-6,915
- Equity at exit
- $8,214
Cash invested: $26,600 (down + closing). Projections, not guarantees.
Landlord ↔ Tenant lean methodology
- Overall (STATE)
- 90 Strongly Landlord-Friendly
- State Alabama
- 90 Strongly Landlord-Friendly · R+15
- County
- — inherits STATE
- City
- — inherits STATE
ZIP-level market 35020
- Home prices YoY
- -24.2%
- Rents YoY
- -3.1%
- Active inventory
- 115
- Price-to-rent
- 7.9×
Monthly cashflow live
- Estimated rent
- $1,006 high interval (Pro) →
- Mortgage (P&I)
- −$498
- Tax from tax record
- −$53 /mo · $637/yr
- Insurance
- −$40
- Flood insurance flood zone
- −$56 /mo · $666/yr
- HOA
- −$0
- Vacancy / Maint / Mgmt
- −$211
- Net cashflow
- $148
Break-even live
UW: 25.0% down · 7.5% · 30yr · 1.5% tax · 5.0% vac · 8.0% maint · 8.0% mgmt
Financing live
Cash to close
- Down payment
- $23,750
- Closing costs
- $2,850
- Reserves months
- —
- Total cash needed
- —
Loan-product check · same deal, 3 products live
Conventional
25% down · 7.5% · 30yr
- Down + closing
- —
- Monthly P&I
- —
- Monthly cashflow
- —
- DSCR
- —
- Eligible?
- —
Personal DTI + credit; lowest rate.
DSCR
20% down · 8.5% · 30yr
- Down + closing
- —
- Monthly P&I
- —
- Monthly cashflow
- —
- DSCR
- —
- Eligible?
- —
No personal income docs; deal must DSCR.
Hard money
10% down · 12.0% · 12mo
- Down + closing
- —
- Monthly P&I
- —
- Monthly cashflow
- —
- DSCR
- —
- Eligible?
- —
Short-term bridge; refi at stabilization.
Rent comps 19 comps
| Address | Beds | Baths | Sqft | Rent | $/sqft | DOM | Units | Dist |
|---|---|---|---|---|---|---|---|---|
| 1909 Holbrook Ave Bessemer, AL | 2.0 | 1.0 | 1064 | $930 | $0.87 | 44d | 1 | 0.20mi |
| 419 19th St S Bessemer, AL | 3.0 | 2.0 | 1200 | $1,050 | $0.88 | 12d | 1 | 0.20mi |
| 1830 Exeter Ave Bessemer, AL | 2.0 | 1.0 | 913 | $850 | $0.93 | 44d | 1 | 0.21mi |
| 420 19th St S Bessemer, AL | 2.0 | 1.0 | 910 | $850 | $0.93 | 44d | 1 | 0.23mi |
| 1622 Fairfax Ave Bessemer, AL | 2.0 | 2.0 | 1104 | $995 | $0.90 | 2d | 1 | 0.36mi |
| 1600 Holbrook Ave Bessemer, AL | 3.0 | 1.0 | 885 | $999 | $1.13 | 2d | 1 | 0.42mi |
| 320 16th St S Bessemer, AL | 3.0 | 1.5 | 1792 | $950 | $0.53 | 44d | 1 | 0.50mi |
| 931 Dartmouth Ave Bessemer, AL | 3.0 | 1.0 | 984 | $925 | $0.94 | 44d | 1 | 1.00mi |
| 810 Fairfax Ave Bessemer, AL | 3.0 | 1.0 | 1042 | $1,050 | $1.01 | 24d | 1 | 1.11mi |
| 808 Fairfax Ave Bessemer, AL | 3.0 | 1.0 | 1042 | $1,050 | $1.01 | 24d | 1 | 1.12mi |
| 3216 Avenue B Unit B Bessemer, AL | 3.0 | 2.0 | 1220 | $1,100 | $0.90 | 44d | 1 | 1.17mi |
| 719 16th St N Bessemer, AL | 3.0 | 1.5 | 1085 | $1,075 | $0.99 | 24d | 1 | 1.23mi |
| 3230 Arlington Ave Bessemer, AL | 2.0 | 2.0 | 1236 | $795 | $0.64 | 44d | 1 | 1.24mi |
| 704 Avenue I Bessemer, AL | 3.0 | 1.0 | 1232 | $1,200 | $0.97 | 24d | 1 | 1.24mi |
| 817 15th St N Bessemer, AL | 3.0 | 2.0 | 1116 | $1,125 | $1.01 | 3d | 1 | 1.34mi |
| 3225 4th Ave N Bessemer, AL | 3.0 | 2.0 | 1486 | $1,300 | $0.87 | 24d | 1 | 1.40mi |
| 3019 7th Ave N Bessemer, AL | 3.0 | 1.0 | 1080 | $1,050 | $0.97 | 44d | 1 | 1.42mi |
| 830 5th Ave N Bessemer, AL | 3.0 | 1.0 | 1072 | $1,000 | $0.93 | 44d | 1 | 1.42mi |
| 806 4th Ave N Bessemer, AL | 3.0 | 1.0 | 1092 | $1,050 | $0.96 | 24d | 1 | 1.43mi |
Listing history 9 events
-
2026-06-18days on market $95,000 Active 11 DOM
-
2026-06-17days on market $95,000 Active 10 DOM
-
2026-06-16days on market $95,000 Active 9 DOM
-
2026-06-15days on market $95,000 Active 8 DOM
-
2026-06-13days on market $95,000 Active 6 DOM
-
2026-06-10days on market $95,000 Active 3 DOM
-
2026-06-09days on market $95,000 Active 2 DOM
-
2026-06-07remarks 397-char remark
-
2026-06-07$95,000 Active 1 DOM
ⓘ Source: listings_history table (triggers on properties + properties_extension) + one-shot
backfill from property_details.listing_events for pre-trigger history.
Tax reassessment forecast AL · Resets to sale price
- Current annual tax
- $637 · $53/mo
- Projected year-2 tax
- $637 · $53/mo
- Expected delta
- $0/yr ($0/mo · 0.0%)
ⓘ Screening estimate from a state-policy table — verify with the county assessor before closing.
Climate risk First Street
- Flood 7/10 Severe FEMA zone X (unshaded) · 77% chance over 30 yrs
- Wildfire 3/10 Moderate
- Heat 6/10 Major 7 d/yr ≥108°F today · 19 d/yr by 30 yrs out
- Wind 6/10 Major 37% chance of damaging wind over 30 yrs
- Air quality 3/10 Moderate 2 unhealthy d/yr today · 5 by 30 yrs out
Nearby sold comps map
Loading sold comps map…
Walkable amenities ~0.75 mi
Loading nearby amenities…
Taxation est. · year 1
- Rental income
- $12,073
- − Mortgage interest
- −$5,321
- − Property taxes
- −$637
- − Insurance
- −$1,142
- − Repairs & maintenance
- −$966
- − Management
- −$966
- − Depreciation
- −$2,764
- Taxable income
- $278
- Est. tax owed @ 24.0%
- −$67
- After-tax cash flow
- $1,715/yr
For passive investors: Depreciation is non-cash, so a rental often shows a tax loss while cash-flowing — sheltering income. Rental losses are passive: they offset passive income freely, and up to $25,000/yr can offset ordinary (W-2) income if you actively participate and your MAGI is under $100k (phasing out to $0 by $150k); unused losses carry forward. On sale, claimed depreciation is recaptured at up to 25%, and gains may owe capital-gains tax (a 1031 exchange can defer both). Figures are a year-1 estimate at your 24.0% rate — not tax advice; consult a CPA.
Schools (NCES district)
- District
- Bessemer City
- NCES district ID
- 0100330
- Math proficiency
- 3% ▼ -18.00%
- Reading proficiency
- 19% ▼ -3.00%
- Median HH income
- $29,721
- Composite
- 8.45/100
- National rank
- #9905
- State rank
- #120 of 129 in AL
Livability — Bessemer
- Score
- 59/100
- State rank
- #331
- US rank
- #20078
Category grades
Schools grade is shown separately in the Schools card above.
Census & demographics
- Census place
- Bessemer, AL
- County
- Jefferson County · 527,445 people
- City population
- 48,018
- Metro
- Birmingham-Hoover, AL
- Population (ZIP)
- 24,892
- Household income
- $35,362
- Rent vs Own
- Severe rent burden
- 1001.0
Population outlook (Jefferson County) Hauer SSP2
- Today (2025)
- 669,185 people
- By 2030
- 669,694 · +0.1%
- By 2040
- 661,388 · -1.2%
- By 2050
- 643,086 · -3.9%
- By 2075
- 577,267 · -13.7%
- By 2100
- 474,758 · -29.1%
Race, ethnicity, and origin ACS 2023
- Neighborhood character
- Predominantly Black (74%)
- Race & ethnicity
- Black 74% Hispanic / Latino 13% White 11% Two or more races 6%
- Hispanic origin (detail)
- Mexican 10%
- Foreign-born
- 5% · Canada
- Languages at home
- 89% English-only · Spanish 11%
Political lean MEDSL · Jefferson
- 2024 margin
- D (+10.4) · D 54.6% · R 44.2% · Other 1.2%
- 2008→2024 swing
- +5.4pp toward D · 2008: 5.1pp · 2024: 10.4pp
- All cycles
- 2024: D+10.4 2020: D+13.2 2016: D+7.2 2012: D+6.0 2008: D+5.1
Not yet ingested
- Civics
- —
Market trends
- HPI YoY
- ▼ -57.54%
- Current HPI
- 179.7702
- Rent YoY
- ▼ -3.12%
- Metro
- Birmingham-Hoover, AL
- State GDP YoY
- ▲ 2.94%
- F500 in state
- 4
Industry mix (Fortune 500 HQ in AL)
| Industry | F500 HQs | Revenue |
|---|---|---|
| Financial Services | 1 | $8B |
|
||
| Healthcare | 1 | $5B |
|
||
Price history
+178.6% since first listed8 events — show timeline
- 2026-06-07 Listed $95,000 Greater Alabama MLS
- 2023-06-07 Sold (Public Records) $85,000 Public Records
- 2023-06-06 Sold (MLS) $85,000 Greater Alabama MLS
- 2023-05-05 Pending — Greater Alabama MLS
- 2023-04-30 Relisted — Greater Alabama MLS
- 2023-03-31 Pending — Greater Alabama MLS
- 2023-02-24 Listed $85,000 Greater Alabama MLS
- 1979-01-26 Sold (Public Records) $34,100 Public Records
Property tax history
+5.0%/yrLatest (2025): $637 · +5.9% YoY. Source: county tax records.
Cash-flow waterfall
monthlySold comps — $/sqft
last 12 mo · ≤1 miLoading sold comps…