130 Oak Grv · Oroville East, CA
Flood risk 1/10 · Minimal
- FEMA flood zone
- X (unshaded)
- Chance of flooding over 30 yrs
- 0.0%
- Est. flood insurance / yr
- $507 – $1,088
Fire risk 10/10 · Severe
- Est. fire insurance / yr
- $659 – $1,223
Heat risk 7/10 · Major
- Hot days now (above 102°F)
- 7 days/yr
- Hot days in 30 yrs
- 17 days/yr
Wind risk 1/10 · Minimal
- Chance of severe wind over 30 yrs
- —
Air-quality risk 10/10 · Severe
- Unhealthy air days now
- 29 days/yr
- Unhealthy air days in 30 yrs
- 36 days/yr
Risk factors via First Street. Map © Google.
Why this score? — see what drove the B- grade
The composite is a weighted blend of 9 inputs, each scored 0–100. Each bar is that input's sub-score; the figure is the points it added to the 100-point composite (weight × sub-score).
- Cash flow +30.0/30.0
- DSCR +10.0/10.0
- 1% rule +8.7/10.0
- ARV discount +7.5/15.0
- Schools +2.8/10.0
- Livability +2.6/5.0
- Rent growth +2.5/5.0
- Condition / age +2.5/5.0
- Appreciation +0.0/10.0
$134,500
🖨 Deal sheet 📄 Offer letter ✓ Due diligence
Listing remarks
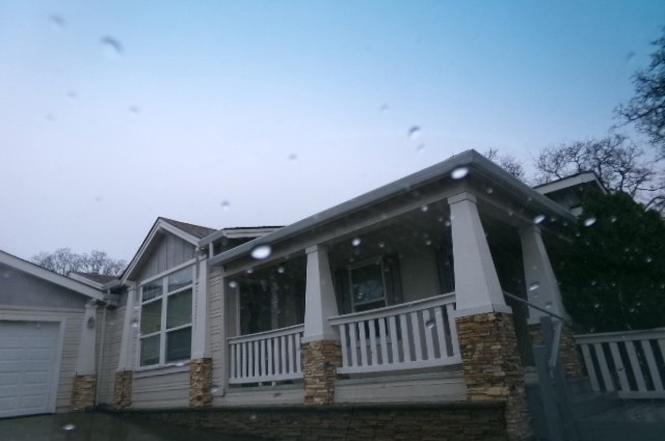
Large home with attached garage. Home in good condition. Covered deck in front and small deck on side. Lots of parking area. New dishwasher and new garage door opener. Seller in process of getting roof bids. Buyer must qualify with park after accepted offer. Seller would like Timos Title- Tamara.
Key facts
- Covered deck
- Attached garage
- 2 garage spots
Tags
Property features AI
Finance
- Other: Lot described as 0-1 unit per acre; Elevation measured in feet
- Financial info: Monthly land lease: $820
- HOA & community: Senior community (Oaks Senior Park); Manager approval required; Land lease in place
Exterior
- Parking: Attached 2-car garage; 2 total parking spaces
- Utilities: Sewer paid; Public/district water
- Home design: Single-story mobile home (double body); Mobile home remains on site; Mobile dimensions approximately 30 ft wide by 61 ft long
- Construction: Year built per public records; Construction details from assessor's data
- Exterior features: Community pool; Rural setting with biking, fishing and lake nearby
Interior
- Bedrooms: Single-level bedrooms (home has 1 story)
- Bathrooms: 2 full bathrooms
- Interior features: Entry on first level
- Laundry & utility: Inside laundry
Neighborhood map
What this means for you Summary
Snapshot
- This is a 3-bed/1.5-bath manufactured listed at $134k.
Deal economics
- At list price, monthly cash flow is $553 ($7k/yr) — positive.
- The deal already cash-flows at list — no discount required.
- Meets the 1% rule at list price ($2k rent vs $134k).
- Recommended offer: $118k (12.0% below list) — sets the bar for market timing.
- Cap rate 11.2% vs local median 3.4% in Oroville East — top-decile yield for the area; either an underpriced asset or a hidden risk that comps aren't pricing in. Stress-test before assuming the spread holds.
Location & tenants
- Location reads 51/100 on livability (#1,082 in CA) — a working-class tenant base; expect higher turnover. Strengths: housing A+, employment A-; Watch: schools F, crime F, amenities F.
- Oroville Union High (town): math 19% / reading 49% proficiency, ranked #300 of 517 in CA (top 58%) — families likely to look elsewhere, expect single-tenant / working-renter base with shorter leases.
- Market conditions: 372 active listings in the ZIP; 2 comparable units currently listed for rent nearby; 946 units permitted in Butte County in 2024 (254 in 5+ unit buildings).
- This rent runs 34% of the median local income ($66k/yr) — at the standard rent-burdened threshold; future hikes will face affordability resistance.
Forward outlook
- Local home prices are declining (-3.0%/yr); year-one equity from $930 of loan paydown is wiped out by about $4k of value loss. Plan a longer hold.
- Butte County population projected at +10% by 2050 — modest demand growth; plan on rents tracking national, not racing it.
- At projected returns (-3.0% appreciation + 3.0% rent growth), your $38k cash investment doubles in ~7 years — after that, you're playing with house money.
Negotiation context
- It's been on market 580 days — a 12% lower offer ($118k) is reasonable based on typical stale-listing flexibility.
- 4 sale attempts since 3y ago; this cycle's ask has dropped $20k (13%) from the opening price — seller is motivated, your offer sets the floor, not the list.
Risks & watch-outs
- Climate carrying-cost: severe wildfire risk; extreme-heat days projected 7→17/yr by 2055 (HVAC capex compounding) — expect insurance premiums to compound above CPI over the hold.
Questions for the listing agent
- It's been on market 580 days. Have you received any prior offers? Is the seller open to a 12% concession, seller financing, or rate buy-down credit?
- Why hasn't it sold? Are there any deal-killer items the seller is aware of (foundation, flood, title, zoning, code violations)?
- Is there a deadline driving the sale (1031 exchange, divorce, estate, relocation)? That informs how much negotiation room exists.
- Schools are F-rated, which usually means shorter tenancies and higher turnover. Who's the typical renter profile here, and what's been the actual vacancy rate?
- Crime grade is F in this area — have there been break-ins, vandalism, or insurance claims at this property in the last 3 years? What carrier currently insures it and at what premium?
- What's the average days-on-market for RENTAL listings here right now (not sales)? A rising rental-DOM trend means longer vacancies and softer asking-rent achievability than the comps imply.
- What's the recent tenant-quality profile in this submarket — average credit score on applications, eviction rate, late-payment / NSF rate, and stable-employment percentage? A property-management company in the area should have these aggregated.
- How much new for-sale + rental construction is in the pipeline within 1–3 miles? Heavy new supply typically softens prices + rents 12–24 months out; constrained supply supports both.
Investment metrics
- 1% rule
- 1.37% ✓
- Cap rate
- 11.22%
- Cash-on-cash
- 17.61%
- DSCR
- 1.78
- GRM
- 6.1
CMA / ARV
- ARV (on-the-fly)
- $43,152
- Comps found
- 11
Show comp detail 11 sales within ~0.75 mi
| Address | Dist | Beds/Ba | Sqft | Sold | Price | $/sf | Match |
|---|---|---|---|---|---|---|---|
| 145 Oak Grv | 0.11mi | 2/2.0 (-1) | 1,440 (+3%) | 6mo | $30,000 | $21 | 78 |
| 431 Summerwood | 0.11mi | 3/2.0 | 1,378 (-1%) | 21mo | $126,500 | $92 | 73 |
| 200 Creekside | 0.22mi | 3/2.0 | 1,352 (-3%) | 21mo | $90,000 | $67 | 65 |
| 108 Oak grove Pkwy #108 | 0.19mi | 2/2.0 (-1) | 1,440 (+3%) | 18mo | $32,900 | $23 | 64 |
| 140 Oak Grove Pkwy #140 | 0.05mi | 3/2.0 | 1,536 (+10%) | 18mo | $39,000 | $25 | 64 |
| 216 Rim Canyon Pkwy | 0.26mi | 2/2.0 (-1) | 1,488 (+7%) | 8mo | $52,000 | $35 | 62 |
| 140 Oak Grove Pkwy | 0.09mi | 3/2.0 | 1,536 (+10%) | 18mo | $39,000 | $25 | 62 |
| 248 Rim Canyon Pkwy | 0.28mi | 2/2.0 (-1) | 1,440 (+3%) | 19mo | $45,000 | $31 | 58 |
| 401 Stoneridge | 0.14mi | 3/2.0 | 1,568 (+13%) | 15mo | $99,500 | $63 | 58 |
| 429 Summerwood Pkwy | 0.10mi | 3/2.0 | 1,581 (+14%) | 16mo | $125,000 | $79 | 57 |
| 315 Ridgecrest | 0.19mi | 2/2.0 (-1) | 1,250 (-10%) | 22mo | $35,000 | $28 | 48 |
Match score weights: distance 35% · size 25% · config 20% · recency 20%. Top-matched comps best support the ARV.
Projected returns pro-forma
-3.0% appreciation · 3.0% rent growth · sell at horizon
- IRR
- 9.1%
- Equity multiple
- 1.36×
- Total profit
- $13,420
- Equity at exit
- $20,054
- IRR
- 18.2%
- Equity multiple
- 2.52×
- Total profit
- $57,069
- Equity at exit
- $11,629
Cash invested: $37,660 (down + closing). Projections, not guarantees.
Landlord ↔ Tenant lean methodology
- Overall (STATE)
- 18 Strongly Tenant-Friendly
- State California
- 18 Strongly Tenant-Friendly · D+13
- County
- — inherits STATE
- City
- — inherits STATE
ZIP-level market 95966
- Active inventory
- 372
- Price-to-rent
- 6.1×
Monthly cashflow live
- Estimated rent
- $1,847 medium interval (Pro) →
- Mortgage (P&I)
- −$705
- Tax from tax record
- −$145 /mo · $1,737/yr
- Insurance
- −$56
- HOA
- −$0
- Vacancy / Maint / Mgmt
- −$388
- Net cashflow
- $553
Break-even live
UW: 25.0% down · 7.5% · 30yr · 1.5% tax · 5.0% vac · 8.0% maint · 8.0% mgmt
Financing live
Cash to close
- Down payment
- $33,625
- Closing costs
- $4,035
- Reserves months
- —
- Total cash needed
- —
Loan-product check · same deal, 3 products live
Conventional
25% down · 7.5% · 30yr
- Down + closing
- —
- Monthly P&I
- —
- Monthly cashflow
- —
- DSCR
- —
- Eligible?
- —
Personal DTI + credit; lowest rate.
DSCR
20% down · 8.5% · 30yr
- Down + closing
- —
- Monthly P&I
- —
- Monthly cashflow
- —
- DSCR
- —
- Eligible?
- —
No personal income docs; deal must DSCR.
Hard money
10% down · 12.0% · 12mo
- Down + closing
- —
- Monthly P&I
- —
- Monthly cashflow
- —
- DSCR
- —
- Eligible?
- —
Short-term bridge; refi at stabilization.
Rent comps 2 comps
| Address | Beds | Baths | Sqft | Rent | $/sqft | DOM | Units | Dist |
|---|---|---|---|---|---|---|---|---|
| 5560 Old Olive Hwy Oroville, CA | 3.0 | 1.0 | 950 | $1,600 | $1.68 | 13d | 1 | 0.79mi |
| 5580 Old Olive Hwy Oroville, CA | 3.0 | 1.0 | 1000 | $1,500 | $1.50 | 13d | 1 | 0.87mi |
Listing history 25 events
-
2026-06-19days on market $134,500 Active 580 DOM
-
2026-06-18days on market $134,500 Active 579 DOM
-
2026-06-17days on market $134,500 Active 578 DOM
-
2026-06-16days on market $134,500 Active 577 DOM
-
2026-06-15days on market $134,500 Active 576 DOM
-
2026-06-14days on market $134,500 Active 574 DOM
-
2026-06-13days on market $134,500 Active 573 DOM
-
2026-06-10days on market $134,500 Active 571 DOM
-
2026-06-09days on market $134,500 Active 570 DOM
-
2026-06-08days on market $134,500 Active 569 DOM
-
2026-06-07days on market $134,500 Active 568 DOM
-
2026-06-03days on market $134,500 Active 564 DOM
-
2026-06-02days on market $134,500 Active 563 DOM
-
2026-06-01days on market $134,500 Active 562 DOM
-
2026-05-31days on market $134,500 Active 561 DOM
-
2026-05-30days on market $134,500 Active 560 DOM
-
2026-03-14price $134,500
-
2025-03-13status Active
-
2025-03-11status Pending Sale
-
2025-01-18price $139,500
-
2024-11-14$155,000 Active
-
2024-11-09historical
-
2024-09-10$155,000 Active
-
2023-08-21historical
-
2023-04-14$189,900 Active
ⓘ Source: listings_history table (triggers on properties + properties_extension) + one-shot
backfill from property_details.listing_events for pre-trigger history.
Tax reassessment forecast CA · Resets to sale price
- Current annual tax
- $1,737 · $145/mo
- Projected year-2 tax
- $1,737 · $145/mo
- Expected delta
- $0/yr ($0/mo · 0.0%)
ⓘ Screening estimate from a state-policy table — verify with the county assessor before closing.
Climate risk First Street
- Flood 1/10 Low FEMA zone X (unshaded) · 0% chance over 30 yrs
- Wildfire 10/10 Extreme
- Heat 7/10 Severe 7 d/yr ≥102°F today · 17 d/yr by 30 yrs out
- Wind 1/10 Low
- Air quality 10/10 Extreme 29 unhealthy d/yr today · 36 by 30 yrs out
Nearby sold comps map
Loading sold comps map…
Walkable amenities ~0.75 mi
Loading nearby amenities…
Taxation est. · year 1
- Rental income
- $22,159
- − Mortgage interest
- −$7,534
- − Property taxes
- −$1,737
- − Insurance
- −$672
- − Repairs & maintenance
- −$1,773
- − Management
- −$1,773
- − Depreciation
- −$3,913
- Taxable income
- $4,758
- Est. tax owed @ 24.0%
- −$1,142
- After-tax cash flow
- $5,491/yr
For passive investors: Depreciation is non-cash, so a rental often shows a tax loss while cash-flowing — sheltering income. Rental losses are passive: they offset passive income freely, and up to $25,000/yr can offset ordinary (W-2) income if you actively participate and your MAGI is under $100k (phasing out to $0 by $150k); unused losses carry forward. On sale, claimed depreciation is recaptured at up to 25%, and gains may owe capital-gains tax (a 1031 exchange can defer both). Figures are a year-1 estimate at your 24.0% rate — not tax advice; consult a CPA.
Schools (NCES district)
- District
- Oroville Union High
- NCES district ID
- 0629130
- Math proficiency
- 19% ▼ -2.00%
- Reading proficiency
- 49% ▼ -4.00%
- Median HH income
- $38,085
- Composite
- 28.26/100
- National rank
- #6794
- State rank
- #300 of 517 in CA
Livability — Oroville East
- Score
- 51/100
- State rank
- #1082
- US rank
- #25347
Category grades
Schools grade is shown separately in the Schools card above.
Census & demographics
- Census place
- Oroville East, CA
- County
- Butte County · 175,030 people
- Metro
- Chico, CA
- Population (ZIP)
- 28,503
- Household income
- $65,586
- Rent vs Own
- Severe rent burden
- 807.0
Population outlook (Butte County) Hauer SSP2
- Today (2025)
- 237,527 people
- By 2030
- 243,804 · +2.6%
- By 2040
- 253,899 · +6.9%
- By 2050
- 262,561 · +10.5%
- By 2075
- 283,709 · +19.4%
- By 2100
- 282,689 · +19.0%
Race, ethnicity, and origin ACS 2023
- Neighborhood character
- Predominantly White (67%)
- Race & ethnicity
- White 67% Hispanic / Latino 18% Two or more races 14% Asian 6% Native American 2% Black 2%
- Hispanic origin (detail)
- Mexican 16%
- Common ancestry
- Lithuanian 3% Slovak 3% Portuguese 2%
- Foreign-born
- 6% · Canada
- Languages at home
- 88% English-only · Spanish 7% Other Asian/Pacific 3% Russian/Polish/Slavic 1%
Political lean MEDSL · Butte
- 2024 margin
- Toss-up / Even · D 46.8% · R 49.9% · Other 3.3%
- 2008→2024 swing
- -5.5pp toward R · 2008: 2.4pp · 2024: -3.1pp
- All cycles
- 2024: R+3.1 2020: D+1.7 2016: R+4.0 2012: R+3.9 2008: D+2.4
Not yet ingested
- Civics
- —
Market trends
- HPI YoY
- ▼ -284.58%
- Current HPI
- 267.1415
- Rent YoY
- —
- Metro
- Chico, CA
- State GDP YoY
- ▲ 3.21%
- F500 in state
- 116
Industry mix (Fortune 500 HQ in CA)
| Industry | F500 HQs | Revenue |
|---|---|---|
| Technology | 27 | $1,492B |
|
||
| Financial Services | 3 | $174B |
|
||
| Retail | 3 | $44B |
|
||
| Insurance | 3 | $26B |
|
||
| Media / Entertainment | 2 | $115B |
|
||
| Pharmaceuticals / Biotech | 2 | $62B |
|
||
Price history
-29.2% since first listed9 events — show timeline
- 2026-03-14 Price Changed $134,500 CRMLS
- 2025-03-13 Relisted — CRMLS
- 2025-03-11 Pending — CRMLS
- 2025-01-18 Price Changed $139,500 CRMLS
- 2024-11-14 Listed $155,000 CRMLS
- 2024-11-09 Listing Removed — CRMLS
- 2024-09-10 Listed $155,000 CRMLS
- 2023-08-21 Listing Removed — CRMLS
- 2023-04-14 Listed $189,900 CRMLS
Property tax history
+1.2%/yrLatest (2025): $1,737 · +1.0% YoY. Source: county tax records.
Cash-flow waterfall
monthlySold comps — $/sqft
last 12 mo · ≤1 miLoading sold comps…