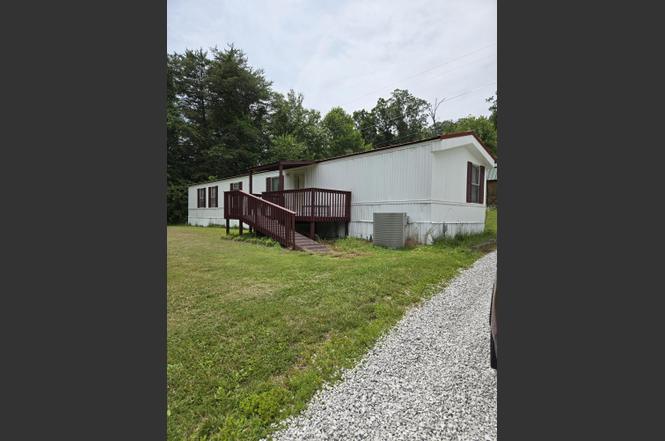
2174 Lambert Rd · Berea, KY
Flood risk 1/10 · Minimal
- FEMA flood zone
- X (unshaded)
- Chance of flooding over 30 yrs
- 0.0%
- Est. flood insurance / yr
- $507 – $1,088
Fire risk 7/10 · Major
- Est. fire insurance / yr
- $839 – $1,559
Heat risk 4/10 · Minor
- Hot days now (above 102°F)
- 7 days/yr
- Hot days in 30 yrs
- 20 days/yr
Wind risk 2/10 · Minimal
- Chance of severe wind over 30 yrs
- 4.0%
Air-quality risk 1/10 · Minimal
- Unhealthy air days now
- 0 days/yr
- Unhealthy air days in 30 yrs
- 0 days/yr
Risk factors via First Street. Map © Google.
Why this score? — see what drove the C+ grade
The composite is a weighted blend of 9 inputs, each scored 0–100. Each bar is that input's sub-score; the figure is the points it added to the 100-point composite (weight × sub-score).
- Cash flow +27.1/30.0
- DSCR +9.4/10.0
- ARV discount +7.5/15.0
- 1% rule +6.0/10.0
- Livability +3.8/5.0
- Schools +2.6/10.0
- Rent growth +2.5/5.0
- Condition / age +2.5/5.0
- Appreciation +0.0/10.0
$119,000
🖨 Deal sheet (PDF) 📄 Offer letter ✓ Due diligence
Listing remarks MLS
Completely furnished mobile home just minutes from Berea but great country living. Great condition, country setting can buy furnished or unfurnished!!!
Key facts
- 0.69 acre lot
- Built 2000
- Listed 3 days
Property features AI
Exterior
- Parking: Driveway
- Utilities: Septic tank; Electricity connected
- Home design: Manufactured home; One story
- Construction: Aluminum siding; Metal roof; Block foundation; Built area approximately 1,120
- Exterior features: Shed(s); Few trees on the lot; Public water
Interior
- Kitchen: Range; Refrigerator; Eat-in kitchen
- Bedrooms: Total rooms: 8
- Flooring: Laminate
- Bathrooms: 2 full bathrooms
- Heating & cooling: Electric heat; Heat pump for heating and cooling
- Interior features: Eat-in kitchen; In-law floorplan; Primary bedroom on the first floor; Ceiling fans; Soaking tub
- Laundry & utility: Washer hookup; Electric dryer hookup; Washer; Dryer
Neighborhood map
What this means for you Summary
Snapshot
- This is a 3-bed/2.0-bath other listed at $119k.
Deal economics
- At list price, monthly cash flow is $338 ($4k/yr) — positive.
- The deal already cash-flows at list — no discount required.
- Meets the 1% rule at list price ($1k rent vs $119k).
- Cap rate 9.7% vs local median 3.0% in Berea — top-decile yield for the area; either an underpriced asset or a hidden risk that comps aren't pricing in. Stress-test before assuming the spread holds.
Location & tenants
- Location reads 75/100 on livability (#104 in KY, #4,354 nationally) — a middle-class / working-renter tenant base. Strengths: crime A+, cost of living A+, health & safety A+; Watch: employment D, amenities F, commute F.
- Rockcastle County (rural): math 23% / reading 40% proficiency, ranked #102 of 165 in KY (top 62%) — families likely to look elsewhere, expect single-tenant / working-renter base with shorter leases.
- Zoned schools: Roundstone Elementary School (math 42% / reading 47%, grade F, #148 of 676 statewide, top 24%, 247 students, 71% FRL); Rockcastle County Middle School (math 20% / reading 43%, grade F, #125 of 217 statewide, top 63%, 578 students, 63% FRL); Rockcastle County High School (math 22% / reading 32%, grade F, #158 of 254 statewide, top 68%, 819 students, 64% FRL).
- Market conditions: 205 active listings in the ZIP.
Forward outlook
- Local home prices are declining (-3.0%/yr); year-one equity from $823 of loan paydown is wiped out by about $4k of value loss. Plan a longer hold.
- Rockcastle County population projected to shrink 8% by 2050 — rents likely to lag national; underwrite the cash flow, not the appreciation.
- At projected returns (-3.0% appreciation + 3.0% rent growth), your $33k cash investment doubles in ~10 years — after that, you're playing with house money.
Negotiation context
- Only 4 days on market — expect competitive offers; lowballing is unlikely to land.
- 3 sale attempts since 8y ago with the ask held roughly flat each time — persistent listings suggest the price (not the market) is what's stuck; bring a comps-based counter.
- Current owner paid $42k; list at $119k implies a 180% gain — meaningful room to come down on a strong offer.
Risks & watch-outs
- Climate carrying-cost: major wildfire risk — expect insurance premiums to compound above CPI over the hold.
Questions for the listing agent
- Is there a deadline driving the sale (1031 exchange, divorce, estate, relocation)? That informs how much negotiation room exists.
- What's the average days-on-market for RENTAL listings here right now (not sales)? A rising rental-DOM trend means longer vacancies and softer asking-rent achievability than the comps imply.
- What's the recent tenant-quality profile in this submarket — average credit score on applications, eviction rate, late-payment / NSF rate, and stable-employment percentage? A property-management company in the area should have these aggregated.
- How much new for-sale + rental construction is in the pipeline within 1–3 miles? Heavy new supply typically softens prices + rents 12–24 months out; constrained supply supports both.
Investment metrics
- 1% rule
- 1.10% ✓
- Cap rate
- 9.70%
- Cash-on-cash
- 12.19%
- DSCR
- 1.54
- GRM
- 7.6
CMA / ARV
No comps found within radius.
Projected returns pro-forma
-3.0% appreciation · 3.0% rent growth · sell at horizon
- IRR
- 1.7%
- Equity multiple
- 1.07×
- Total profit
- $2,210
- Equity at exit
- $17,743
- IRR
- 11.3%
- Equity multiple
- 1.88×
- Total profit
- $29,443
- Equity at exit
- $10,289
Cash invested: $33,320 (down + closing). Projections, not guarantees.
Landlord ↔ Tenant lean methodology
- Overall (STATE)
- 83 Strongly Landlord-Friendly
- State Kentucky
- 83 Strongly Landlord-Friendly · R+16
- County
- — inherits STATE
- City
- — inherits STATE
ZIP-level market 40403
- Home prices YoY
- -15.7%
- Active inventory
- 205
- Price-to-rent
- 7.6×
Monthly cashflow live
- Estimated rent
- $1,311 medium interval (Pro) →
- Mortgage (P&I)
- −$624
- Tax from tax record
- −$24 /mo · $285/yr
- Insurance
- −$50
- HOA
- −$0
- Vacancy / Maint / Mgmt
- −$275
- Net cashflow
- $338
Break-even live
Sensitivity live
| Price | -10% $406 | -5% $372 | +0% $338 | +5% $305 | +10% $271 |
|---|---|---|---|---|---|
| Rent | -10% $235 | -5% $287 | +0% $338 | +5% $390 | +10% $442 |
| Rate | -1.0pp $398 | -0.5pp $369 | base $338 | +0.5pp $308 | +1.0pp $276 |
UW: 25.0% down · 7.5% · 30yr · 1.5% tax · 5.0% vac · 8.0% maint · 8.0% mgmt
Financing live
Cash to close
- Down payment
- $29,750
- Closing costs
- $3,570
- Reserves months
- —
- Total cash needed
- —
Loan-product check · same deal, 3 products live
Conventional
25% down · 7.5% · 30yr
- Down + closing
- —
- Monthly P&I
- —
- Monthly cashflow
- —
- DSCR
- —
- Eligible?
- —
Personal DTI + credit; lowest rate.
DSCR
20% down · 8.5% · 30yr
- Down + closing
- —
- Monthly P&I
- —
- Monthly cashflow
- —
- DSCR
- —
- Eligible?
- —
No personal income docs; deal must DSCR.
Hard money
10% down · 12.0% · 12mo
- Down + closing
- —
- Monthly P&I
- —
- Monthly cashflow
- —
- DSCR
- —
- Eligible?
- —
Short-term bridge; refi at stabilization.
Listing history 5 events
-
2026-06-19days on market $119,000 Active 4 DOM
-
2026-06-18days on market $119,000 Active 3 DOM
-
2026-06-17days on market $119,000 Active 2 DOM
-
2026-06-15remarks 117-char remark
-
2026-06-15$119,000 Active 1 DOM
ⓘ Source: listings_history table (triggers on properties + properties_extension) + one-shot
backfill from property_details.listing_events for pre-trigger history.
Tax reassessment forecast KY · Resets to sale price
- Current annual tax
- $285 · $24/mo
- Projected year-2 tax
- $1,023 · $85/mo
- Expected delta
- +$739/yr (+$62/mo · 259.3%)
ⓘ Screening estimate from a state-policy table — verify with the county assessor before closing.
Climate risk First Street
- Flood 1/10 Low FEMA zone X (unshaded) · 0% chance over 30 yrs
- Wildfire 7/10 Severe
- Heat 4/10 Moderate 7 d/yr ≥102°F today · 20 d/yr by 30 yrs out
- Wind 2/10 Low 4% chance of damaging wind over 30 yrs
- Air quality 1/10 Low 0 unhealthy d/yr today · 0 by 30 yrs out
Nearby sold comps map
Loading sold comps map…
Walkable amenities ~0.75 mi
Loading nearby amenities…
Taxation est. · year 1
- Rental income
- $15,733
- − Mortgage interest
- −$6,666
- − Property taxes
- −$285
- − Insurance
- −$595
- − Repairs & maintenance
- −$1,259
- − Management
- −$1,259
- − Depreciation
- −$3,462
- Taxable income
- $2,208
- Est. tax owed @ 24.0%
- −$530
- After-tax cash flow
- $3,530/yr
For passive investors: Depreciation is non-cash, so a rental often shows a tax loss while cash-flowing — sheltering income. Rental losses are passive: they offset passive income freely, and up to $25,000/yr can offset ordinary (W-2) income if you actively participate and your MAGI is under $100k (phasing out to $0 by $150k); unused losses carry forward. On sale, claimed depreciation is recaptured at up to 25%, and gains may owe capital-gains tax (a 1031 exchange can defer both). Figures are a year-1 estimate at your 24.0% rate — not tax advice; consult a CPA.
Schools (NCES district)
- District
- Rockcastle County
- NCES district ID
- 2105070
- Math proficiency
- 23% ▼ -21.00%
- Reading proficiency
- 40% ▼ -18.00%
- Median HH income
- $30,809
- Composite
- 25.55/100
- National rank
- #7430
- State rank
- #102 of 165 in KY
Livability — Berea
- Score
- 75/100
- State rank
- #104
- US rank
- #4354
Category grades
Schools grade is shown separately in the Schools card above.
Census & demographics
- County
- Madison County · 93,568 people
- City population
- 27,607
- Metro
- Richmond-Berea, KY
- Population (ZIP)
- 27,607
- Household income
- $61,771
- Rent vs Own
- Severe rent burden
- 685.0
Population outlook (Rockcastle County) Hauer SSP2
- Today (2025)
- 17,003 people
- By 2030
- 16,913 · -0.5%
- By 2040
- 16,504 · -2.9%
- By 2050
- 15,697 · -7.7%
- By 2075
- 13,724 · -19.3%
- By 2100
- 11,369 · -33.1%
Race, ethnicity, and origin ACS 2023
- Neighborhood character
- Predominantly White (91%)
- Race & ethnicity
- White 91% Two or more races 5% Hispanic / Latino 4% Black 2%
- Common ancestry
- Italian 2% Slovak 2% Serbian 1%
- Foreign-born
- 2% · Canada
- Languages at home
- 97% English-only · Spanish 2%
Political lean MEDSL · Rockcastle
- 2024 margin
- Solid R (+73.1) · D 12.8% · R 85.9% · Other 1.3%
- 2008→2024 swing
- -19.8pp toward R · 2008: -53.4pp · 2024: -73.1pp
- All cycles
- 2024: R+73.1 2020: R+69.9 2016: R+70.2 2012: R+63.2 2008: R+53.4
Not yet ingested
- Civics
- —
Market trends
- HPI YoY
- ▼ -53.22%
- Current HPI
- 286.6948
- Rent YoY
- —
- Metro
- Richmond-Berea, KY
- State GDP YoY
- ▲ 1.81%
- F500 in state
- 4
Industry mix (Fortune 500 HQ in KY)
| Industry | F500 HQs | Revenue |
|---|---|---|
| Healthcare | 1 | $118B |
|
||
| Food / Beverage | 1 | $7B |
|
||
Price history
+142.9% since first listed5 events — show timeline
- 2026-06-15 Listed $119,000 ImagineMLS
- 2019-01-22 Listing Removed — ImagineMLS
- 2018-08-14 Sold (MLS) $42,500 ImagineMLS
- 2018-03-06 Listed $49,000 ImagineMLS
- 2018-03-06 Listed $49,000 ImagineMLS
Property tax history
-0.1%/yrLatest (2025): $285 · -0.6% YoY. Source: county tax records.
Cash-flow waterfall
monthlySold comps — $/sqft
last 12 mo · ≤1 miLoading sold comps…