20 Catherine St · Parishville, NY
Flood risk 6/10 · Moderate
- FEMA flood zone
- X
- Chance of flooding over 30 yrs
- 0.72%
- Est. flood insurance / yr
- $473 – $860
Fire risk 3/10 · Minor
- Est. fire insurance / yr
- $691 – $1,283
Heat risk 1/10 · Minimal
- Hot days now (above 91°F)
- 7 days/yr
- Hot days in 30 yrs
- 15 days/yr
Wind risk 1/10 · Minimal
- Chance of severe wind over 30 yrs
- —
Air-quality risk 1/10 · Minimal
- Unhealthy air days now
- 0 days/yr
- Unhealthy air days in 30 yrs
- 0 days/yr
Risk factors via First Street. Map © Google.
Why this score? — see what drove the B+ grade
The composite is a weighted blend of 9 inputs, each scored 0–100. Each bar is that input's sub-score; the figure is the points it added to the 100-point composite (weight × sub-score).
- Cash flow +30.0/30.0
- DSCR +10.0/10.0
- Appreciation +10.0/10.0
- 1% rule +8.9/10.0
- Schools +5.0/10.0
- ARV discount +3.4/15.0
- Livability +3.0/5.0
- Rent growth +2.5/5.0
- Condition / age +2.5/5.0
$98,000
🖨 Deal sheet (PDF) 📄 Offer letter ✓ Due diligence
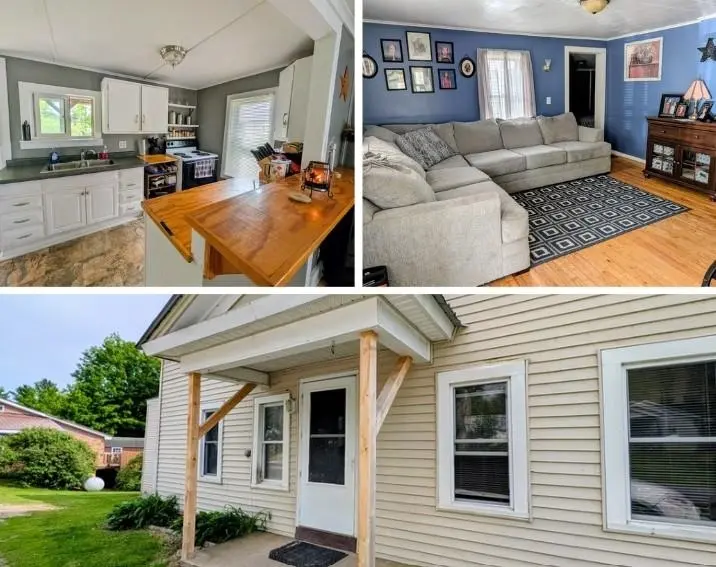
Listing remarks
Welcome home to this freshly painted 4-bedroom, 1 and 1/2 -bath property located in a quiet setting with convenient access to many local amenities. The thoughtfully designed floor plan offers first-floor living with a bedroom, full bathroom, and laundry area all located on the main level. The washer and dryer are included with the sale for added convenience. Upstairs, you'll find three additional bedrooms and a half bath, providing plenty of space for family, guests, or a home office. Recent improvements include a new propane water heater installed in 2024. The dry basement offers excellent storage space, while the covered back porch provides the perfect spot to relax and enjoy the peaceful
Key facts
- First-floor living
- Dry basement
- Covered back porch
Tags
Property features AI
Finance
- Other: Frontage approximately 94 feet; Lot dimensions approximately 94 x 99
Exterior
- Parking: Attached garage with 1 space
- Utilities: Public water; Septic tank
- Home design: Residential property; Two stories
- Construction: Vinyl siding; Built with metal roof
- Exterior features: Covered patio/porch; Metal roof
Interior
- Kitchen: Electric cooktop; Refrigerator
- Flooring: Laminate
- Bathrooms: One full bathroom; One half bathroom
- Heating & cooling: Forced air heating; Kerosene heating
- Interior features: Covered patio/porch; Laminate flooring
- Laundry & utility: Washer and dryer on the main level
Neighborhood map
What this means for you Summary
Snapshot
- This is a 3-bed/1.5-bath single-family listed at $98k.
Deal economics
- At list price, monthly cash flow is $374 ($4k/yr) — positive.
- The deal already cash-flows at list — no discount required.
- Meets the 1% rule at list price ($1k rent vs $98k).
Location & tenants
- Location reads 60/100 on livability (#997 in NY) — a middle-class / working-renter tenant base. Strengths: cost of living A+; Watch: employment C-, health & safety C-, crime F.
- Parishville-Hopkinton Central School District (rural): math 65% / reading 51% proficiency, ranked #326 of 755 in NY (top 43%) — acceptable for families but not a draw, mixed tenant base, ~2y average lease.
- Zoned schools: Parishville-Hopkinton Elementary School (math 52% / reading 47%, grade D, #1,085 of 2,108 statewide, top 56%, 176 students, 53% FRL); Parishville-Hopkinton Junior-Senior High School (math 52% / reading 64%, grade C, #879 of 1,100 statewide, top 80%, 169 students, 49% FRL) — zoned schools average 51% FRL vs 32% district-wide (19 pts higher); higher-poverty schools than district average — tighter screening recommended.
- Market conditions: 118 active listings in the ZIP; 215 units permitted in St. Lawrence County in 2024 (0 in 5+ unit buildings).
Forward outlook
- In year one you build about $10k of equity ($678 loan paydown + $10k appreciation (10.0% local appreciation)).
- St. Lawrence County population projected at -14% by 2050 — secular population decline; favor cash flow + early exit over multi-decade hold.
- At projected returns (10.0% appreciation + 3.0% rent growth), your $27k cash investment doubles in ~2 years — after that, you're playing with house money.
- By year 4, paydown + projected appreciation supports a ~$37k cash-out refi (75% LTV) — recoverable capital for the next deal without selling this one.
Negotiation context
- Only 14 days on market — expect competitive offers; lowballing is unlikely to land.
- 2 sale attempts since 5y ago with the ask held roughly flat each time — persistent listings suggest the price (not the market) is what's stuck; bring a comps-based counter.
- Current owner paid $65k; list at $98k implies a 51% gain — meaningful room to come down on a strong offer.
Risks & watch-outs
- Watch-outs: built in 1880 — expect roof / HVAC / electrical / plumbing capex.
- Climate carrying-cost: major flood risk — expect insurance premiums to compound above CPI over the hold.
Questions for the listing agent
- Built in 1880 — when were the roof, HVAC, electrical panel, plumbing, and water heater last replaced?
- Is there a deadline driving the sale (1031 exchange, divorce, estate, relocation)? That informs how much negotiation room exists.
- Schools are B-rated — typically a magnet for longer-tenancy family renters. What's the average tenant stay here, and is there a school-zone premium baked into asking?
- Crime grade is F in this area — have there been break-ins, vandalism, or insurance claims at this property in the last 3 years? What carrier currently insures it and at what premium?
- What's the average days-on-market for RENTAL listings here right now (not sales)? A rising rental-DOM trend means longer vacancies and softer asking-rent achievability than the comps imply.
- What's the recent tenant-quality profile in this submarket — average credit score on applications, eviction rate, late-payment / NSF rate, and stable-employment percentage? A property-management company in the area should have these aggregated.
- How much new for-sale + rental construction is in the pipeline within 1–3 miles? Heavy new supply typically softens prices + rents 12–24 months out; constrained supply supports both.
Investment metrics
- 1% rule
- 1.39% ✓
- Cap rate
- 10.87%
- Cash-on-cash
- 16.35%
- DSCR
- 1.73
- GRM
- 6.0
CMA / ARV
- ARV (on-the-fly)
- $89,790
- Comps found
- 3
Show comp detail 3 sales within ~0.75 mi
| Address | Dist | Beds/Ba | Sqft | Sold | Price | $/sf | Match |
|---|---|---|---|---|---|---|---|
| 17 Catherine St | 0.03mi | 3/1.0 | 1,144 (-7%) | 8mo | $105,000 | $92 | 79 |
| 45 Catherine St | 0.13mi | 4/2.0 (+1) | 1,296 (+5%) | 6mo | $40,000 | $31 | 73 |
| 49 Catherine St | 0.15mi | 2/1.0 (-1) | 1,230 (0%) | 19mo | $90,000 | $73 | 70 |
Match score weights: distance 35% · size 25% · config 20% · recency 20%. Top-matched comps best support the ARV.
Projected returns pro-forma
10.0% appreciation · 3.0% rent growth · sell at horizon
- IRR
- 36.4%
- Equity multiple
- 3.81×
- Total profit
- $77,226
- Equity at exit
- $88,286
- IRR
- 31.4%
- Equity multiple
- 8.61×
- Total profit
- $208,758
- Equity at exit
- $190,392
Cash invested: $27,440 (down + closing). Projections, not guarantees.
Landlord ↔ Tenant lean methodology
- Overall (STATE)
- 15 Strongly Tenant-Friendly
- State New York
- 15 Strongly Tenant-Friendly · D+10
- County
- — inherits STATE
- City
- — inherits STATE
ZIP-level market 13676
- Home prices YoY
- 17.7%
- Active inventory
- 118
- Price-to-rent
- 6.0×
Monthly cashflow live
- Estimated rent
- $1,361 medium interval (Pro) →
- Mortgage (P&I)
- −$514
- Tax from tax record
- −$146 /mo · $1,754/yr
- Insurance
- −$41
- HOA
- −$0
- Vacancy / Maint / Mgmt
- −$286
- Net cashflow
- $374
Break-even live
Sensitivity live
| Price | -10% $429 | -5% $402 | +0% $374 | +5% $346 | +10% $318 |
|---|---|---|---|---|---|
| Rent | -10% $266 | -5% $320 | +0% $374 | +5% $428 | +10% $481 |
| Rate | -1.0pp $423 | -0.5pp $399 | base $374 | +0.5pp $349 | +1.0pp $323 |
UW: 25.0% down · 7.5% · 30yr · 1.5% tax · 5.0% vac · 8.0% maint · 8.0% mgmt
Financing live
Cash to close
- Down payment
- $24,500
- Closing costs
- $2,940
- Reserves months
- —
- Total cash needed
- —
Loan-product check · same deal, 3 products live
Conventional
25% down · 7.5% · 30yr
- Down + closing
- —
- Monthly P&I
- —
- Monthly cashflow
- —
- DSCR
- —
- Eligible?
- —
Personal DTI + credit; lowest rate.
DSCR
20% down · 8.5% · 30yr
- Down + closing
- —
- Monthly P&I
- —
- Monthly cashflow
- —
- DSCR
- —
- Eligible?
- —
No personal income docs; deal must DSCR.
Hard money
10% down · 12.0% · 12mo
- Down + closing
- —
- Monthly P&I
- —
- Monthly cashflow
- —
- DSCR
- —
- Eligible?
- —
Short-term bridge; refi at stabilization.
Listing history 11 events
-
2026-06-21days on market $98,000 Active 14 DOM
-
2026-06-21days on market $98,000 Active 13 DOM
-
2026-06-18days on market $98,000 Active 11 DOM
-
2026-06-17days on market $98,000 Active 10 DOM
-
2026-06-16days on market $98,000 Active 9 DOM
-
2026-06-15days on market $98,000 Active 8 DOM
-
2026-06-13days on market $98,000 Active 6 DOM
-
2026-06-12days on market $98,000 Active 5 DOM
-
2026-06-09days on market $98,000 Active 2 DOM
-
2026-06-07remarks 699-char remark
-
2026-06-07$98,000 Active 1 DOM
ⓘ Source: listings_history table (triggers on properties + properties_extension) + one-shot
backfill from property_details.listing_events for pre-trigger history.
Tax reassessment forecast NY · Partial reset (capped growth)
- Current annual tax
- $1,754 · $146/mo
- Projected year-2 tax
- $1,754 · $146/mo
- Expected delta
- $0/yr ($0/mo · 0.0%)
ⓘ Screening estimate from a state-policy table — verify with the county assessor before closing.
Climate risk First Street
- Flood 6/10 Major FEMA zone X · 72% chance over 30 yrs
- Wildfire 3/10 Moderate
- Heat 1/10 Low 7 d/yr ≥91°F today · 15 d/yr by 30 yrs out
- Wind 1/10 Low
- Air quality 1/10 Low 0 unhealthy d/yr today · 0 by 30 yrs out
Nearby sold comps map
Loading sold comps map…
Walkable amenities ~0.75 mi
Loading nearby amenities…
Taxation est. · year 1
- Rental income
- $16,327
- − Mortgage interest
- −$5,490
- − Property taxes
- −$1,754
- − Insurance
- −$490
- − Repairs & maintenance
- −$1,306
- − Management
- −$1,306
- − Depreciation
- −$2,851
- Taxable income
- $3,131
- Est. tax owed @ 24.0%
- −$751
- After-tax cash flow
- $3,736/yr
For passive investors: Depreciation is non-cash, so a rental often shows a tax loss while cash-flowing — sheltering income. Rental losses are passive: they offset passive income freely, and up to $25,000/yr can offset ordinary (W-2) income if you actively participate and your MAGI is under $100k (phasing out to $0 by $150k); unused losses carry forward. On sale, claimed depreciation is recaptured at up to 25%, and gains may owe capital-gains tax (a 1031 exchange can defer both). Figures are a year-1 estimate at your 24.0% rate — not tax advice; consult a CPA.
Schools (NCES district)
- District
- Parishville-Hopkinton Central School District
- NCES district ID
- 3622440
- Math proficiency
- 65% ▲ 10.00%
- Reading proficiency
- 51% ▬ 0.00%
- Median HH income
- $43,130
- Composite
- 50.48/100
- National rank
- #3989
- State rank
- #326 of 755 in NY
Livability — Parishville
- Score
- 60/100
- State rank
- #997
- US rank
- #19460
Category grades
Schools grade is shown separately in the Schools card above.
Census & demographics
- Census place
- Parishville, NY
- Population (ZIP)
- 13,408
Population outlook (St. Lawrence County) Hauer SSP2
- Today (2025)
- 110,027 people
- By 2030
- 107,455 · -2.3%
- By 2040
- 100,492 · -8.7%
- By 2050
- 94,254 · -14.3%
- By 2075
- 80,175 · -27.1%
- By 2100
- 63,140 · -42.6%
Race, ethnicity, and origin ACS 2023
- Neighborhood character
- Predominantly White (90%)
- Race & ethnicity
- White 90% Two or more races 4% Asian 3% Hispanic / Latino 2% Black 2%
- Common ancestry
- Lithuanian 6% Romanian 4% Iranian 2%
- Foreign-born
- 7% · Canada, China
- Languages at home
- 94% English-only · Spanish 2% Other Indo-European 1% French/Haitian/Cajun 1%
Political lean MEDSL · St. Lawrence
- 2024 margin
- R (+18.0) · D 41.0% · R 59.0%
- 2008→2024 swing
- -34.3pp toward R · 2008: 16.3pp · 2024: -18.0pp
- All cycles
- 2024: R+18.0 2020: R+11.7 2016: R+10.8 2012: D+16.6 2008: D+16.3
Not yet ingested
- Civics
- —
Market trends
- HPI YoY
- ▲ 48.01%
- Current HPI
- 318.7704
- Rent YoY
- —
- Metro
- —
- State GDP YoY
- ▲ 2.60%
- F500 in state
- 92
Industry mix (Fortune 500 HQ in NY)
| Industry | F500 HQs | Revenue |
|---|---|---|
| Financial Services | 10 | $950B |
|
||
| Consumer Goods | 9 | $162B |
|
||
| Insurance | 4 | $225B |
|
||
| Telecommunications | 2 | $144B |
|
||
| Pharmaceuticals | 2 | $112B |
|
||
| Media / Entertainment | 2 | $69B |
|
||
Price history
+653.8% since first listed6 events — show timeline
- 2026-06-07 Listed $98,000 SLCMLS
- 2021-09-23 Sold (Public Records) $65,000 Public Records
- 2021-09-21 Sold (MLS) $65,000 ACVMLS
- 2021-07-15 Listed $73,500 ACVMLS
- 2013-12-13 Sold (Public Records) $59,000 Public Records
- 1995-12-08 Sold (Public Records) $13,000 Public Records
Property tax history
+4.0%/yrLatest (2025): $1,754 · +3.8% YoY. Source: county tax records.
Cash-flow waterfall
monthlySold comps — $/sqft
last 12 mo · ≤1 miLoading sold comps…