 🏗️ New Construction
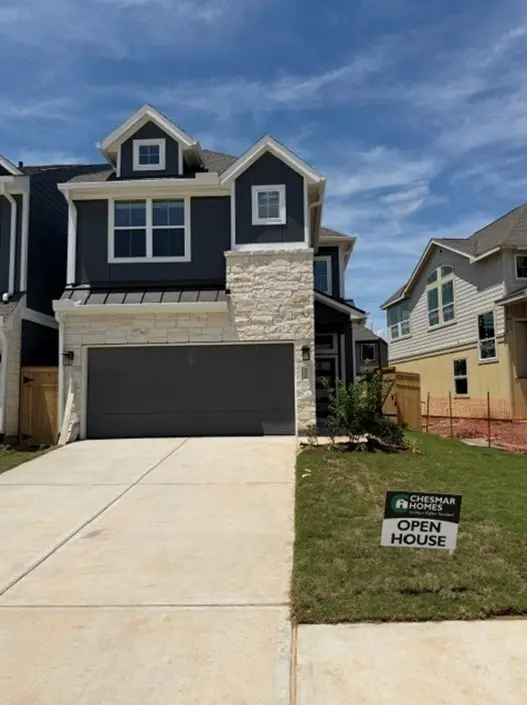
9438 Garden Gate Dr · Sienna, TX
Flood risk 4/10 · Minor
- FEMA flood zone
- X
- Chance of flooding over 30 yrs
- 0.22%
- Est. flood insurance / yr
- $507 – $1,088
Fire risk 4/10 · Minor
- Est. fire insurance / yr
- $1,222 – $2,270
Heat risk 9/10 · Severe
- Hot days now (above 111°F)
- 7 days/yr
- Hot days in 30 yrs
- 22 days/yr
Wind risk 9/10 · Severe
- Chance of severe wind over 30 yrs
- 99.0%
Air-quality risk 2/10 · Minimal
- Unhealthy air days now
- 2 days/yr
- Unhealthy air days in 30 yrs
- 2 days/yr
Risk factors via First Street. Map © Google.
Why this score? — see what drove the C+ grade
The composite is a weighted blend of 9 inputs, each scored 0–100. Each bar is that input's sub-score; the figure is the points it added to the 100-point composite (weight × sub-score).
- Cash flow +24.1/30.0
- DSCR +7.8/10.0
- ARV discount +7.5/15.0
- 1% rule +6.7/10.0
- Schools +4.5/10.0
- Appreciation +4.2/10.0
- Condition / age +4.2/5.0
- Rent growth +2.5/5.0
- Livability +2.5/5.0
$370,000
🖨 Deal sheet 📄 Offer letter ✓ Due diligence
Listing remarks
MOVE IN READY! Step into style and comfort with this stunning 2-story, 3-bedroom, 2.5-bath home offering 1,901 sq. ft. of thoughtfully designed living space. Featuring a 2-car garage, this home combines functionality with modern elegance. Two spacious bedrooms are located upstairs with Game room. Downstairs, the private primary suite offers a peaceful retreat with ample space and natural light. The chef-inspired kitchen showcases white cabinetry throughout, quartz countertops, and flows seamlessly into the living room with a cozy electric fireplace. Upgrades include natural wood-look tile in main living areas, plush upgraded carpet with ½"" pad in bedrooms and closets, and
Key facts
- Game room
- 3,934 sq ft lot
- 2 garage spots
Tags
Property features AI
Finance
- Other: Association fee collected annually
- HOA & community: Sienna Community Association; Community amenities include clubhouse, fitness center, pool, sport court, tennis courts, playground, parks and trails; Annual association fee
Exterior
- Parking: Attached garage with 2 spaces
- Security: Owned security system; Smoke detectors
- Utilities: Public water; Public sewer
- Home design: Residential property; New construction (builder: Chesmar Homes); Built in 2026; Slab foundation; Composition roof
- Construction: Brick and cement siding construction
- Exterior features: Covered patio; Patio and deck; Private yard; Back yard fencing; Sprinkler/irrigation system; Subdivision lot
Interior
- Kitchen: Convection oven; Gas oven; Gas range; Dishwasher; Microwave; Refrigerator
- Bedrooms: Total rooms: 6 (includes bedrooms and living areas)
- Flooring: Carpet; Tile
- Bathrooms: 2 full bathrooms; 1 half bathroom
- Heating & cooling: Central heating (electric and gas); Central electric air conditioning; Has heating; Has cooling
- Interior features: High ceilings; Kitchen island; Kitchen/family room combo; Kitchen/dining combo; Living/dining room; Primary bedroom with bath; Pantry; Walk-in pantry; Quartz countertops; Window treatments; Ceiling fans; Programmable thermostat; One fireplace
- Laundry & utility: Washer and dryer included; ENERGY STAR qualified appliances
Neighborhood map
What this means for you Summary
Snapshot
- This is a 3-bed/2.5-bath single-family listed at $370k. Condition is rated good.
Deal economics
- At list price, monthly cash flow is $708 ($8k/yr) — positive.
- The deal already cash-flows at list — no discount required.
- Meets the 1% rule at list price ($4k rent vs $370k).
- Recommended offer: $359k (3.0% below list) — sets the bar for market timing.
- Cap rate 8.7% vs local median 3.3% in Sienna — top-decile yield for the area; either an underpriced asset or a hidden risk that comps aren't pricing in. Stress-test before assuming the spread holds.
Location & tenants
- Location reads: area grade C — affects rentability + tenant quality, not the cash-flow math above.
- Fort Bend ISD (suburban): math 44% / reading 53% proficiency, ranked #140 of 826 in TX (top 17%) — families likely to look elsewhere, expect single-tenant / working-renter base with shorter leases.
- Zoned schools: Ronald Thornton Middle (math 40% / reading 52%, grade D+, #462 of 1,662 statewide, top 28%, 1,529 students, 41% FRL).
- Market conditions: Rents soft (-0.1%/yr); 1215 active listings in the ZIP; 3 comparable units currently listed for rent nearby; rentals at typical pace (median 22d on market — plan ~3-4 weeks tenant-placement turnaround); high-income renter base; 12,093 units permitted in Fort Bend County in 2024 (815 in 5+ unit buildings).
- This rent runs 39% of the median local income ($129k/yr) — at the standard rent-burdened threshold; future hikes will face affordability resistance.
Forward outlook
- Local home prices are declining (-1.7%/yr); year-one equity from $2k of loan paydown is wiped out by about $6k of value loss. Plan a longer hold.
- Fort Bend County population projected at +75% by 2050 — long-run rental-demand tailwind backs the buy-and-hold thesis.
Negotiation context
- It's been on market 31 days — a 3% lower offer ($359k) is reasonable based on typical stale-listing flexibility.
Risks & watch-outs
- Climate carrying-cost: severe wind risk, 99% chance of damaging wind over 30y; extreme-heat days projected 7→22/yr by 2055 (HVAC capex compounding) — expect insurance premiums to compound above CPI over the hold.
Questions for the listing agent
- It's been on market 31 days. Have you received any prior offers? Is the seller open to a 3% concession, seller financing, or rate buy-down credit?
- What does the HOA fee cover, when was the last increase, and are there any pending special assessments or reserve-fund shortfalls?
- Is there a deadline driving the sale (1031 exchange, divorce, estate, relocation)? That informs how much negotiation room exists.
- What's the average days-on-market for RENTAL listings here right now (not sales)? A rising rental-DOM trend means longer vacancies and softer asking-rent achievability than the comps imply.
- What's the recent tenant-quality profile in this submarket — average credit score on applications, eviction rate, late-payment / NSF rate, and stable-employment percentage? A property-management company in the area should have these aggregated.
- How much new for-sale + rental construction is in the pipeline within 1–3 miles? Heavy new supply typically softens prices + rents 12–24 months out; constrained supply supports both.
Investment metrics
- 1% rule
- 1.17% ✓
- Cap rate
- 8.66%
- Cash-on-cash
- 8.45%
- DSCR
- 1.38
- GRM
- 7.1
CMA / ARV
- ARV (on-the-fly)
- $359,289
- Comps found
- 12
Show comp detail 12 sales within ~0.75 mi
| Address | Dist | Beds/Ba | Sqft | Sold | Price | $/sf | Match |
|---|---|---|---|---|---|---|---|
| 9451 Garden Gate Dr | 0.04mi | 3/2.5 | 1,901 (0%) | 1mo | $352,990 | $186 | 98 |
| 9447 Garden Gate Dr | 0.03mi | 3/2.5 | 1,866 (-2%) | 1mo | $354,990 | $190 | 94 |
| 9431 Garden Gate Dr | 0.03mi | 3/2.5 | 1,835 (-4%) | 1mo | $350,000 | $191 | 92 |
| 1456 Shaded Rock Dr | 0.16mi | 3/2.5 | 1,838 (-3%) | 3mo | $330,000 | $180 | 85 |
| 1334 Shaded Rock Dr | 0.21mi | 4/2.5 (+1) | 1,910 (+0%) | 0mo | $349,990 | $183 | 84 |
| 1310 Shaded Rock Dr | 0.26mi | 3/2.5 | 1,838 (-3%) | 3mo | $347,740 | $189 | 80 |
| 9443 Garden Gate Dr | 0.03mi | 3/2.5 | 1,710 (-10%) | 3mo | $337,990 | $198 | 79 |
| 9442 Spring Rain Dr | 0.06mi | 3/2.5 | 1,710 (-10%) | 3mo | $337,990 | $198 | 78 |
| 1212 Shaded Rock Dr | 0.32mi | 3/2.5 | 1,977 (+4%) | 3mo | $365,115 | $185 | 76 |
| 1306 Shaded Rock Dr | 0.27mi | 4/2.5 (+1) | 2,046 (+8%) | 2mo | $365,915 | $179 | 68 |
| 10210 Water Harbor Dr | 0.60mi | 3/3.0 | 2,033 (+7%) | 2mo | $344,900 | $170 | 56 |
| 10311 Tranquil Lake Dr | 0.69mi | 4/3.0 (+1) | 1,973 (+4%) | 3mo | $392,844 | $199 | 52 |
Match score weights: distance 35% · size 25% · config 20% · recency 20%. Top-matched comps best support the ARV.
Projected returns pro-forma
-1.67% appreciation · 0.0% rent growth · sell at horizon
- IRR
- -1.2%
- Equity multiple
- 0.95×
- Total profit
- $-4,832
- Equity at exit
- $75,353
- IRR
- 3.3%
- Equity multiple
- 1.25×
- Total profit
- $25,385
- Equity at exit
- $69,795
Cash invested: $100,601 (down + closing). Projections, not guarantees.
Landlord ↔ Tenant lean methodology
- Overall (STATE)
- 87 Strongly Landlord-Friendly
- State Texas
- 87 Strongly Landlord-Friendly · R+5
- County
- — inherits STATE
- City
- — inherits STATE
ZIP-level market 77459
- Home prices YoY
- -0.8%
- Rents YoY
- -0.1%
- Active inventory
- 1215
- Price-to-rent
- 7.3×
Monthly cashflow live
- Estimated rent
- $4,206 medium interval (Pro) →
- Mortgage (P&I)
- −$1,884
- Tax est. 1.5%
- −$449 /mo · $5,389/yr
- Insurance
- −$150
- HOA
- −$132
- Vacancy / Maint / Mgmt
- −$883
- Net cashflow
- $708
Break-even live
UW: 25.0% down · 7.5% · 30yr · 1.5% tax · 5.0% vac · 8.0% maint · 8.0% mgmt
Financing live
Cash to close
- Down payment
- $89,822
- Closing costs
- $10,779
- Reserves months
- —
- Total cash needed
- —
Loan-product check · same deal, 3 products live
Conventional
25% down · 7.5% · 30yr
- Down + closing
- —
- Monthly P&I
- —
- Monthly cashflow
- —
- DSCR
- —
- Eligible?
- —
Personal DTI + credit; lowest rate.
DSCR
20% down · 8.5% · 30yr
- Down + closing
- —
- Monthly P&I
- —
- Monthly cashflow
- —
- DSCR
- —
- Eligible?
- —
No personal income docs; deal must DSCR.
Hard money
10% down · 12.0% · 12mo
- Down + closing
- —
- Monthly P&I
- —
- Monthly cashflow
- —
- DSCR
- —
- Eligible?
- —
Short-term bridge; refi at stabilization.
Rent comps 3 comps
| Address | Beds | Baths | Sqft | Rent | $/sqft | DOM | Units | Dist |
|---|---|---|---|---|---|---|---|---|
| 8719 Fox Trail Dr Missouri City, TX | 4.0 | 3.5 | 2143 | $6,000 | $2.80 | 21d | 1 | 0.58mi |
| 1714 Forest Mist Dr Missouri City, TX | 3.0 | 3.0 | 1979 | $3,000 | $1.52 | 43d | 1 | 0.62mi |
| 2142 Ironwood Pass Dr Missouri City, TX | 4.0 | 3.0 | 2140 | $6,000 | $2.80 | 1d | 1 | 0.82mi |
HOA detail
- Monthly dues
- $132 · $1,584/yr
- Likely covers
- electric
Listing history 15 events
-
2026-06-18days on market $370,000 Active 31 DOM
-
2026-06-17days on market $370,000 Active 30 DOM
-
2026-06-16days on market $370,000 Active 29 DOM
-
2026-06-15days on market $370,000 Active 28 DOM
-
2026-06-13days on market $370,000 Active 26 DOM
-
2026-06-09days on market $370,000 Active 22 DOM
-
2026-06-08days on market $370,000 Active 21 DOM
-
2026-06-07days on market $370,000 Active 20 DOM
-
2026-06-04days on market $370,000 Active 17 DOM
-
2026-06-03days on market $370,000 Active 16 DOM
-
2026-06-02days on market $370,000 Active 15 DOM
-
2026-06-01days on market $370,000 Active 14 DOM
-
2026-05-31days on market $370,000 Active 13 DOM
-
2026-05-19price $370,000
-
2026-05-18$385,865 Active
ⓘ Source: listings_history table (triggers on properties + properties_extension) + one-shot
backfill from property_details.listing_events for pre-trigger history.
Climate risk First Street
- Flood 4/10 Moderate FEMA zone X · 22% chance over 30 yrs
- Wildfire 4/10 Moderate
- Heat 9/10 Extreme 7 d/yr ≥111°F today · 22 d/yr by 30 yrs out
- Wind 9/10 Extreme 99% chance of damaging wind over 30 yrs
- Air quality 2/10 Low 2 unhealthy d/yr today · 2 by 30 yrs out
Nearby sold comps map
Loading sold comps map…
Walkable amenities ~0.75 mi
Loading nearby amenities…
Taxation est. · year 1
- Rental income
- $50,476
- − Mortgage interest
- −$20,126
- − Property taxes
- −$5,389
- − Insurance
- −$1,796
- − Repairs & maintenance
- −$4,038
- − Management
- −$4,038
- − HOA
- −$1,584
- − Depreciation
- −$10,452
- Taxable income
- $3,052
- Est. tax owed @ 24.0%
- −$733
- After-tax cash flow
- $7,764/yr
For passive investors: Depreciation is non-cash, so a rental often shows a tax loss while cash-flowing — sheltering income. Rental losses are passive: they offset passive income freely, and up to $25,000/yr can offset ordinary (W-2) income if you actively participate and your MAGI is under $100k (phasing out to $0 by $150k); unused losses carry forward. On sale, claimed depreciation is recaptured at up to 25%, and gains may owe capital-gains tax (a 1031 exchange can defer both). Figures are a year-1 estimate at your 24.0% rate — not tax advice; consult a CPA.
Condition & rehab AI · 30 photos
This move-in-ready home features a modern kitchen, two bathrooms with marble and tile finishes, and a well-maintained exterior. It is in excellent condition with minimal maintenance required.
Value-add opportunities
- Both Painting exterior and interior walls — Enhances curb appeal and interior aesthetics.
- Both Landscaping and curb appeal improvements — Improves curb appeal and enhances property value.
- Both Add smart home features — Enhances convenience and adds modern amenities.
Renovation cost estimate screening
Value-add ROI direction
- Both Painting exterior and interior walls — Enhances curb appeal and interior aesthetics. ↑
- Both Landscaping and curb appeal improvements — Improves curb appeal and enhances property value. ↑
- Both Add smart home features — Enhances convenience and adds modern amenities. ↑
ⓘ Cost ranges are severity-bucket heuristics (US national rule-of-thumb). Get contractor quotes + a written scope before underwriting a rehab budget.
Schools (NCES district)
- District
- Fort Bend ISD
- NCES district ID
- 4819650
- Math proficiency
- 44% ▼ -15.00%
- Reading proficiency
- 53% ▼ -4.00%
- Median HH income
- $82,360
- Composite
- 44.61/100
- National rank
- #2779
- State rank
- #140 of 826 in TX
Livability — Sienna
No livability data for this city. (Only ~50 U.S. cities are tracked.)
Census & demographics
- Census place
- Sienna, TX
- County
- Fort Bend County · 836,777 people
- Metro
- Houston-The Woodlands-Sugar Land, TX
- Population (ZIP)
- 84,221
- Household income
- $129,151
- Rent vs Own
- Severe rent burden
- 1004.0
Population outlook (Fort Bend County) Hauer SSP2
- Today (2025)
- 1,004,526 people
- By 2030
- 1,153,104 · +14.8%
- By 2040
- 1,453,718 · +44.7%
- By 2050
- 1,753,781 · +74.6%
- By 2075
- 2,455,772 · +144.5%
- By 2100
- 2,930,528 · +191.7%
Race, ethnicity, and origin ACS 2023
- Neighborhood character
- Highly diverse neighborhood (Simpson 0.75)
- Race & ethnicity
- White 34% Black 26% Asian 22% Hispanic / Latino 13% Two or more races 10%
- Hispanic origin (detail)
- Mexican 7%
- Common ancestry
- Lithuanian 2% Slovak 1% Italian 1%
- Foreign-born
- 21% · Canada, China, Vietnam
- Languages at home
- 73% English-only · Other Asian/Pacific 8% Spanish 7% Other Indo-European 5%
Political lean MEDSL · Fort Bend
- 2024 margin
- Toss-up / Even · D 49.5% · R 47.9% · Other 2.6%
- 2008→2024 swing
- +4.0pp toward D · 2008: -2.4pp · 2024: 1.6pp
- All cycles
- 2024: D+1.6 2020: D+10.6 2016: D+6.6 2012: R+6.8 2008: R+2.4
Not yet ingested
- Civics
- —
Market trends
- HPI YoY
- ▼ -1.67%
- Current HPI
- 212.3573
- Rent YoY
- ▼ -0.15%
- Metro
- Houston-The Woodlands-Sugar Land, TX
- State GDP YoY
- ▲ 3.95%
- F500 in state
- 110
Industry mix (Fortune 500 HQ in TX)
| Industry | F500 HQs | Revenue |
|---|---|---|
| Energy | 16 | $1,198B |
|
||
| Technology | 5 | $198B |
|
||
| Engineering / Construction | 4 | $72B |
|
||
| Energy Services | 3 | $60B |
|
||
| Utilities | 3 | $41B |
|
||
| Healthcare | 2 | $330B |
|
||
Price history
-4.1% since first listed2 events — show timeline
- 2026-05-19 Price Changed $370,000 HARMLS
- 2026-05-18 Listed $385,865 HARMLS
Cash-flow waterfall
monthlySold comps — $/sqft
last 12 mo · ≤1 miLoading sold comps…