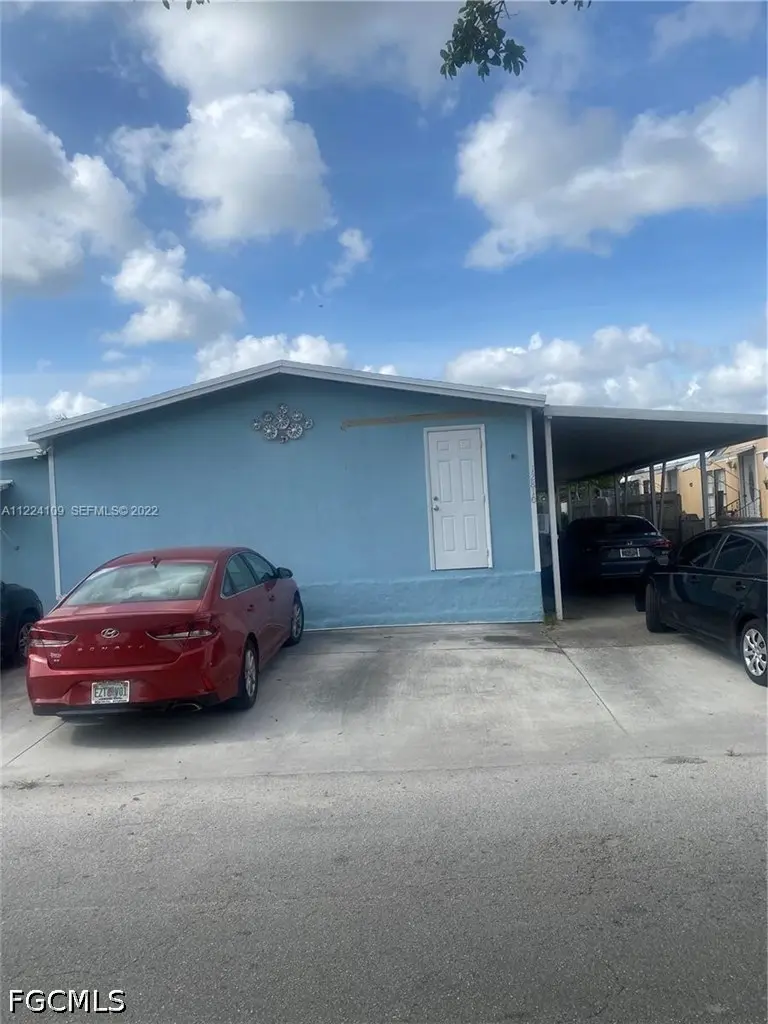
12810 SW 17 St · Tamiami, FL
Flood risk No data
- FEMA flood zone
- —
- Chance of flooding over 30 yrs
- —
- Est. flood insurance / yr
- —
Fire risk No data
- Est. fire insurance / yr
- —
Heat risk No data
- Hot days now (above threshold)
- —
- Hot days in 30 yrs
- —
Wind risk No data
- Chance of severe wind over 30 yrs
- —
Air-quality risk No data
- Unhealthy air days now
- —
- Unhealthy air days in 30 yrs
- —
Risk factors via First Street. Map © Google.
Why this score? — see what drove the B grade
The composite is a weighted blend of 9 inputs, each scored 0–100. Each bar is that input's sub-score; the figure is the points it added to the 100-point composite (weight × sub-score).
- Cash flow +30.0/30.0
- 1% rule +10.0/10.0
- DSCR +10.0/10.0
- ARV discount +7.5/15.0
- Schools +4.2/10.0
- Livability +4.0/5.0
- Rent growth +3.5/5.0
- Condition / age +2.2/5.0
- Appreciation +0.0/10.0
$159,000
🖨 Deal sheet 📄 Offer letter ✓ Due diligence
Listing remarks
GREAT OPPORTUNITY FOR INVESTMENT. BEAUTIFUL HOME. 5 BEDS AND 4 BATHS. SPLIT IN 3 RENTS: 3/2 FOR $2,600. 1/1 FOR $1,200. + 1/1 for $1,100, EACH WITH KITCHENET (ERANGE + REFRIGERATOR + MICROWAVE). LAUNDRY UNIT OUTSIDE. POOL, TENNIS, PLAY GROUND.
Key facts
- Kitchenet
- Tennis
- Laundry unit outside
Tags
Property features AI
Finance
- Other: Pets allowed
- Financial info: No additional financial details provided
- HOA & community: Homeowners association with monthly fee ($1,000/month); Association amenities: Clubhouse, Playground, Pool, Tennis courts; Community is non-gated; Community contains about 100 units
Exterior
- Parking: Detached carport; 2 covered carport spaces
- Security: No specific security features listed
- Utilities: Cable available; Water assessment paid; Sewer assessment paid
- Home design: Single-story building; Northeast-facing; Resale property; On-site management
- Construction: Aluminum siding; Metal frame construction; Metal roof
- Exterior features: Community pool; Southwest exposure
Interior
- Kitchen: Range; Microwave; Refrigerator; Dishwasher not listed
- Bedrooms: One bedroom (10 x 10)
- Flooring: Tile flooring
- Bathrooms: 4 full bathrooms
- Heating & cooling: Central electric heating; Central electric cooling (central air)
- Interior features: Unfurnished; No additional interior features listed
- Laundry & utility: Washer; Dryer
Neighborhood map
What this means for you Summary
Snapshot
- This is a 5-bed/4.0-bath manufactured listed at $159k. Condition is rated fair.
Deal economics
- At list price, monthly cash flow is $967 ($12k/yr) — positive.
- The deal already cash-flows at list — no discount required.
- Meets the 1% rule at list price ($4k rent vs $159k).
- Cap rate 13.6% vs local median 3.4% in Tamiami — top-decile yield for the area; either an underpriced asset or a hidden risk that comps aren't pricing in. Stress-test before assuming the spread holds.
Location & tenants
- Location reads 79/100 on livability (#146 in FL, #2,197 nationally) — a middle-class / working-renter tenant base. Strengths: housing A+, health & safety A+, crime A; Watch: cost of living D, amenities F.
- Miami-Dade (suburban): math 45% / reading 54% proficiency, ranked #40 of 73 in FL (top 55%) — families likely to look elsewhere, expect single-tenant / working-renter base with shorter leases; 64% free/reduced lunch — lower-income household profile, screen leases tightly.
- Market conditions: Rents rising fast (+4.2%/yr); 188 active listings in the ZIP; 2 comparable units currently listed for rent nearby; solid renter incomes; 10,051 units permitted in Miami-Dade County in 2024 (7,758 in 5+ unit buildings).
- At $3,880/mo this rent would consume 60% of the median local household income ($78k/yr) (locally 1270% of renters already pay >50% of income on rent) — very limited rent-growth headroom before tenants either downsize or default.
Forward outlook
- Local home prices are declining (-3.0%/yr); year-one equity from $1k of loan paydown is wiped out by about $5k of value loss. Plan a longer hold.
- Miami-Dade County population projected at +28% by 2050 — long-run rental-demand tailwind backs the buy-and-hold thesis.
- At projected returns (-3.0% appreciation + 4.2% rent growth), your $45k cash investment doubles in ~5 years — after that, you're playing with house money.
Negotiation context
- Only 14 days on market — expect competitive offers; lowballing is unlikely to land.
- 3 sale attempts since 4y ago with the ask held roughly flat each time — persistent listings suggest the price (not the market) is what's stuck; bring a comps-based counter.
Risks & watch-outs
- Watch-outs: HOA is 26% of rent.
Questions for the listing agent
- Have any recent inspections been done? Can we get a copy of the seller's disclosures and any deferred-maintenance estimates?
- What does the HOA fee cover, when was the last increase, and are there any pending special assessments or reserve-fund shortfalls?
- Is there a deadline driving the sale (1031 exchange, divorce, estate, relocation)? That informs how much negotiation room exists.
- Schools are B-rated — typically a magnet for longer-tenancy family renters. What's the average tenant stay here, and is there a school-zone premium baked into asking?
- What's the average days-on-market for RENTAL listings here right now (not sales)? A rising rental-DOM trend means longer vacancies and softer asking-rent achievability than the comps imply.
- What's the recent tenant-quality profile in this submarket — average credit score on applications, eviction rate, late-payment / NSF rate, and stable-employment percentage? A property-management company in the area should have these aggregated.
- How much new for-sale + rental construction is in the pipeline within 1–3 miles? Heavy new supply typically softens prices + rents 12–24 months out; constrained supply supports both.
Investment metrics
- 1% rule
- 2.44% ✓
- Cap rate
- 13.59%
- Cash-on-cash
- 26.05%
- DSCR
- 2.16
- GRM
- 3.4
CMA / ARV
No comps found within radius.
Projected returns pro-forma
-3.0% appreciation · 4.19% rent growth · sell at horizon
- IRR
- 22.0%
- Equity multiple
- 1.92×
- Total profit
- $41,173
- Equity at exit
- $23,707
- IRR
- 31.3%
- Equity multiple
- 4.09×
- Total profit
- $137,624
- Equity at exit
- $13,747
Cash invested: $44,520 (down + closing). Projections, not guarantees.
Landlord ↔ Tenant lean methodology
- Overall (STATE)
- 87 Strongly Landlord-Friendly
- State Florida
- 87 Strongly Landlord-Friendly · R+3
- County
- — inherits STATE
- City
- — inherits STATE
ZIP-level market 33175
- Rents YoY
- 4.2%
- Active inventory
- 188
- Price-to-rent
- 3.4×
Monthly cashflow live
- Estimated rent
- $3,880 medium interval (Pro) →
- Mortgage (P&I)
- −$834
- Tax est. 1.5%
- −$199 /mo · $2,385/yr
- Insurance
- −$66
- HOA
- −$1,000
- Vacancy / Maint / Mgmt
- −$815
- Net cashflow
- $967
Break-even live
UW: 25.0% down · 7.5% · 30yr · 1.5% tax · 5.0% vac · 8.0% maint · 8.0% mgmt
Financing live
Cash to close
- Down payment
- $39,750
- Closing costs
- $4,770
- Reserves months
- —
- Total cash needed
- —
Loan-product check · same deal, 3 products live
Conventional
25% down · 7.5% · 30yr
- Down + closing
- —
- Monthly P&I
- —
- Monthly cashflow
- —
- DSCR
- —
- Eligible?
- —
Personal DTI + credit; lowest rate.
DSCR
20% down · 8.5% · 30yr
- Down + closing
- —
- Monthly P&I
- —
- Monthly cashflow
- —
- DSCR
- —
- Eligible?
- —
No personal income docs; deal must DSCR.
Hard money
10% down · 12.0% · 12mo
- Down + closing
- —
- Monthly P&I
- —
- Monthly cashflow
- —
- DSCR
- —
- Eligible?
- —
Short-term bridge; refi at stabilization.
Rent comps 2 comps
| Address | Beds | Baths | Sqft | Rent | $/sqft | DOM | Units | Dist |
|---|---|---|---|---|---|---|---|---|
| 11780 SW 18th St #230 Miami, FL | 4.0 | 2.0 | 1294 | $2,500 | $1.93 | 24d | 1 | 1.07mi |
| 550 SW 115th Ave Unit 310F Miami, FL | 4.0 | 3.5 | 1426 | $3,200 | $2.24 | 24d | 1 | 1.45mi |
HOA detail
- Monthly dues
- $1,000 · $12,000/yr
- Likely covers
- pool
Listing history 9 events
-
2026-06-18days on market $159,000 Active 14 DOM
-
2026-06-17days on market $159,000 Active 13 DOM
-
2026-06-16days on market $159,000 Active 12 DOM
-
2026-06-15days on market $159,000 Active 11 DOM
-
2026-06-13days on market $159,000 Active 9 DOM
-
2026-06-09days on market $159,000 Active 5 DOM
-
2026-06-08days on market $159,000 Active 4 DOM
-
2026-06-07remarks 245-char remark
-
2026-06-07$159,000 Active 3 DOM
ⓘ Source: listings_history table (triggers on properties + properties_extension) + one-shot
backfill from property_details.listing_events for pre-trigger history.
Nearby sold comps map
Loading sold comps map…
Walkable amenities ~0.75 mi
Loading nearby amenities…
Taxation est. · year 1
- Rental income
- $46,563
- − Mortgage interest
- −$8,906
- − Property taxes
- −$2,385
- − Insurance
- −$795
- − Repairs & maintenance
- −$3,725
- − Management
- −$3,725
- − HOA
- −$12,000
- − Depreciation
- −$4,625
- Taxable income
- $10,401
- Est. tax owed @ 24.0%
- −$2,496
- After-tax cash flow
- $9,103/yr
For passive investors: Depreciation is non-cash, so a rental often shows a tax loss while cash-flowing — sheltering income. Rental losses are passive: they offset passive income freely, and up to $25,000/yr can offset ordinary (W-2) income if you actively participate and your MAGI is under $100k (phasing out to $0 by $150k); unused losses carry forward. On sale, claimed depreciation is recaptured at up to 25%, and gains may owe capital-gains tax (a 1031 exchange can defer both). Figures are a year-1 estimate at your 24.0% rate — not tax advice; consult a CPA.
Condition & rehab AI · 12 photos
This manufactured home requires moderate renovations, focusing on the kitchen and bathroom, to significantly improve its resale and rental value.
Repairs flagged
- Major Kitchen countertops — Dirty and cluttered, needs replacement
- Major Bathroom paint — Dated and in need of a fresh coat
- Minor Exterior siding — Some discoloration
Value-add opportunities
- Both Paint kitchen and bathroom — Fresh paint enhances curb appeal and interior aesthetics
- Both Replace kitchen countertops — New countertops improve functionality and appearance
- Both Landscaping improvements — Enhances curb appeal and adds value
Renovation cost estimate screening
| Repair item | Severity | Est. cost |
|---|---|---|
| Kitchen countertops · Dirty and cluttered, needs replacement | Major | $15,000–50,000 |
| Bathroom paint · Dated and in need of a fresh coat | Major | $15,000–50,000 |
| Exterior siding · Some discoloration | Minor | $500–3,000 |
| Total estimated repair cost · 3 items | $30,500–103,000 |
Value-add ROI direction
- Both Paint kitchen and bathroom — Fresh paint enhances curb appeal and interior aesthetics ↑
- Both Replace kitchen countertops — New countertops improve functionality and appearance ↑
- Both Landscaping improvements — Enhances curb appeal and adds value ↑
ⓘ Cost ranges are severity-bucket heuristics (US national rule-of-thumb). Get contractor quotes + a written scope before underwriting a rehab budget.
Schools (NCES district)
- District
- Miami-Dade
- NCES district ID
- 1200390
- Math proficiency
- 45% ▼ -16.00%
- Reading proficiency
- 54% ▼ -5.00%
- Median HH income
- $43,928
- Composite
- 41.76/100
- National rank
- #3397
- State rank
- #40 of 73 in FL
Livability — Tamiami
- Score
- 79/100
- State rank
- #146
- US rank
- #2197
Category grades
Schools grade is shown separately in the Schools card above.
Census & demographics
- Census place
- Tamiami, FL
- County
- Miami-Dade County · 2,697,751 people
- City population
- 80,608
- Metro
- Miami-Fort Lauderdale-Pompano Beach, FL
- Population (ZIP)
- 48,237
- Household income
- $77,841
- Rent vs Own
- Severe rent burden
- 1270.0
Population outlook (Miami-Dade County) Hauer SSP2
- Today (2025)
- 3,126,439 people
- By 2030
- 3,325,765 · +6.4%
- By 2040
- 3,697,561 · +18.3%
- By 2050
- 4,012,134 · +28.3%
- By 2075
- 4,605,612 · +47.3%
- By 2100
- 4,866,598 · +55.7%
Race, ethnicity, and origin ACS 2023
- Neighborhood character
- Predominantly Hispanic (92%)
- Race & ethnicity
- Hispanic / Latino 92% Two or more races 46% White 6% Asian 1%
- Hispanic origin (detail)
- Puerto Rican 3% Cuban 72%
- Common ancestry
- Italian 1%
- Foreign-born
- 67% · Canada, Jamaica, Dominican Republic
- Languages at home
- 8% English-only · Spanish 89% Other Indo-European 1% Tagalog/Filipino 1%
Political lean MEDSL · Miami-Dade
- 2024 margin
- R (+11.4) · D 43.9% · R 55.4%
- 2008→2024 swing
- -27.6pp toward R · 2008: 16.1pp · 2024: -11.4pp
- All cycles
- 2024: R+11.4 2020: D+7.3 2016: D+29.6 2012: D+23.7 2008: D+16.1
Not yet ingested
- Civics
- —
Market trends
- HPI YoY
- ▼ -528.20%
- Current HPI
- 459.1413
- Rent YoY
- ▲ 4.19%
- Metro
- Miami-Fort Lauderdale-Pompano Beach, FL
- State GDP YoY
- ▲ 3.28%
- F500 in state
- 36
Industry mix (Fortune 500 HQ in FL)
| Industry | F500 HQs | Revenue |
|---|---|---|
| Industrial Technology | 2 | $29B |
|
||
| Insurance | 2 | $17B |
|
||
| Retail | 1 | $60B |
|
||
| Technology Distribution | 1 | $58B |
|
||
| Homebuilding | 1 | $35B |
|
||
| Technology Manufacturing | 1 | $35B |
|
||
Price history
-0.6% since first listed4 events — show timeline
- 2026-06-04 Listed $159,000 FORTMLS
- 2022-09-06 Listing Removed — MARMLS
- 2022-07-23 Relisted — MARMLS
- 2022-06-18 Listed $159,900 MARMLS
Cash-flow waterfall
monthlySold comps — $/sqft
last 12 mo · ≤1 miLoading sold comps…