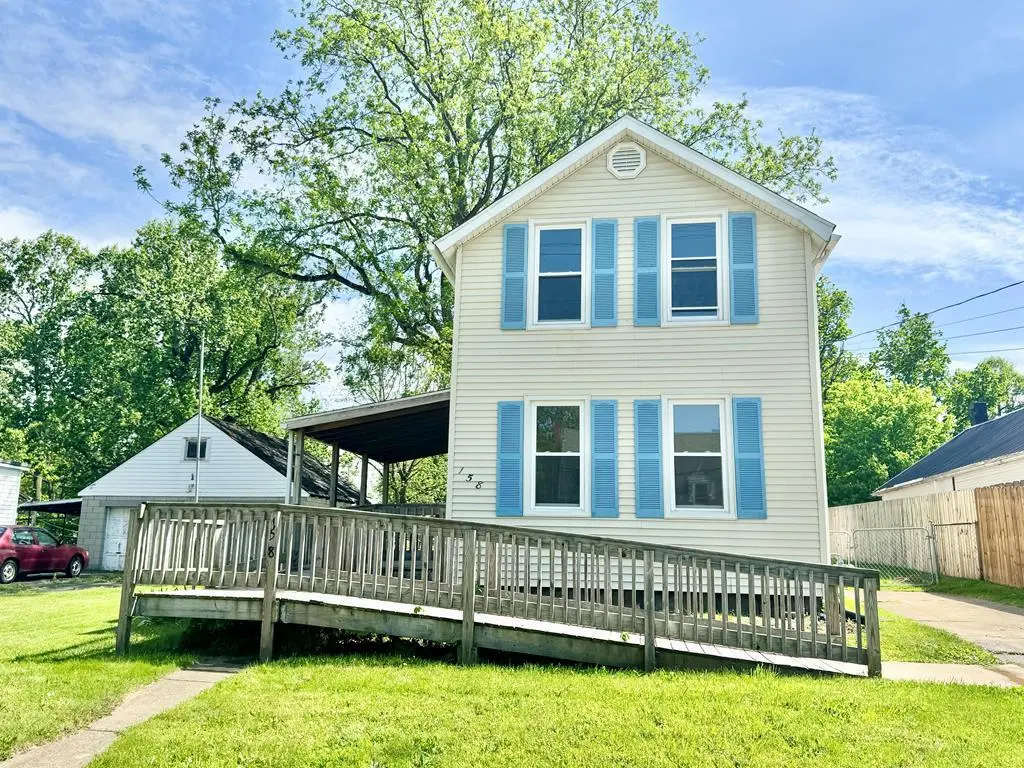
158 Ford St · Mansfield, OH
Flood risk 1/10 · Minimal
- FEMA flood zone
- X (unshaded)
- Chance of flooding over 30 yrs
- 0.0%
- Est. flood insurance / yr
- $473 – $860
Fire risk 1/10 · Minimal
- Est. fire insurance / yr
- $713 – $1,323
Heat risk 3/10 · Minor
- Hot days now (above 96°F)
- 7 days/yr
- Hot days in 30 yrs
- 17 days/yr
Wind risk 2/10 · Minimal
- Chance of severe wind over 30 yrs
- 0.0%
Air-quality risk 2/10 · Minimal
- Unhealthy air days now
- 1 days/yr
- Unhealthy air days in 30 yrs
- 1 days/yr
Risk factors via First Street. Map © Google.
Why this score? — see what drove the D- grade
The composite is a weighted blend of 9 inputs, each scored 0–100. Each bar is that input's sub-score; the figure is the points it added to the 100-point composite (weight × sub-score).
- Cash flow +10.1/30.0
- Appreciation +9.2/10.0
- Livability +3.8/5.0
- ARV discount +3.4/15.0
- DSCR +2.9/10.0
- Rent growth +2.5/5.0
- Condition / age +2.5/5.0
- Schools +2.3/10.0
- 1% rule +2.1/10.0
$129,000
🖨 Deal sheet 📄 Offer letter ✓ Due diligence
Listing remarks MLS
Don't hesitate to check this property out and see the possibilities. Ample living room, a second bathroom, and main-level laundry are a plus, not to mention the peaceful view out back. Room sizes are estimated.
Key facts
- Large vinyl windows
- Fresh paint
- New cabinetry
Tags
Property features AI
Exterior
- Parking: Concrete parking surface
- Utilities: Public water; Public sewer
- Home design: Single-family residence; 2 stories
- Construction: Vinyl siding construction
- Exterior features: Shed on the property; Composition roof
Interior
- Bathrooms: 2 full bathrooms
- Heating & cooling: Forced air heating; Natural gas heating
- Interior features: Eat-in kitchen; Full basement
Neighborhood map
What this means for you Summary
Snapshot
- This is a 2-bed/1.5-bath single-family listed at $129k.
Deal economics
- At list price, monthly cash flow is $-76 ($-908/yr) — negative.
- To cash-flow at today's rent, offer at most $116k (10.4% below list).
- To meet the 1% rule (rent ≥ 1% of price), the offer needs to be $91k (29.4% below list).
- Recommended offer: $91k (29.4% below list) — sets the bar for 1% rule.
- Cap rate 5.6% vs local median 4.2% in Mansfield — top-decile yield for the area; either an underpriced asset or a hidden risk that comps aren't pricing in. Stress-test before assuming the spread holds.
Location & tenants
- Location reads 76/100 on livability (#224 in OH, #3,525 nationally) — a middle-class / working-renter tenant base. Strengths: commute A+, cost of living A+, housing A+; Watch: schools C-, crime D-, amenities D-.
- Mansfield City (urban): math 24% / reading 33% proficiency, ranked #590 of 656 in OH (top 90%) — low school quality limits family demand, transient renter base, plan for 1-2y turnover; 80% free/reduced lunch — lower-income household profile, screen leases tightly.
- Market conditions: 30 active listings in the ZIP; 9 comparable units currently listed for rent nearby; rentals lingering (median 44d on market — plan ~5-8 weeks vacancy on turnover, expect pricing pressure); 100% of comp listings sitting > 30 days — soft ceiling on asking rent; lower-income renter base — watch delinquency; 145 units permitted in Richland County in 2024 (0 in 5+ unit buildings).
- This rent runs 35% of the median local income ($32k/yr) — at the standard rent-burdened threshold; future hikes will face affordability resistance.
Forward outlook
- In year one you build about $12k of equity ($892 loan paydown + $11k appreciation (8.4% local appreciation)).
- Richland County population projected at -18% by 2050 — secular population decline; favor cash flow + early exit over multi-decade hold.
- At projected returns (8.4% appreciation + 3.0% rent growth), your $36k cash investment doubles in ~3 years — after that, you're playing with house money.
- By year 4, paydown + projected appreciation supports a ~$41k cash-out refi (75% LTV) — recoverable capital for the next deal without selling this one.
Negotiation context
- It's been on market 29 days — a 2% lower offer ($127k) is reasonable based on typical stale-listing flexibility.
- 2 sale attempts since 5y ago with the ask held roughly flat each time — persistent listings suggest the price (not the market) is what's stuck; bring a comps-based counter.
- Current owner paid $16k; list at $129k implies a 719% gain — meaningful room to come down on a strong offer.
Risks & watch-outs
- Watch-outs: built in 1900 — expect roof / HVAC / electrical / plumbing capex.
Questions for the listing agent
- What do current leases actually rent for vs. the listed asking? Can we see a recent rent roll and the last 12 months of T-12 income?
- Built in 1900 — when were the roof, HVAC, electrical panel, plumbing, and water heater last replaced?
- Is there a deadline driving the sale (1031 exchange, divorce, estate, relocation)? That informs how much negotiation room exists.
- Crime grade is D in this area — have there been break-ins, vandalism, or insurance claims at this property in the last 3 years? What carrier currently insures it and at what premium?
- The area grade is low — what's the realistic commute time and amenity access for the typical tenant pool here? Any planned neighborhood developments (good or bad) we should know about?
- What's the average days-on-market for RENTAL listings here right now (not sales)? A rising rental-DOM trend means longer vacancies and softer asking-rent achievability than the comps imply.
- What's the recent tenant-quality profile in this submarket — average credit score on applications, eviction rate, late-payment / NSF rate, and stable-employment percentage? A property-management company in the area should have these aggregated.
- How much new for-sale + rental construction is in the pipeline within 1–3 miles? Heavy new supply typically softens prices + rents 12–24 months out; constrained supply supports both.
Investment metrics
- 1% rule
- 0.71% ✗
- Cap rate
- 5.59%
- Cash-on-cash
- -2.51%
- DSCR
- 0.89
- GRM
- 11.8
CMA / ARV
- ARV (on-the-fly)
- $118,272
- Comps found
- 12
Show comp detail 12 sales within ~0.75 mi
| Address | Dist | Beds/Ba | Sqft | Sold | Price | $/sf | Match |
|---|---|---|---|---|---|---|---|
| 148 Dale Ave | 0.18mi | 2/1.0 | 988 (+10%) | 10mo | $58,000 | $59 | 64 |
| 353 Home Ave | 0.45mi | 3/1.0 (+1) | 864 (-4%) | 6mo | $129,900 | $150 | 61 |
| 260 Dale Ave | 0.27mi | 3/1.0 (+1) | 1,008 (+12%) | 2mo | $65,000 | $64 | 58 |
| 34 W Raleigh Ave | 0.52mi | 2/1.0 | 795 (-11%) | 0mo | $120,000 | $151 | 55 |
| 133 Winwood Dr | 0.74mi | 2/2.0 | 864 (-4%) | 3mo | $177,000 | $205 | 55 |
| 26 Wolfe Ave | 0.48mi | 3/1.0 (+1) | 945 (+6%) | 9mo | $65,500 | $69 | 54 |
| 352 Remy Ave | 0.46mi | 2/1.0 | 768 (-14%) | 0mo | $120,000 | $156 | 52 |
| 410 Birdcage Walk | 0.49mi | 3/1.0 (+1) | 992 (+11%) | 0mo | $90,000 | $91 | 52 |
| 323 E 1st St | 0.63mi | 2/1.0 | 984 (+10%) | 3mo | $148,000 | $150 | 50 |
| 512 Harter Ave | 0.69mi | 2/1.0 | 1,000 (+12%) | 0mo | $98,500 | $99 | 46 |
| 33 Chilton Ave | 0.58mi | 2/1.0 | 772 (-14%) | 7mo | $102,000 | $132 | 42 |
| 151 Grover Ave | 0.59mi | 3/1.0 (+1) | 1,029 (+15%) | 3mo | $128,900 | $125 | 38 |
Match score weights: distance 35% · size 25% · config 20% · recency 20%. Top-matched comps best support the ARV.
Projected returns pro-forma
8.45% appreciation · 3.0% rent growth · sell at horizon
- IRR
- 19.1%
- Equity multiple
- 2.44×
- Total profit
- $52,029
- Equity at exit
- $101,995
- IRR
- 17.8%
- Equity multiple
- 5.28×
- Total profit
- $154,697
- Equity at exit
- $206,389
Cash invested: $36,120 (down + closing). Projections, not guarantees.
Landlord ↔ Tenant lean methodology
- Overall (STATE)
- 73 Landlord-Friendly
- State Ohio
- 73 Landlord-Friendly · R+6
- County
- — inherits STATE
- City
- — inherits STATE
ZIP-level market 44902
- Home prices YoY
- 2.9%
- Active inventory
- 30
- Price-to-rent
- 11.8×
Monthly cashflow live
- Estimated rent
- $911 high interval (Pro) →
- Mortgage (P&I)
- −$676
- Tax from tax record
- −$65 /mo · $781/yr
- Insurance
- −$54
- HOA
- −$0
- Vacancy / Maint / Mgmt
- −$191
- Net cashflow
- $-76
Break-even live
UW: 25.0% down · 7.5% · 30yr · 1.5% tax · 5.0% vac · 8.0% maint · 8.0% mgmt
Financing live
Cash to close
- Down payment
- $32,250
- Closing costs
- $3,870
- Reserves months
- —
- Total cash needed
- —
Loan-product check · same deal, 3 products live
Conventional
25% down · 7.5% · 30yr
- Down + closing
- —
- Monthly P&I
- —
- Monthly cashflow
- —
- DSCR
- —
- Eligible?
- —
Personal DTI + credit; lowest rate.
DSCR
20% down · 8.5% · 30yr
- Down + closing
- —
- Monthly P&I
- —
- Monthly cashflow
- —
- DSCR
- —
- Eligible?
- —
No personal income docs; deal must DSCR.
Hard money
10% down · 12.0% · 12mo
- Down + closing
- —
- Monthly P&I
- —
- Monthly cashflow
- —
- DSCR
- —
- Eligible?
- —
Short-term bridge; refi at stabilization.
Rent comps 9 comps
| Address | Beds | Baths | Sqft | Rent | $/sqft | DOM | Units | Dist |
|---|---|---|---|---|---|---|---|---|
| 19 State St Mansfield, OH | 3.0 | 1.0 | 1040 | $995 | $0.96 | 43d | 1 | 0.37mi |
| 100 Winwood Dr Mansfield, OH | 2.0 | 1.0 | 700 | $725 | $1.04 | 43d | 1 | 0.67mi |
| 282 Cliffbrook Dr Mansfield, OH | 3.0 | 1.0 | 912 | $1,395 | $1.53 | 43d | 1 | 0.79mi |
| 140 Wood St Mansfield, OH | 1.0 | 1.0 | 487 | $700 | $1.44 | 43d | 1 | 0.95mi |
| 135 E Cook Rd Mansfield, OH | 1.0–2.0 | 1.0 | 554 | $850 | $1.53 | 43d | 10 | 1.03mi |
| 131 Pleasant Ave Unit A Mansfield, OH | 1.0 | 1.0 | 550 | $650 | $1.18 | 43d | 1 | 1.08mi |
| 896 Brookfield Dr Mansfield, OH | 2.0 | 1.0 | 770 | $795 | $1.03 | 43d | 1 | 1.12mi |
| 38 Baldwin Ave Apt 3 Mansfield, OH | 1.0 | 1.0 | 800 | $800 | $1.00 | 43d | 1 | 1.30mi |
| 46 Bartley Ave Unit 46 1/2 Mansfield, OH | 1.0 | 1.0 | 800 | $750 | $0.94 | 43d | 1 | 1.32mi |
Listing history 19 events
-
2026-06-19days on market $129,000 Active 29 DOM
-
2026-06-18days on market $129,000 Active 28 DOM
-
2026-06-17days on market $129,000 Active 27 DOM
-
2026-06-16days on market $129,000 Active 26 DOM
-
2026-06-15days on market $129,000 Active 25 DOM
-
2026-06-14days on market $129,000 Active 23 DOM
-
2026-06-12days on market $129,000 Active 22 DOM
-
2026-06-09days on market $129,000 Active 19 DOM
-
2026-06-08days on market $129,000 Active 18 DOM
-
2026-06-07days on market $129,000 Active 17 DOM
-
2026-06-05days on market $129,000 Active 14 DOM
-
2026-06-03days on market $129,000 Active 13 DOM
-
2026-06-02days on market $129,000 Active 12 DOM
-
2026-06-01days on market $129,000 Active 11 DOM
-
2026-05-31days on market $129,000 Active 10 DOM
-
2026-05-30days on market $129,000 Active 9 DOM
-
2026-05-21$129,000 Active
-
2021-12-30soldstatus $15,750 210-char remark
Show marketing remark (210 chars)
Don't hesitate to check this property out and see the possibilities. Ample living room, a second bathroom, and main-level laundry are a plus, not to mention the peaceful view out back. Room sizes are estimated.
-
2021-12-15$22,000 210-char remark
Show marketing remark (210 chars)
Don't hesitate to check this property out and see the possibilities. Ample living room, a second bathroom, and main-level laundry are a plus, not to mention the peaceful view out back. Room sizes are estimated.
ⓘ Source: listings_history table (triggers on properties + properties_extension) + one-shot
backfill from property_details.listing_events for pre-trigger history.
Tax reassessment forecast OH · Partial reset (capped growth)
- Current annual tax
- $781 · $65/mo
- Projected year-2 tax
- $1,396 · $116/mo
- Expected delta
- +$616/yr (+$51/mo · 78.9%)
ⓘ Screening estimate from a state-policy table — verify with the county assessor before closing.
Climate risk First Street
- Flood 1/10 Low FEMA zone X (unshaded) · 0% chance over 30 yrs
- Wildfire 1/10 Low
- Heat 3/10 Moderate 7 d/yr ≥96°F today · 17 d/yr by 30 yrs out
- Wind 2/10 Low 0% chance of damaging wind over 30 yrs
- Air quality 2/10 Low 1 unhealthy d/yr today · 1 by 30 yrs out
Nearby sold comps map
Loading sold comps map…
Walkable amenities ~0.75 mi
Loading nearby amenities…
Taxation est. · year 1
- Rental income
- $10,931
- − Mortgage interest
- −$7,226
- − Property taxes
- −$781
- − Insurance
- −$645
- − Repairs & maintenance
- −$875
- − Management
- −$875
- − Depreciation
- −$3,753
- Taxable loss
- −$3,222
- Est. tax savings @ 24.0%
- +$773
- After-tax cash flow
- $-134/yr
For passive investors: Depreciation is non-cash, so a rental often shows a tax loss while cash-flowing — sheltering income. Rental losses are passive: they offset passive income freely, and up to $25,000/yr can offset ordinary (W-2) income if you actively participate and your MAGI is under $100k (phasing out to $0 by $150k); unused losses carry forward. On sale, claimed depreciation is recaptured at up to 25%, and gains may owe capital-gains tax (a 1031 exchange can defer both). Figures are a year-1 estimate at your 24.0% rate — not tax advice; consult a CPA.
Schools (NCES district)
- District
- Mansfield City
- NCES district ID
- 3904429
- Math proficiency
- 24% ▼ -19.00%
- Reading proficiency
- 33% ▼ -12.00%
- Median HH income
- $32,435
- Composite
- 23.25/100
- National rank
- #7934
- State rank
- #590 of 656 in OH
Livability — Mansfield
- Score
- 76/100
- State rank
- #224
- US rank
- #3525
Category grades
Schools grade is shown separately in the Schools card above.
Census & demographics
- Census place
- Mansfield, OH
- County
- Richland · 128,966 people
- City population
- 16,349
- Metro
- Mansfield, OH
- Population (ZIP)
- 4,876
- Household income
- $31,619
- Rent vs Own
- Severe rent burden
- 13.2
Population outlook (Richland County) Hauer SSP2
- Today (2025)
- 115,577 people
- By 2030
- 111,669 · -3.4%
- By 2040
- 103,323 · -10.6%
- By 2050
- 95,135 · -17.7%
- By 2075
- 76,719 · -33.6%
- By 2100
- 57,188 · -50.5%
Race, ethnicity, and origin ACS 2023
- Neighborhood character
- Diverse neighborhood (Simpson 0.61)
- Race & ethnicity
- White 52% Black 35% Two or more races 10% Hispanic / Latino 5%
- Common ancestry
- Italian 2% Serbian 2% Iranian 1%
- Foreign-born
- 1% · Canada
- Languages at home
- 95% English-only · Spanish 4% Other Indo-European 1%
Political lean MEDSL · Richland
- 2024 margin
- Solid R (+42.3) · D 28.4% · R 70.8%
- 2008→2024 swing
- -28.8pp toward R · 2008: -13.6pp · 2024: -42.3pp
- All cycles
- 2024: R+42.3 2020: R+39.7 2016: R+37.5 2012: R+20.1 2008: R+13.6
Not yet ingested
- Civics
- —
Market trends
- HPI YoY
- ▲ 8.45%
- Current HPI
- 302.035
- Rent YoY
- —
- Metro
- —
- State GDP YoY
- ▲ 1.98%
- F500 in state
- 48
Industry mix (Fortune 500 HQ in OH)
| Industry | F500 HQs | Revenue |
|---|---|---|
| Insurance | 3 | $145B |
|
||
| Industrial Machinery | 3 | $49B |
|
||
| Financial Services | 3 | $24B |
|
||
| Consumer Goods | 2 | $93B |
|
||
| Aerospace / Defense | 2 | $47B |
|
||
| Utilities | 2 | $33B |
|
||
Price history
+486.4% since first listed3 events — show timeline
- 2026-05-21 Listed $129,000 MARMLS
- 2021-12-30 Sold (MLS) $15,750 MARMLS
- 2021-12-15 Listed $22,000 MARMLS
Property tax history
+2.1%/yrLatest (2025): $781 · +0.0% YoY. Source: county tax records.
Cash-flow waterfall
monthlySold comps — $/sqft
last 12 mo · ≤1 miLoading sold comps…