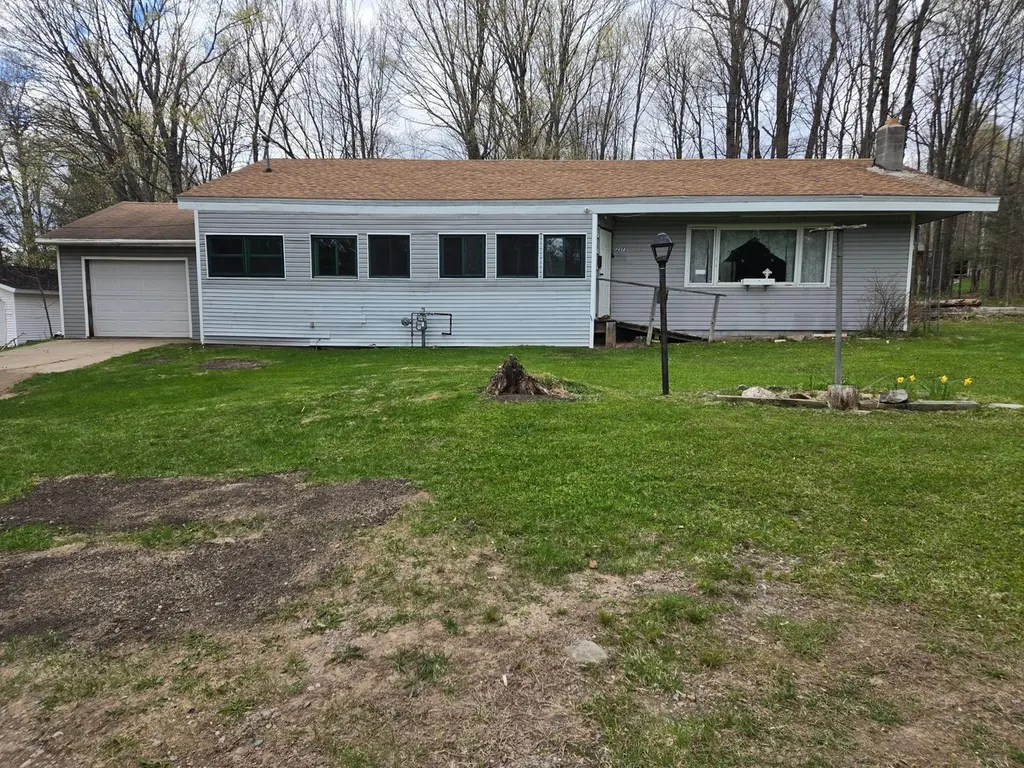
2372 Strong Rd · Phelps, WI
Flood risk 1/10 · Minimal
- FEMA flood zone
- X (unshaded)
- Chance of flooding over 30 yrs
- 0.0%
- Est. flood insurance / yr
- $473 – $860
Fire risk 3/10 · Minor
- Est. fire insurance / yr
- $636 – $1,182
Heat risk 1/10 · Minimal
- Hot days now (above 93°F)
- 7 days/yr
- Hot days in 30 yrs
- 12 days/yr
Wind risk 1/10 · Minimal
- Chance of severe wind over 30 yrs
- —
Air-quality risk 1/10 · Minimal
- Unhealthy air days now
- 0 days/yr
- Unhealthy air days in 30 yrs
- 0 days/yr
Risk factors via First Street. Map © Google.
Why this score? — see what drove the B+ grade
The composite is a weighted blend of 9 inputs, each scored 0–100. Each bar is that input's sub-score; the figure is the points it added to the 100-point composite (weight × sub-score).
- Cash flow +30.0/30.0
- DSCR +10.0/10.0
- Appreciation +9.1/10.0
- 1% rule +8.8/10.0
- ARV discount +7.5/15.0
- Schools +3.4/10.0
- Rent growth +2.5/5.0
- Livability +2.5/5.0
- Condition / age +2.5/5.0
$69,900
🖨 Deal sheet 📄 Offer letter ✓ Due diligence
Listing remarks
Welcome to an exceptional opportunity nestled in the serene setting of Phelps, Wisconsin! This charming 2-bedroom, 1-bathroom home invites you to reimagine and restore its potential. Situated in a great location close to the heart of Phelps, you'll enjoy easy access to local amenities while relishing the peace of country living. The house features a partial basement that offers added storage and upper floor access. Although sold "as is" and requiring extensive work, this property is perfect for those with a vision. Whether you're looking for your next renovation project or seeking to craft your dream getaway from scratch, this residence provides the ideal canvas. Surrounded by nat
Key facts
- Great location
- Natural beauty
- 0.61 acre lot
Tags
Property features AI
Exterior
- Parking: One-car garage; Total of one parking space
- Utilities: Public water; Public sewer; Electric service with circuit breakers
- Home design: Single family residence; One story
- Construction: Frame construction with wood siding; Block foundation; Composition/shingle roof; Built as a residential single-family home
- Exterior features: Level, private, secluded, wooded lot; Outbuilding on property; Public maintained road access via city street
Interior
- Kitchen: Electric oven; Electric range; Refrigerator
- Flooring: Carpet; Laminate
- Bathrooms: One full bathroom
- Heating & cooling: Forced air heating; Natural gas
- Interior features: Washer hookup in basement; Basement with interior entry, partial finish, and sump pump; No fireplace
- Laundry & utility: Washer; Dryer; Gas water heater
Neighborhood map
What this means for you Summary
Snapshot
- This is a 2-bed/1.0-bath other listed at $70k.
Deal economics
- At list price, monthly cash flow is $287 ($3k/yr) — positive.
- The deal already cash-flows at list — no discount required.
- Meets the 1% rule at list price ($965 rent vs $70k).
- Recommended offer: $68k (3.0% below list) — sets the bar for market timing.
Location & tenants
- Location reads: area grade B — affects rentability + tenant quality, not the cash-flow math above.
- Phelps School District (rural): math 40% / reading 35% proficiency, ranked #302 of 426 in WI (top 71%) — families likely to look elsewhere, expect single-tenant / working-renter base with shorter leases.
- Zoned schools: Phelps High (29 students, 48% FRL) — zoned schools at 48% FRL track the district average.
- Market conditions: 35 active listings in the ZIP; 359 units permitted in Vilas County in 2024 (67 in 5+ unit buildings).
Forward outlook
- In year one you build about $6k of equity ($483 loan paydown + $6k appreciation (8.2% local appreciation)).
- Vilas County population projected at -25% by 2050 — secular population decline; favor cash flow + early exit over multi-decade hold.
- At projected returns (8.2% appreciation + 3.0% rent growth), your $20k cash investment doubles in ~2 years — after that, you're playing with house money.
- By year 6, paydown + projected appreciation supports a ~$35k cash-out refi (75% LTV) — recoverable capital for the next deal without selling this one.
Negotiation context
- It's been on market 44 days — a 3% lower offer ($68k) is reasonable based on typical stale-listing flexibility.
- 3 sale attempts; this cycle's ask has dropped $19k (21%) from the opening price — seller is motivated, your offer sets the floor, not the list.
Questions for the listing agent
- It's been on market 44 days. Have you received any prior offers? Is the seller open to a 3% concession, seller financing, or rate buy-down credit?
- Built in 1970 — when were the roof, HVAC, electrical panel, plumbing, and water heater last replaced?
- Is there a deadline driving the sale (1031 exchange, divorce, estate, relocation)? That informs how much negotiation room exists.
- What's the average days-on-market for RENTAL listings here right now (not sales)? A rising rental-DOM trend means longer vacancies and softer asking-rent achievability than the comps imply.
- What's the recent tenant-quality profile in this submarket — average credit score on applications, eviction rate, late-payment / NSF rate, and stable-employment percentage? A property-management company in the area should have these aggregated.
- How much new for-sale + rental construction is in the pipeline within 1–3 miles? Heavy new supply typically softens prices + rents 12–24 months out; constrained supply supports both.
Investment metrics
- 1% rule
- 1.38% ✓
- Cap rate
- 11.22%
- Cash-on-cash
- 17.61%
- DSCR
- 1.78
- GRM
- 6.0
CMA / ARV
- ARV (median comp)
- $170,394
- List price
- $69,900
- Delta
- -58.98%
- Verdict
- UNDERPRICED
- Comps
- 12 within 1.0 mi
Projected returns pro-forma
8.25% appreciation · 3.0% rent growth · sell at horizon
- IRR
- 34.3%
- Equity multiple
- 3.46×
- Total profit
- $48,230
- Equity at exit
- $54,305
- IRR
- 30.4%
- Equity multiple
- 7.46×
- Total profit
- $126,421
- Equity at exit
- $108,961
Cash invested: $19,572 (down + closing). Projections, not guarantees.
Landlord ↔ Tenant lean methodology
- Overall (STATE)
- 73 Landlord-Friendly
- State Wisconsin
- 73 Landlord-Friendly · R+2
- County
- — inherits STATE
- City
- — inherits STATE
ZIP-level market 54554
- Home prices YoY
- 3.7%
- Active inventory
- 35
- Price-to-rent
- 6.0×
Monthly cashflow live
- Estimated rent
- $965 medium interval (Pro) →
- Mortgage (P&I)
- −$367
- Tax from tax record
- −$79 /mo · $954/yr
- Insurance
- −$29
- HOA
- −$0
- Vacancy / Maint / Mgmt
- −$203
- Net cashflow
- $287
Break-even live
UW: 25.0% down · 7.5% · 30yr · 1.5% tax · 5.0% vac · 8.0% maint · 8.0% mgmt
Financing live
Cash to close
- Down payment
- $17,475
- Closing costs
- $2,097
- Reserves months
- —
- Total cash needed
- —
Loan-product check · same deal, 3 products live
Conventional
25% down · 7.5% · 30yr
- Down + closing
- —
- Monthly P&I
- —
- Monthly cashflow
- —
- DSCR
- —
- Eligible?
- —
Personal DTI + credit; lowest rate.
DSCR
20% down · 8.5% · 30yr
- Down + closing
- —
- Monthly P&I
- —
- Monthly cashflow
- —
- DSCR
- —
- Eligible?
- —
No personal income docs; deal must DSCR.
Hard money
10% down · 12.0% · 12mo
- Down + closing
- —
- Monthly P&I
- —
- Monthly cashflow
- —
- DSCR
- —
- Eligible?
- —
Short-term bridge; refi at stabilization.
Listing history 17 events
-
2026-06-16status $69,900 Pending 44 DOM
-
2026-06-15days on market $69,900 Active 44 DOM
-
2026-06-15days on market $69,900 Active 43 DOM
-
2026-06-13days on market $69,900 Active 42 DOM
-
2026-06-12days on market $69,900 Active 41 DOM
-
2026-06-09days on market $69,900 Active 38 DOM
-
2026-06-08days on market $69,900 Active 37 DOM
-
2026-06-08days on market $69,900 Active 36 DOM
-
2026-06-05days on market $69,900 Active 34 DOM
-
2026-06-03pricedays on market $69,900 Active 32 DOM
-
2026-06-02days on market $89,000 Active 31 DOM
-
2026-06-01days on market $89,000 Active 30 DOM
-
2026-05-31days on market $89,000 Active 29 DOM
-
2026-05-02$89,000 Active 973-char remark
-
2026-04-03status Active
-
2026-02-18historical Active Under Contract
-
2026-02-16$99,000 Active
ⓘ Source: listings_history table (triggers on properties + properties_extension) + one-shot
backfill from property_details.listing_events for pre-trigger history.
Tax reassessment forecast WI · Partial reset (capped growth)
- Current annual tax
- $954 · $79/mo
- Projected year-2 tax
- $1,123 · $94/mo
- Expected delta
- +$170/yr (+$14/mo · 17.8%)
ⓘ Screening estimate from a state-policy table — verify with the county assessor before closing.
Climate risk First Street
- Flood 1/10 Low FEMA zone X (unshaded) · 0% chance over 30 yrs
- Wildfire 3/10 Moderate
- Heat 1/10 Low 7 d/yr ≥93°F today · 12 d/yr by 30 yrs out
- Wind 1/10 Low
- Air quality 1/10 Low 0 unhealthy d/yr today · 0 by 30 yrs out
Nearby sold comps map
Loading sold comps map…
Walkable amenities ~0.75 mi
Loading nearby amenities…
Taxation est. · year 1
- Rental income
- $11,582
- − Mortgage interest
- −$3,915
- − Property taxes
- −$954
- − Insurance
- −$350
- − Repairs & maintenance
- −$927
- − Management
- −$927
- − Depreciation
- −$2,033
- Taxable income
- $2,476
- Est. tax owed @ 24.0%
- −$594
- After-tax cash flow
- $2,853/yr
For passive investors: Depreciation is non-cash, so a rental often shows a tax loss while cash-flowing — sheltering income. Rental losses are passive: they offset passive income freely, and up to $25,000/yr can offset ordinary (W-2) income if you actively participate and your MAGI is under $100k (phasing out to $0 by $150k); unused losses carry forward. On sale, claimed depreciation is recaptured at up to 25%, and gains may owe capital-gains tax (a 1031 exchange can defer both). Figures are a year-1 estimate at your 24.0% rate — not tax advice; consult a CPA.
Schools (NCES district)
- District
- Phelps School District
- NCES district ID
- 5511710
- Math proficiency
- 40% ▲ 10.00%
- Reading proficiency
- 35% ▲ 5.00%
- Median HH income
- $37,803
- Composite
- 33.79/100
- National rank
- #10394
- State rank
- #302 of 426 in WI
Livability — Phelps
No livability data for this city. (Only ~50 U.S. cities are tracked.)
Census & demographics
- Population (ZIP)
- 1,099
Population outlook (Vilas County) Hauer SSP2
- Today (2025)
- 20,499 people
- By 2030
- 19,683 · -4.0%
- By 2040
- 17,559 · -14.3%
- By 2050
- 15,407 · -24.8%
- By 2075
- 13,010 · -36.5%
- By 2100
- 10,937 · -46.6%
Race, ethnicity, and origin ACS 2023
- Neighborhood character
- Predominantly White (90%)
- Race & ethnicity
- White 90% Two or more races 7% Hispanic / Latino 3% Native American 2% Asian 1%
- Common ancestry
- Romanian 13% Portuguese 6% Iranian 1%
- Foreign-born
- 2%
- Languages at home
- 98% English-only · Spanish 1% Tagalog/Filipino 1%
Political lean MEDSL · Vilas
- 2024 margin
- Strong R (+23.1) · D 38.0% · R 61.1%
- 2008→2024 swing
- -19.0pp toward R · 2008: -4.1pp · 2024: -23.1pp
- All cycles
- 2024: R+23.1 2020: R+21.9 2016: R+25.3 2012: R+13.1 2008: R+4.1
Not yet ingested
- Civics
- —
Market trends
- HPI YoY
- ▲ 8.25%
- Current HPI
- 232.9527
- Rent YoY
- —
- Metro
- —
- State GDP YoY
- ▲ 2.10%
- F500 in state
- 20
Industry mix (Fortune 500 HQ in WI)
| Industry | F500 HQs | Revenue |
|---|---|---|
| Industrial Machinery | 4 | $23B |
|
||
| Industrial Technology | 2 | $36B |
|
||
| Insurance | 1 | $36B |
|
||
| Professional Services | 1 | $19B |
|
||
| Utilities | 1 | $9B |
|
||
| Consumer Goods | 1 | $3B |
|
||
Price history
-29.4% since first listed6 events — show timeline
- 2026-06-16 Pending — GNMLS
- 2026-06-03 Price Changed $69,900 GNMLS
- 2026-05-02 Listed $89,000 GNMLS
- 2026-04-03 Relisted — GNMLS
- 2026-02-18 Contingent — GNMLS
- 2026-02-16 Listed $99,000 GNMLS
Property tax history
-0.3%/yrLatest (2025): $954 · +7.3% YoY. Source: county tax records.
Cash-flow waterfall
monthlySold comps — $/sqft
last 12 mo · ≤1 miLoading sold comps…