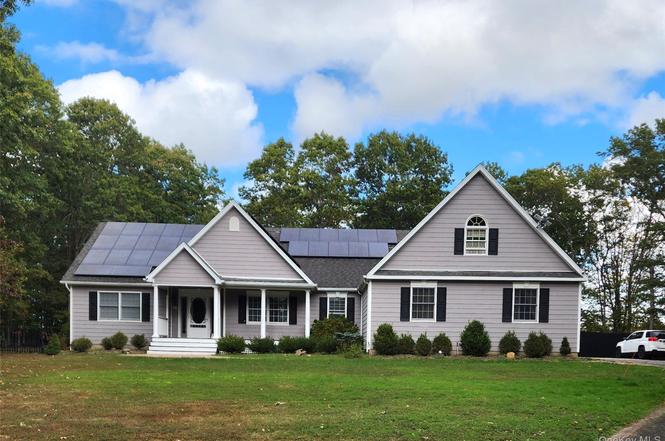
156 N Woods Rd · Calverton, NY
Flood risk 1/10 · Minimal
- FEMA flood zone
- X (unshaded)
- Chance of flooding over 30 yrs
- 0.0%
- Est. flood insurance / yr
- $473 – $860
Fire risk 2/10 · Minimal
- Est. fire insurance / yr
- $691 – $1,283
Heat risk 4/10 · Minor
- Hot days now (above 93°F)
- 6 days/yr
- Hot days in 30 yrs
- 16 days/yr
Wind risk 8/10 · Major
- Chance of severe wind over 30 yrs
- 80.0%
Air-quality risk 3/10 · Minor
- Unhealthy air days now
- 2 days/yr
- Unhealthy air days in 30 yrs
- 3 days/yr
Risk factors via First Street. Map © Google.
Why this score? — see what drove the D grade
The composite is a weighted blend of 9 inputs, each scored 0–100. Each bar is that input's sub-score; the figure is the points it added to the 100-point composite (weight × sub-score).
- Cash flow +10.7/30.0
- ARV discount +7.5/15.0
- Appreciation +6.6/10.0
- Schools +3.6/10.0
- 1% rule +3.1/10.0
- DSCR +3.1/10.0
- Livability +2.9/5.0
- Rent growth +2.5/5.0
- Condition / age +2.5/5.0
$925,000
🖨 Deal sheet 📄 Offer letter ✓ Due diligence
Listing remarks MLS
If you're ready for a life of leisure and luxury, then welcome home to this opulent 3 Bed, 2 Bath Ranch that features a 3-Car Garage, a breath-taking Backyard Oasis, and the comfort of Total Privacy. Upon arrival, you'll be greeted by the Manicured Gardens and cozy Front Porch, leading you to the entryway adorned with Oak floors and Cathedral Ceilings. Connected to that is the spacious living room, which faces a gorgeous Mendota Gas Fireplace. The heart of this home however, is the Gourmet Kitchen featuring Silestone Counters, a Butcher-Block Island, and Top-of-the-Line Stainless Steel Appliances, including a 5-Burner F. Bertanzoni Range with Hood Vent. Oak floors continue through each bedroom with the highlight of the Master Suite being the Jacuzzi Tub area and Heated Tile Floors. With a .96 Acre Fully-Fenced property which backs to a 29-Acre Nature Preserve, the outside is just as amazing as the inside. From the all-seasons Enclosed Sunroom, you'll see the beautiful paver Patio which surrounds the Heated and Lit Salt Water Pool. With a Poolside Fireplace and renovated Cabana to boot, summer's feel like you're at a private resort. Treat yourself to the opportunity of a lifetime and schedule a showing today!, Additional information: Appearance:Mint,Separate Hotwater Heater:Yes
Key facts
- 0.96 acre lot
- Pool
- Built 2002
Property features AI
Exterior
- Parking: Driveway
- Utilities: Electricity connected (PSEG); Cesspool sewer
- Home design: Single family residence; One level
- Construction: Frame construction; Concrete perimeter foundation
- Exterior features: Fenced yard; Private in-ground pool
Interior
- Kitchen: Dishwasher; Refrigerator; ENERGY STAR qualified appliances; Granite counters; Pantry; Eat-in kitchen
- Bedrooms: Bedroom on first floor
- Flooring: Hardwood floors
- Bathrooms: 3 full bathrooms
- Heating & cooling: Hot water heating; Oil heating; ENERGY STAR qualified cooling equipment
- Interior features: First-floor bedroom; Cathedral ceilings; Central vacuum; Eat-in kitchen; Formal dining room; Granite counters; Pantry; Walk-in closets; Full basement; Full walkup attic; 13 total rooms
- Laundry & utility: Washer; Dryer; Central vacuum
Neighborhood map
What this means for you Summary
Snapshot
- This is a 3-bed/2.0-bath single-family listed at $925k.
Deal economics
- At list price, monthly cash flow is $-439 ($-5k/yr) — negative.
- To cash-flow at today's rent, offer at most $847k (8.4% below list).
- To meet the 1% rule (rent ≥ 1% of price), the offer needs to be $750k (18.9% below list).
- Recommended offer: $750k (18.9% below list) — sets the bar for 1% rule.
- Cap rate 5.7% vs local median 7.2% in Calverton — below-typical yield; the buyer is paying a premium for something (appreciation thesis, condition, location) that the cap rate doesn't capture.
Location & tenants
- Location reads 58/100 on livability (#1,053 in NY) — a working-class tenant base; expect higher turnover. Watch: crime C-, employment D, amenities F.
- Riverhead Central School District (suburban): math 34% / reading 48% proficiency, ranked #489 of 590 in NY (top 83%) — families likely to look elsewhere, expect single-tenant / working-renter base with shorter leases.
- Zoned schools: Riley Avenue School (math 42% / reading 52%, grade D-, #1,195 of 2,108 statewide, top 60%, 461 students, 34% FRL); Riverhead Middle School (math 18% / reading 35%, grade F, #594 of 729 statewide, top 81%, 827 students, 57% FRL); Riverhead Senior High School (math 80% / reading 86%, grade A, #440 of 1,100 statewide, top 40%, 2,001 students, 52% FRL).
- Market conditions: 84 active listings in the ZIP; 1 comparable units currently listed for rent nearby; 1,366 units permitted in Suffolk County in 2024 (216 in 5+ unit buildings).
Forward outlook
- In year one you build about $37k of equity ($6k loan paydown + $30k appreciation (3.3% local appreciation)).
- Suffolk County population projected to shrink 5% by 2050 — rents likely to lag national; underwrite the cash flow, not the appreciation.
- By year 2, paydown + projected appreciation supports a ~$59k cash-out refi (75% LTV) — recoverable capital for the next deal without selling this one.
Negotiation context
- It's been on market 78 days — a 6% lower offer ($870k) is reasonable based on typical stale-listing flexibility.
- 4 sale attempts since 14y ago with the ask held roughly flat each time — persistent listings suggest the price (not the market) is what's stuck; bring a comps-based counter.
- Current owner paid $768k; 20% above their basis — modest negotiation headroom, anchor on the comps not their cost.
Risks & watch-outs
- Climate carrying-cost: severe wind risk, 80% chance of damaging wind over 30y — expect insurance premiums to compound above CPI over the hold.
Questions for the listing agent
- What do current leases actually rent for vs. the listed asking? Can we see a recent rent roll and the last 12 months of T-12 income?
- It's been on market 78 days. Have you received any prior offers? Is the seller open to a 19% concession, seller financing, or rate buy-down credit?
- Why hasn't it sold? Are there any deal-killer items the seller is aware of (foundation, flood, title, zoning, code violations)?
- Is there a deadline driving the sale (1031 exchange, divorce, estate, relocation)? That informs how much negotiation room exists.
- Schools are D-rated, which usually means shorter tenancies and higher turnover. Who's the typical renter profile here, and what's been the actual vacancy rate?
- The area grade is low — what's the realistic commute time and amenity access for the typical tenant pool here? Any planned neighborhood developments (good or bad) we should know about?
- What's the average days-on-market for RENTAL listings here right now (not sales)? A rising rental-DOM trend means longer vacancies and softer asking-rent achievability than the comps imply.
- What's the recent tenant-quality profile in this submarket — average credit score on applications, eviction rate, late-payment / NSF rate, and stable-employment percentage? A property-management company in the area should have these aggregated.
- How much new for-sale + rental construction is in the pipeline within 1–3 miles? Heavy new supply typically softens prices + rents 12–24 months out; constrained supply supports both.
Investment metrics
- 1% rule
- 0.81% ✗
- Cap rate
- 5.72%
- Cash-on-cash
- -2.03%
- DSCR
- 0.91
- GRM
- 10.3
CMA / ARV
- ARV (on-the-fly)
- $587,328
- Comps found
- 7
Show comp detail 7 sales within ~0.75 mi
| Address | Dist | Beds/Ba | Sqft | Sold | Price | $/sf | Match |
|---|---|---|---|---|---|---|---|
| 1 Mastro Ct | 0.12mi | 3/2.0 | 2,104 (+9%) | 10mo | $1,115,000 | $530 | 71 |
| 74 Mastro Ct | 0.27mi | 3/2.5 | 1,822 (-6%) | 14mo | $720,000 | $395 | 64 |
| 1407 Middle Rd #88 | 0.59mi | 3/2.0 | 2,000 (+4%) | 8mo | $381,000 | $191 | 61 |
| 1532 Middle Rd | 0.43mi | 3/2.0 | 2,013 (+4%) | 18mo | $612,000 | $304 | 58 |
| 1407 - 263 Middle Rd #263 | 0.59mi | 3/3.0 | 2,000 (+4%) | 11mo | $435,000 | $218 | 54 |
| 1407- 234 Middle Rd #234 | 0.59mi | 3/2.0 | 2,000 (+4%) | 22mo | $449,000 | $225 | 48 |
| 11 N Woods Rd | 0.32mi | 4/2.5 (+1) | 2,159 (+12%) | 24mo | $840,000 | $389 | 39 |
Match score weights: distance 35% · size 25% · config 20% · recency 20%. Top-matched comps best support the ARV.
Projected returns pro-forma
3.26% appreciation · 3.0% rent growth · sell at horizon
- IRR
- 6.4%
- Equity multiple
- 1.37×
- Total profit
- $96,351
- Equity at exit
- $429,507
- IRR
- 9.1%
- Equity multiple
- 2.42×
- Total profit
- $366,774
- Equity at exit
- $672,684
Cash invested: $259,000 (down + closing). Projections, not guarantees.
Landlord ↔ Tenant lean methodology
- Overall (STATE)
- 15 Strongly Tenant-Friendly
- State New York
- 15 Strongly Tenant-Friendly · D+10
- County
- — inherits STATE
- City
- — inherits STATE
ZIP-level market 11933
- Home prices YoY
- 0.8%
- Active inventory
- 84
- Price-to-rent
- 10.3×
Monthly cashflow live
- Estimated rent
- $7,500 medium interval (Pro) →
- Mortgage (P&I)
- −$4,851
- Tax from tax record
- −$1,128 /mo · $13,531/yr
- Insurance
- −$385
- HOA
- −$0
- Vacancy / Maint / Mgmt
- −$1,575
- Net cashflow
- $-439
Break-even live
UW: 25.0% down · 7.5% · 30yr · 1.5% tax · 5.0% vac · 8.0% maint · 8.0% mgmt
Financing live
Cash to close
- Down payment
- $231,250
- Closing costs
- $27,750
- Reserves months
- —
- Total cash needed
- —
Loan-product check · same deal, 3 products live
Conventional
25% down · 7.5% · 30yr
- Down + closing
- —
- Monthly P&I
- —
- Monthly cashflow
- —
- DSCR
- —
- Eligible?
- —
Personal DTI + credit; lowest rate.
DSCR
20% down · 8.5% · 30yr
- Down + closing
- —
- Monthly P&I
- —
- Monthly cashflow
- —
- DSCR
- —
- Eligible?
- —
No personal income docs; deal must DSCR.
Hard money
10% down · 12.0% · 12mo
- Down + closing
- —
- Monthly P&I
- —
- Monthly cashflow
- —
- DSCR
- —
- Eligible?
- —
Short-term bridge; refi at stabilization.
Rent comps 1 comps
| Address | Beds | Baths | Sqft | Rent | $/sqft | DOM | Units | Dist |
|---|---|---|---|---|---|---|---|---|
| 16 Mastro Ct Calverton, NY | 3.0 | 2.5 | 1822 | $7,500 | $4.12 | 1d | 1 | 0.13mi |
Listing history 13 events
-
2026-06-18days on market $925,000 Active 78 DOM
-
2026-06-17days on market $925,000 Active 77 DOM
-
2026-06-16days on market $925,000 Active 76 DOM
-
2026-06-15days on market $925,000 Active 75 DOM
-
2026-06-13days on market $925,000 Active 73 DOM
-
2026-06-09days on market $925,000 Active 69 DOM
-
2026-06-08days on market $925,000 Active 68 DOM
-
2026-06-07days on market $925,000 Active 67 DOM
-
2026-06-04days on market $925,000 Active 64 DOM
-
2026-06-03days on market $925,000 Active 63 DOM
-
2026-06-02pricedays on market $925,000 Active 62 DOM
-
2026-06-02remarks 666-char remark
-
2026-06-02$899,988 Active 61 DOM
ⓘ Source: listings_history table (triggers on properties + properties_extension) + one-shot
backfill from property_details.listing_events for pre-trigger history.
Tax reassessment forecast NY · Partial reset (capped growth)
- Current annual tax
- $13,531 · $1,128/mo
- Projected year-2 tax
- $14,582 · $1,215/mo
- Expected delta
- +$1,051/yr (+$88/mo · 7.8%)
ⓘ Screening estimate from a state-policy table — verify with the county assessor before closing.
Climate risk First Street
- Flood 1/10 Low FEMA zone X (unshaded) · 0% chance over 30 yrs
- Wildfire 2/10 Low
- Heat 4/10 Moderate 6 d/yr ≥93°F today · 16 d/yr by 30 yrs out
- Wind 8/10 Severe 80% chance of damaging wind over 30 yrs
- Air quality 3/10 Moderate 2 unhealthy d/yr today · 3 by 30 yrs out
Nearby sold comps map
Loading sold comps map…
Walkable amenities ~0.75 mi
Loading nearby amenities…
Taxation est. · year 1
- Rental income
- $90,000
- − Mortgage interest
- −$51,814
- − Property taxes
- −$13,531
- − Insurance
- −$4,625
- − Repairs & maintenance
- −$7,200
- − Management
- −$7,200
- − Depreciation
- −$26,909
- Taxable loss
- −$21,279
- Est. tax savings @ 24.0%
- +$5,107
- After-tax cash flow
- $-158/yr
For passive investors: Depreciation is non-cash, so a rental often shows a tax loss while cash-flowing — sheltering income. Rental losses are passive: they offset passive income freely, and up to $25,000/yr can offset ordinary (W-2) income if you actively participate and your MAGI is under $100k (phasing out to $0 by $150k); unused losses carry forward. On sale, claimed depreciation is recaptured at up to 25%, and gains may owe capital-gains tax (a 1031 exchange can defer both). Figures are a year-1 estimate at your 24.0% rate — not tax advice; consult a CPA.
Schools (NCES district)
- District
- Riverhead Central School District
- NCES district ID
- 3624690
- Math proficiency
- 34% ▼ -4.00%
- Reading proficiency
- 48% ▲ 13.00%
- Median HH income
- $61,607
- Composite
- 36.38/100
- National rank
- #4683
- State rank
- #489 of 590 in NY
Livability — Calverton
- Score
- 58/100
- State rank
- #1053
- US rank
- #20908
Category grades
Schools grade is shown separately in the Schools card above.
Census & demographics
- Census place
- Calverton, NY
- City population
- 6,784
- Population (ZIP)
- 6,784
Population outlook (Suffolk County) Hauer SSP2
- Today (2025)
- 1,505,262 people
- By 2030
- 1,498,318 · -0.5%
- By 2040
- 1,471,101 · -2.3%
- By 2050
- 1,424,848 · -5.3%
- By 2075
- 1,337,157 · -11.2%
- By 2100
- 1,217,720 · -19.1%
Race, ethnicity, and origin ACS 2023
- Neighborhood character
- Predominantly White (79%)
- Race & ethnicity
- White 79% Hispanic / Latino 10% Black 8% Two or more races 2% Asian 1%
- Hispanic origin (detail)
- Puerto Rican 1% Dominican 4%
- Common ancestry
- Romanian 5% Lithuanian 3% Iranian 1%
- Foreign-born
- 11% · Canada, Jamaica, South Korea
- Languages at home
- 85% English-only · Spanish 10% Other Indo-European 3% German/W. Germanic 1%
Political lean MEDSL · Suffolk
- 2024 margin
- Lean R (+10.0) · D 45.0% · R 55.0%
- 2008→2024 swing
- -16.0pp toward R · 2008: 6.0pp · 2024: -10.0pp
- All cycles
- 2024: R+10.0 2020: R+0.0 2016: R+8.2 2012: D+2.9 2008: D+6.0
Not yet ingested
- Civics
- —
Market trends
- HPI YoY
- ▲ 3.26%
- Current HPI
- 397.7148
- Rent YoY
- —
- Metro
- —
- State GDP YoY
- ▲ 2.60%
- F500 in state
- 92
Industry mix (Fortune 500 HQ in NY)
| Industry | F500 HQs | Revenue |
|---|---|---|
| Financial Services | 10 | $950B |
|
||
| Consumer Goods | 9 | $162B |
|
||
| Insurance | 4 | $225B |
|
||
| Telecommunications | 2 | $144B |
|
||
| Pharmaceuticals | 2 | $112B |
|
||
| Media / Entertainment | 2 | $69B |
|
||
Price history
+115.6% since first listed11 events — show timeline
- 2026-06-02 Price Changed $925,000 OneKey® MLS as Distributed by MLS Grid
- 2026-06-01 Relisted — OneKey® MLS as Distributed by MLS Grid
- 2025-10-19 Listed $899,988 OneKey® MLS as Distributed by MLS Grid
- 2025-10-12 Coming Soon $899,988 OneKey® MLS as Distributed by MLS Grid
- 2024-04-04 Sold (Public Records) $768,000 Public Records
- 2024-03-01 Sold (MLS) $768,000 OneKey® MLS as Distributed by MLS Grid
- 2023-12-29 Pending — OneKey® MLS as Distributed by MLS Grid
- 2023-11-14 Price Changed $779,000 OneKey® MLS as Distributed by MLS Grid
- 2023-10-14 Listed $799,000 OneKey® MLS as Distributed by MLS Grid
- 2012-04-24 Listing Removed — OneKey® MLS as Distributed by MLS Grid
- 2012-03-26 Listed $429,000 OneKey® MLS as Distributed by MLS Grid
Property tax history
+2.9%/yrLatest (2025): $13,531 · +0.0% YoY. Source: county tax records.
Cash-flow waterfall
monthlySold comps — $/sqft
last 12 mo · ≤1 miLoading sold comps…