122 Carolina Ave · Chester, WV
Flood risk 6/10 · Moderate
- FEMA flood zone
- X (unshaded)
- Chance of flooding over 30 yrs
- 0.65%
- Est. flood insurance / yr
- $473 – $860
Fire risk 3/10 · Minor
- Est. fire insurance / yr
- $787 – $1,461
Heat risk 4/10 · Minor
- Hot days now (above 97°F)
- 8 days/yr
- Hot days in 30 yrs
- 19 days/yr
Wind risk 1/10 · Minimal
- Chance of severe wind over 30 yrs
- —
Air-quality risk 2/10 · Minimal
- Unhealthy air days now
- 1 days/yr
- Unhealthy air days in 30 yrs
- 2 days/yr
Risk factors via First Street. Map © Google.
Why this score? — see what drove the C- grade
The composite is a weighted blend of 9 inputs, each scored 0–100. Each bar is that input's sub-score; the figure is the points it added to the 100-point composite (weight × sub-score).
- ARV discount +15.0/15.0
- Cash flow +12.3/30.0
- Appreciation +6.3/10.0
- DSCR +3.7/10.0
- Livability +3.7/5.0
- Schools +3.4/10.0
- 1% rule +2.5/10.0
- Rent growth +2.5/5.0
- Condition / age +2.5/5.0
$95,000
🖨 Deal sheet (PDF) 📄 Offer letter ✓ Due diligence
Listing remarks
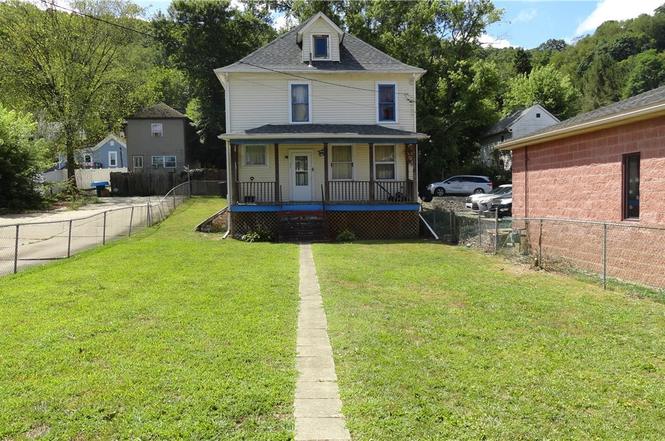
Large 3 bedroom home with large fenced FLAT yard on main street through town. Large front porch to enjoy the parades and fireworks. Home sits towards rear of lot, so it has a huge front yard completely fenced with chain link. Parking on street or in alley. Family home that has seen lots of love and memories, now ready for you to add your personal touches and start making NEW memories. Conveniently located to restaurants and shopping. Per seller new roof 5 years ago, new furnace more recently.
Key facts
- Large front porch
- Fenced flat yard
- Huge front yard
Tags
Property features AI
Exterior
- Parking: Alley access and on-street parking
- Utilities: Public water; Public sewer
- Home design: 2-story frame home with vinyl siding
- Construction: Built (year per assessor); Asphalt/fiberglass roof
- Exterior features: Front and back yard; Chain link fencing in yard; City lot
Interior
- Kitchen: Eat-in kitchen on the first floor
- Bedrooms: Three bedrooms on the second floor
- Flooring: Carpet in living areas and most bedrooms; Linoleum in bathrooms and kitchen
- Bathrooms: One full bathroom; One half bathroom
- Heating & cooling: Forced-air gas heating; Wall/Window cooling units
- Interior features: Full basement; 1/2 bath located in the dining room; Laundry located in the foyer
- Laundry & utility: Laundry in foyer
Neighborhood map
What this means for you Summary
Snapshot
- This is a 3-bed/1.5-bath single-family listed at $95k.
Deal economics
- At list price, monthly cash flow is $-17 ($-204/yr) — negative.
- To cash-flow at today's rent, offer at most $92k (3.2% below list).
- To meet the 1% rule (rent ≥ 1% of price), the offer needs to be $71k (25.0% below list).
- Recommended offer: $71k (25.0% below list) — sets the bar for 1% rule.
Location & tenants
- Location reads 73/100 on livability (#36 in WV, #5,000 nationally) — a middle-class / working-renter tenant base. Strengths: crime A+, cost of living A+, housing A+; Watch: schools D, amenities F, commute F.
- Hancock County Schools (urban): math 37% / reading 43% proficiency, ranked #7 of 55 in WV (top 13%) — families likely to look elsewhere, expect single-tenant / working-renter base with shorter leases.
- Market conditions: 17 active listings in the ZIP; 2 comparable units currently listed for rent nearby; 15 units permitted in Hancock County in 2024 (0 in 5+ unit buildings).
Forward outlook
- In year one you build about $3k of equity ($657 loan paydown + $2k appreciation (2.5% local appreciation)).
- Hancock County population projected at -15% by 2050 — secular population decline; favor cash flow + early exit over multi-decade hold.
- At projected returns (2.5% appreciation + 3.0% rent growth), your $27k cash investment doubles in ~8 years — after that, you're playing with house money.
Negotiation context
- It's been on market 315 days — a 12% lower offer ($84k) is reasonable based on typical stale-listing flexibility.
Risks & watch-outs
- Watch-outs: built in 1900 — expect roof / HVAC / electrical / plumbing capex.
- Climate carrying-cost: major flood risk — expect insurance premiums to compound above CPI over the hold.
Questions for the listing agent
- What do current leases actually rent for vs. the listed asking? Can we see a recent rent roll and the last 12 months of T-12 income?
- It's been on market 315 days. Have you received any prior offers? Is the seller open to a 25% concession, seller financing, or rate buy-down credit?
- Built in 1900 — when were the roof, HVAC, electrical panel, plumbing, and water heater last replaced?
- Why hasn't it sold? Are there any deal-killer items the seller is aware of (foundation, flood, title, zoning, code violations)?
- Is there a deadline driving the sale (1031 exchange, divorce, estate, relocation)? That informs how much negotiation room exists.
- Schools are D-rated, which usually means shorter tenancies and higher turnover. Who's the typical renter profile here, and what's been the actual vacancy rate?
- What's the average days-on-market for RENTAL listings here right now (not sales)? A rising rental-DOM trend means longer vacancies and softer asking-rent achievability than the comps imply.
- What's the recent tenant-quality profile in this submarket — average credit score on applications, eviction rate, late-payment / NSF rate, and stable-employment percentage? A property-management company in the area should have these aggregated.
- How much new for-sale + rental construction is in the pipeline within 1–3 miles? Heavy new supply typically softens prices + rents 12–24 months out; constrained supply supports both.
Investment metrics
- 1% rule
- 0.75% ✗
- Cap rate
- 6.08%
- Cash-on-cash
- -0.77%
- DSCR
- 0.97
- GRM
- 11.1
CMA / ARV
- ARV (on-the-fly)
- $120,848
- Comps found
- 9
Show comp detail 9 sales within ~0.75 mi
| Address | Dist | Beds/Ba | Sqft | Sold | Price | $/sf | Match |
|---|---|---|---|---|---|---|---|
| 340 Indiana Ave | 0.35mi | 3/2.0 | 1,518 (+4%) | 2mo | $110,000 | $72 | 73 |
| 147 Indiana Ave. Ave | 0.10mi | 3/1.0 | 1,319 (-9%) | 10mo | $135,000 | $102 | 69 |
| 420 Vine St | 0.73mi | 3/1.5 | 1,440 (-1%) | 3mo | $119,000 | $83 | 62 |
| 521 Georgia Ave | 0.64mi | 3/1.0 | 1,420 (-2%) | 8mo | $115,000 | $81 | 58 |
| 533 5th St | 0.54mi | 4/1.5 (+1) | 1,472 (+1%) | 13mo | $58,710 | $40 | 57 |
| 562 California Ave | 0.60mi | 3/2.0 | 1,376 (-6%) | 9mo | $133,000 | $97 | 53 |
| 214 Indiana Ave | 0.19mi | 2/1.5 (-1) | 1,340 (-8%) | 23mo | $60,000 | $45 | 53 |
| 532 River St | 0.59mi | 3/2.0 | 1,518 (+4%) | 14mo | $255,000 | $168 | 52 |
| 460 Georgia Ave | 0.57mi | 3/1.5 | 1,344 (-8%) | 22mo | $140,000 | $104 | 42 |
Match score weights: distance 35% · size 25% · config 20% · recency 20%. Top-matched comps best support the ARV.
Projected returns pro-forma
2.52% appreciation · 3.0% rent growth · sell at horizon
- IRR
- 5.4%
- Equity multiple
- 1.30×
- Total profit
- $7,948
- Equity at exit
- $40,186
- IRR
- 8.6%
- Equity multiple
- 2.23×
- Total profit
- $32,790
- Equity at exit
- $60,031
Cash invested: $26,600 (down + closing). Projections, not guarantees.
Landlord ↔ Tenant lean methodology
- Overall (STATE)
- 83 Strongly Landlord-Friendly
- State West Virginia
- 83 Strongly Landlord-Friendly · R+22
- County
- — inherits STATE
- City
- — inherits STATE
ZIP-level market 26034
- Home prices YoY
- 1.8%
- Active inventory
- 17
- Price-to-rent
- 11.1×
Monthly cashflow live
- Estimated rent
- $712 medium interval (Pro) →
- Mortgage (P&I)
- −$498
- Tax from tax record
- −$42 /mo · $505/yr
- Insurance
- −$40
- HOA
- −$0
- Vacancy / Maint / Mgmt
- −$150
- Net cashflow
- $-17
Break-even live
Sensitivity live
| Price | -10% $37 | -5% $10 | +0% $-17 | +5% $-44 | +10% $-71 |
|---|---|---|---|---|---|
| Rent | -10% $-73 | -5% $-45 | +0% $-17 | +5% $11 | +10% $39 |
| Rate | -1.0pp $31 | -0.5pp $7 | base $-17 | +0.5pp $-42 | +1.0pp $-67 |
UW: 25.0% down · 7.5% · 30yr · 1.5% tax · 5.0% vac · 8.0% maint · 8.0% mgmt
Financing live
Cash to close
- Down payment
- $23,750
- Closing costs
- $2,850
- Reserves months
- —
- Total cash needed
- —
Loan-product check · same deal, 3 products live
Conventional
25% down · 7.5% · 30yr
- Down + closing
- —
- Monthly P&I
- —
- Monthly cashflow
- —
- DSCR
- —
- Eligible?
- —
Personal DTI + credit; lowest rate.
DSCR
20% down · 8.5% · 30yr
- Down + closing
- —
- Monthly P&I
- —
- Monthly cashflow
- —
- DSCR
- —
- Eligible?
- —
No personal income docs; deal must DSCR.
Hard money
10% down · 12.0% · 12mo
- Down + closing
- —
- Monthly P&I
- —
- Monthly cashflow
- —
- DSCR
- —
- Eligible?
- —
Short-term bridge; refi at stabilization.
Rent comps 2 comps
| Address | Beds | Baths | Sqft | Rent | $/sqft | DOM | Units | Dist |
|---|---|---|---|---|---|---|---|---|
| 707 Saint Clair Ave Unit 06 East Liverpool, OH | 2.0 | 1.0 | 900 | $725 | $0.81 | 45d | 1 | 0.99mi |
| 707 Saint Clair Ave Unit 03 East Liverpool, OH | 2.0 | 1.0 | 900 | $700 | $0.78 | 45d | 1 | 0.99mi |
Listing history 22 events
-
2026-06-22days on market $95,000 Active 315 DOM
-
2026-06-21days on market $95,000 Active 314 DOM
-
2026-06-19days on market $95,000 Active 312 DOM
-
2026-06-18days on market $95,000 Active 311 DOM
-
2026-06-17days on market $95,000 Active 310 DOM
-
2026-06-16days on market $95,000 Active 309 DOM
-
2026-06-15days on market $95,000 Active 308 DOM
-
2026-06-14days on market $95,000 Active 306 DOM
-
2026-06-12days on market $95,000 Active 305 DOM
-
2026-06-09days on market $95,000 Active 302 DOM
-
2026-06-08days on market $95,000 Active 301 DOM
-
2026-06-07days on market $95,000 Active 300 DOM
-
2026-06-07days on market $95,000 Active 299 DOM
-
2026-06-04days on market $95,000 Active 296 DOM
-
2026-06-02days on market $95,000 Active 295 DOM
-
2026-06-01days on market $95,000 Active 294 DOM
-
2026-05-31days on market $95,000 Active 293 DOM
-
2026-05-31days on market $95,000 Active 292 DOM
-
2026-03-16price $95,000
-
2026-02-02price $109,000
-
2025-10-24price $119,000
-
2025-08-08$124,900 Active
ⓘ Source: listings_history table (triggers on properties + properties_extension) + one-shot
backfill from property_details.listing_events for pre-trigger history.
Tax reassessment forecast WV · Resets to sale price
- Current annual tax
- $505 · $42/mo
- Projected year-2 tax
- $560 · $47/mo
- Expected delta
- +$56/yr (+$5/mo · 11.0%)
ⓘ Screening estimate from a state-policy table — verify with the county assessor before closing.
Climate risk First Street
- Flood 6/10 Major FEMA zone X (unshaded) · 65% chance over 30 yrs
- Wildfire 3/10 Moderate
- Heat 4/10 Moderate 8 d/yr ≥97°F today · 19 d/yr by 30 yrs out
- Wind 1/10 Low
- Air quality 2/10 Low 1 unhealthy d/yr today · 2 by 30 yrs out
Nearby sold comps map
Loading sold comps map…
Walkable amenities ~0.75 mi
Loading nearby amenities…
Taxation est. · year 1
- Rental income
- $8,550
- − Mortgage interest
- −$5,321
- − Property taxes
- −$505
- − Insurance
- −$475
- − Repairs & maintenance
- −$684
- − Management
- −$684
- − Depreciation
- −$2,764
- Taxable loss
- −$1,883
- Est. tax savings @ 24.0%
- +$452
- After-tax cash flow
- $248/yr
For passive investors: Depreciation is non-cash, so a rental often shows a tax loss while cash-flowing — sheltering income. Rental losses are passive: they offset passive income freely, and up to $25,000/yr can offset ordinary (W-2) income if you actively participate and your MAGI is under $100k (phasing out to $0 by $150k); unused losses carry forward. On sale, claimed depreciation is recaptured at up to 25%, and gains may owe capital-gains tax (a 1031 exchange can defer both). Figures are a year-1 estimate at your 24.0% rate — not tax advice; consult a CPA.
Schools (NCES district)
- District
- Hancock County Schools
- NCES district ID
- 5400450
- Math proficiency
- 37% ▼ -11.00%
- Reading proficiency
- 43% ▼ -5.00%
- Median HH income
- $39,803
- Composite
- 33.5/100
- National rank
- #5445
- State rank
- #7 of 55 in WV
Livability — Chester
- Score
- 73/100
- State rank
- #36
- US rank
- #5000
Category grades
Schools grade is shown separately in the Schools card above.
Census & demographics
- Census place
- Chester, WV
- Population (ZIP)
- 4,555
Population outlook (Hancock County) Hauer SSP2
- Today (2025)
- 28,704 people
- By 2030
- 27,913 · -2.8%
- By 2040
- 26,078 · -9.1%
- By 2050
- 24,521 · -14.6%
- By 2075
- 21,630 · -24.6%
- By 2100
- 17,867 · -37.8%
Race, ethnicity, and origin ACS 2023
- Neighborhood character
- Predominantly White (96%)
- Race & ethnicity
- White 96% Pacific Islander 2% Two or more races 2%
- Common ancestry
- Serbian 9% Romanian 3% Lithuanian 2%
- Languages at home
- 99% English-only · Spanish 1%
Political lean MEDSL · Hancock
- 2024 margin
- Solid R (+46.8) · D 25.8% · R 72.6% · Other 1.6%
- 2008→2024 swing
- -31.6pp toward R · 2008: -15.2pp · 2024: -46.8pp
- All cycles
- 2024: R+46.8 2020: R+43.6 2016: R+44.5 2012: R+21.6 2008: R+15.2
Not yet ingested
- Civics
- —
Market trends
- HPI YoY
- ▲ 2.52%
- Current HPI
- 146.1433
- Rent YoY
- —
- Metro
- —
- State GDP YoY
- —
- F500 in state
- 0
Price history
-23.9% since first listed4 events — show timeline
- 2026-03-16 Price Changed $95,000 MLSNOW
- 2026-02-02 Price Changed $109,000 MLSNOW
- 2025-10-24 Price Changed $119,000 MLSNOW
- 2025-08-08 Listed $124,900 MLSNOW
Property tax history
+21.7%/yrLatest (2025): $505 · +180.4% YoY. Source: county tax records.
Cash-flow waterfall
monthlySold comps — $/sqft
last 12 mo · ≤1 miLoading sold comps…