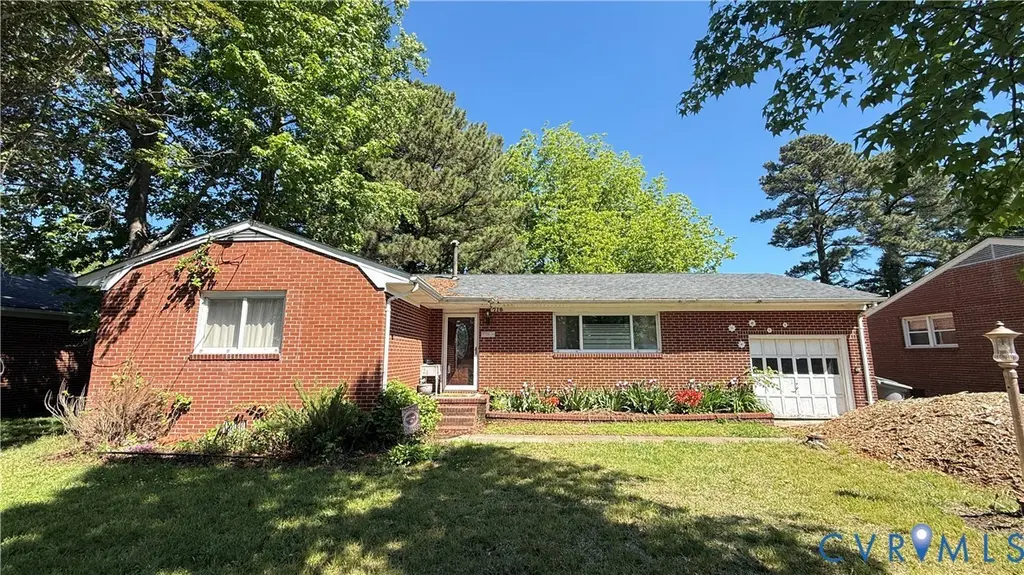
718 Burgess Ave · Hampton, VA
Flood risk 6/10 · Moderate
- FEMA flood zone
- X (unshaded)
- Chance of flooding over 30 yrs
- 0.57%
- Est. flood insurance / yr
- $473 – $860
Fire risk 1/10 · Minimal
- Est. fire insurance / yr
- $666 – $1,236
Heat risk 9/10 · Severe
- Hot days now (above 105°F)
- 7 days/yr
- Hot days in 30 yrs
- 16 days/yr
Wind risk 8/10 · Major
- Chance of severe wind over 30 yrs
- 80.0%
Air-quality risk 2/10 · Minimal
- Unhealthy air days now
- 2 days/yr
- Unhealthy air days in 30 yrs
- 2 days/yr
Risk factors via First Street. Map © Google.
Why this score? — see what drove the B grade
The composite is a weighted blend of 9 inputs, each scored 0–100. Each bar is that input's sub-score; the figure is the points it added to the 100-point composite (weight × sub-score).
- Cash flow +30.0/30.0
- 1% rule +10.0/10.0
- DSCR +10.0/10.0
- ARV discount +7.5/15.0
- Schools +5.5/10.0
- Livability +3.8/5.0
- Rent growth +2.5/5.0
- Condition / age +2.5/5.0
- Appreciation +0.0/10.0
$75,000
🖨 Deal sheet 📄 Offer letter ✓ Due diligence
Listing remarks
This Property is 1 of 11 being auctioned off both virtually and in person on June 8TH as a result of delinquent Taxes for the City of Hampton, Va. The list price does not reflect the final sale price. Properties are conveyed by Special Warranty Deed, subject to any easements, covenants, agreements, restrictions, reservations, and any and all rights of record which may affect the property. Properties are offered for sale as-is, where-is, and if-is, with all faults and without any warranty, either expressed or implied. All sales are subject to confirmation by the Circuit Court. The Special Commissioner has the right to reject any bids determined to be unreasonable in relation to the estimated
Key facts
- Improved lot
- Full crawl
- Open porch
Tags
Property features AI
Exterior
- Parking: Attached garage with 1 garage space; Driveway parking; Off-street paved parking; Direct access to garage
- Utilities: Public water; Public sewer
- Home design: Single-story home; Resale property
- Construction: Brick construction; Composition roof; Built as an actual (existing) structure
- Exterior features: Paved driveway
Interior
- Bathrooms: 1 full bathroom; 1 half bathroom
- Interior features: 6 total rooms
Neighborhood map
What this means for you Summary
Snapshot
- This is a 3-bed/1.5-bath single-family listed at $75k.
Deal economics
- At list price, monthly cash flow is $1k ($12k/yr) — positive.
- The deal already cash-flows at list — no discount required.
- Meets the 1% rule at list price ($2k rent vs $75k).
- Recommended offer: $74k (1.5% below list) — sets the bar for market timing.
- Cap rate 22.4% vs local median 4.5% in Hampton — top-decile yield for the area; either an underpriced asset or a hidden risk that comps aren't pricing in. Stress-test before assuming the spread holds.
Location & tenants
- Location reads 75/100 on livability (#133 in VA, #4,302 nationally) — a middle-class / working-renter tenant base. Strengths: housing A+, health & safety A+, cost of living A; Watch: crime C-, amenities D+, commute F.
- Hampton City Public School District (urban): math 60% / reading 70% proficiency, ranked #40 of 131 in VA (top 30%) — acceptable for families but not a draw, mixed tenant base, ~2y average lease.
- Market conditions: 97 active listings in the ZIP; 24 comparable units currently listed for rent nearby; rentals at typical pace (median 24d on market — plan ~3-4 weeks tenant-placement turnaround); 42% of comp listings sitting > 30 days — soft ceiling on asking rent; solid renter incomes; 68 units permitted in Hampton city in 2024 (0 in 5+ unit buildings).
Forward outlook
- Local home prices are declining (-3.0%/yr); year-one equity from $519 of loan paydown is wiped out by about $2k of value loss. Plan a longer hold.
- Hampton County population projected at -13% by 2050 — secular population decline; favor cash flow + early exit over multi-decade hold.
- At projected returns (-3.0% appreciation + 3.0% rent growth), your $21k cash investment doubles in ~2 years — after that, you're playing with house money.
Negotiation context
- It's been on market 15 days — a 2% lower offer ($74k) is reasonable based on typical stale-listing flexibility.
Risks & watch-outs
- Watch-outs: property tax is 3.5% of price.
- Climate carrying-cost: major flood risk; severe wind risk, 80% chance of damaging wind over 30y; extreme-heat days projected 7→16/yr by 2055 (HVAC capex compounding) — expect insurance premiums to compound above CPI over the hold.
Questions for the listing agent
- Built in 1963 — when were the roof, HVAC, electrical panel, plumbing, and water heater last replaced?
- Property tax is high relative to price — has the assessment been appealed recently, and will the sale trigger a re-assessment?
- Is there a deadline driving the sale (1031 exchange, divorce, estate, relocation)? That informs how much negotiation room exists.
- Schools are B-rated — typically a magnet for longer-tenancy family renters. What's the average tenant stay here, and is there a school-zone premium baked into asking?
- What's the average days-on-market for RENTAL listings here right now (not sales)? A rising rental-DOM trend means longer vacancies and softer asking-rent achievability than the comps imply.
- What's the recent tenant-quality profile in this submarket — average credit score on applications, eviction rate, late-payment / NSF rate, and stable-employment percentage? A property-management company in the area should have these aggregated.
- How much new for-sale + rental construction is in the pipeline within 1–3 miles? Heavy new supply typically softens prices + rents 12–24 months out; constrained supply supports both.
Investment metrics
- 1% rule
- 2.79% ✓
- Cap rate
- 22.41%
- Cash-on-cash
- 57.57%
- DSCR
- 3.56
- GRM
- 3.0
CMA / ARV
- ARV (median comp)
- $265,810
- List price
- $75,000
- Delta
- -71.78%
- Verdict
- UNDERPRICED
- Comps
- 20 within 1.0 mi
Show comp detail 12 sales within ~0.75 mi
| Address | Dist | Beds/Ba | Sqft | Sold | Price | $/sf | Match |
|---|---|---|---|---|---|---|---|
| 9 Rust St | 0.54mi | 3/2.0 | 1,391 (+3%) | 1mo | $305,500 | $220 | 67 |
| 30 Boykin Ln | 0.52mi | 3/2.0 | 1,435 (+6%) | 0mo | $300,000 | $209 | 64 |
| 220 N Fifth St | 0.47mi | 4/2.5 (+1) | 1,307 (-4%) | 1mo | $100,000 | $77 | 62 |
| 1938 Long Green Ln | 0.48mi | 3/2.0 | 1,250 (-8%) | 1mo | $289,500 | $232 | 61 |
| 2319 Andrews Blvd | 0.55mi | 3/1.5 | 1,220 (-10%) | 2mo | $155,000 | $127 | 56 |
| 2404 Andrews Blvd | 0.54mi | 3/2.0 | 1,212 (-11%) | 0mo | $274,000 | $226 | 55 |
| 2001 Neville Cir | 0.73mi | 4/1.0 (+1) | 1,320 (-3%) | 1mo | $222,800 | $169 | 54 |
| 7 Farrington Pl | 0.57mi | 3/1.0 | 1,200 (-12%) | 1mo | $150,000 | $125 | 52 |
| 2007 Egger Cir | 0.61mi | 4/2.0 (+1) | 1,459 (+8%) | 1mo | $315,000 | $216 | 51 |
| 112 S 2nd St | 0.52mi | 3/1.0 | 1,166 (-14%) | 0mo | $345,000 | $296 | 50 |
| 2232 N Mallory St | 0.73mi | 4/1.5 (+1) | 1,232 (-9%) | 0mo | $240,000 | $195 | 45 |
| 1003 Grimes Rd | 0.73mi | 3/1.0 | 1,179 (-13%) | 1mo | $235,000 | $199 | 41 |
Match score weights: distance 35% · size 25% · config 20% · recency 20%. Top-matched comps best support the ARV.
Projected returns pro-forma
-3.0% appreciation · 3.0% rent growth · sell at horizon
- IRR
- 56.1%
- Equity multiple
- 3.48×
- Total profit
- $52,126
- Equity at exit
- $11,183
- IRR
- 61.1%
- Equity multiple
- 7.12×
- Total profit
- $128,462
- Equity at exit
- $6,485
Cash invested: $21,000 (down + closing). Projections, not guarantees.
Landlord ↔ Tenant lean methodology
- Overall (STATE)
- 55 Moderately Landlord-Leaning
- State Virginia
- 55 Moderately Landlord-Leaning · D+2
- County
- — inherits STATE
- City
- — inherits STATE
ZIP-level market 23664
- Home prices YoY
- -23.6%
- Active inventory
- 97
- Price-to-rent
- 3.0×
Monthly cashflow live
- Estimated rent
- $2,090 high interval (Pro) →
- Mortgage (P&I)
- −$393
- Tax from tax record
- −$219 /mo · $2,632/yr
- Insurance
- −$31
- HOA
- −$0
- Vacancy / Maint / Mgmt
- −$439
- Net cashflow
- $1,008
Break-even live
UW: 25.0% down · 7.5% · 30yr · 1.5% tax · 5.0% vac · 8.0% maint · 8.0% mgmt
Financing live
Cash to close
- Down payment
- $18,750
- Closing costs
- $2,250
- Reserves months
- —
- Total cash needed
- —
Loan-product check · same deal, 3 products live
Conventional
25% down · 7.5% · 30yr
- Down + closing
- —
- Monthly P&I
- —
- Monthly cashflow
- —
- DSCR
- —
- Eligible?
- —
Personal DTI + credit; lowest rate.
DSCR
20% down · 8.5% · 30yr
- Down + closing
- —
- Monthly P&I
- —
- Monthly cashflow
- —
- DSCR
- —
- Eligible?
- —
No personal income docs; deal must DSCR.
Hard money
10% down · 12.0% · 12mo
- Down + closing
- —
- Monthly P&I
- —
- Monthly cashflow
- —
- DSCR
- —
- Eligible?
- —
Short-term bridge; refi at stabilization.
Rent comps 24 comps
| Address | Beds | Baths | Sqft | Rent | $/sqft | DOM | Units | Dist |
|---|---|---|---|---|---|---|---|---|
| 1805 Nickerson Blvd Hampton, VA | 3.0 | 1.5 | 1393 | $1,695 | $1.22 | 43d | 1 | 0.18mi |
| 2010 E Pembroke Ave Hampton, VA | 2.0 | 1.0 | 900 | $1,150 | $1.28 | 4d | 1 | 0.21mi |
| 2304 Burnette Dr Hampton, VA | 4.0 | 2.0 | 1322 | $2,100 | $1.59 | 14d | 1 | 0.28mi |
| 311 Atlantic Ave Unit 1533635P Hampton, VA | 4.0 | 2.5 | 1506 | $6,554 | $4.35 | 7d | 1 | 0.39mi |
| 1665 N Mallory St Hampton, VA | 2.0 | 1.0 | 1250 | $1,785 | $1.43 | 43d | 1 | 0.40mi |
| 229 Atlantic Ave Hampton, VA | 2.0 | 1.0 | 1170 | $1,600 | $1.37 | 12d | 1 | 0.45mi |
| 216 S 2nd St Hampton, VA | 2.0 | 2.0 | 1429 | $2,395 | $1.68 | 21d | 1 | 0.50mi |
| 2109 Newton Rd Hampton, VA | 2.0–4.0 | 1.0–1.5 | 1700 | $2,065 | $1.21 | 1d | 3 | 0.53mi |
| 203 N First St Unit A Hampton, VA | 2.0 | 1.5 | 1406 | $2,900 | $2.06 | 43d | 1 | 0.67mi |
| 2000 Neville Cir Hampton, VA | 3.0 | 1.0 | 1100 | $1,750 | $1.59 | 43d | 1 | 0.71mi |
| 334 N 1st St Hampton, VA | 2.0 | 1.5 | 1200 | $2,495 | $2.08 | 14d | 1 | 0.75mi |
| 29 Glascow Way Hampton, VA | 3.0 | 1.5 | 1382 | $2,200 | $1.59 | 14d | 1 | 0.85mi |
| 2001 Grimes Rd Hampton, VA | 4.0 | 2.0 | 1430 | $2,100 | $1.47 | 3d | 1 | 0.91mi |
| 11 Camellia Ln Hampton, VA | 3.0 | 2.5 | 1650 | $2,400 | $1.45 | 43d | 1 | 0.92mi |
| 244 Loch Cir Hampton, VA | 3.0 | 2.5 | 1440 | $1,850 | $1.28 | 43d | 1 | 0.93mi |
| 1802 Moger Dr Hampton, VA | 3.0 | 1.0 | 900 | $1,700 | $1.89 | 12d | 1 | 0.94mi |
| 1210 Pansy St Hampton, VA | 2.0 | 2.0 | 1409 | $2,000 | $1.42 | 43d | 1 | 1.04mi |
| 10 Whipple Dr Hampton, VA | 4.0 | 2.5 | 1564 | $2,300 | $1.47 | 43d | 1 | 1.11mi |
| 1026 High Dunes Quay Hampton, VA | 3.0 | 2.0 | 1216 | $2,100 | $1.73 | 23d | 1 | 1.11mi |
| 102 Silver Isles Blvd Hampton, VA | 3.0 | 2.0 | 1025 | $1,900 | $1.85 | 43d | 1 | 1.25mi |
| 949 N Mallory St Hampton, VA | 2.0 | 1.5 | 1054 | $1,250 | $1.19 | 1d | 1 | 1.30mi |
| 10 Westlawn Dr Hampton, VA | 3.0 | 2.0 | 1463 | $2,295 | $1.57 | 23d | 1 | 1.38mi |
| 5 Lacrosse St Hampton, VA | 3.0 | 2.5 | 1612 | $2,500 | $1.55 | 43d | 1 | 1.41mi |
| 44 Glenhaven Dr Hampton, VA | 3.0 | 2.0 | 1410 | $2,500 | $1.77 | 14d | 1 | 1.41mi |
Listing history 1 events
-
2026-05-12$75,000 Active 1626-char remark
ⓘ Source: listings_history table (triggers on properties + properties_extension) + one-shot
backfill from property_details.listing_events for pre-trigger history.
Tax reassessment forecast VA · Resets to sale price
- Current annual tax
- $2,632 · $219/mo
- Projected year-2 tax
- $2,632 · $219/mo
- Expected delta
- $0/yr ($0/mo · 0.0%)
ⓘ Screening estimate from a state-policy table — verify with the county assessor before closing.
Climate risk First Street
- Flood 6/10 Major FEMA zone X (unshaded) · 57% chance over 30 yrs
- Wildfire 1/10 Low
- Heat 9/10 Extreme 7 d/yr ≥105°F today · 16 d/yr by 30 yrs out
- Wind 8/10 Severe 80% chance of damaging wind over 30 yrs
- Air quality 2/10 Low 2 unhealthy d/yr today · 2 by 30 yrs out
Nearby sold comps map
Loading sold comps map…
Walkable amenities ~0.75 mi
Loading nearby amenities…
Taxation est. · year 1
- Rental income
- $25,085
- − Mortgage interest
- −$4,201
- − Property taxes
- −$2,632
- − Insurance
- −$375
- − Repairs & maintenance
- −$2,007
- − Management
- −$2,007
- − Depreciation
- −$2,182
- Taxable income
- $11,681
- Est. tax owed @ 24.0%
- −$2,804
- After-tax cash flow
- $9,287/yr
For passive investors: Depreciation is non-cash, so a rental often shows a tax loss while cash-flowing — sheltering income. Rental losses are passive: they offset passive income freely, and up to $25,000/yr can offset ordinary (W-2) income if you actively participate and your MAGI is under $100k (phasing out to $0 by $150k); unused losses carry forward. On sale, claimed depreciation is recaptured at up to 25%, and gains may owe capital-gains tax (a 1031 exchange can defer both). Figures are a year-1 estimate at your 24.0% rate — not tax advice; consult a CPA.
Schools (NCES district)
- District
- Hampton City Public School District
- NCES district ID
- 5101800
- Math proficiency
- 60% ▼ -21.00%
- Reading proficiency
- 70% ▼ -4.00%
- Median HH income
- $50,089
- Composite
- 55.19/100
- National rank
- #1272
- State rank
- #40 of 131 in VA
Livability — Hampton
- Score
- 75/100
- State rank
- #133
- US rank
- #4302
Category grades
Schools grade is shown separately in the Schools card above.
Census & demographics
- Census place
- Hampton, VA
- County
- Hampton City · 132,421 people
- City population
- 132,421
- Metro
- Virginia Beach-Norfolk-Newport News, VA-NC
- Population (ZIP)
- 9,643
- Household income
- $87,412
- Rent vs Own
- Severe rent burden
- 394.0
Population outlook (Hampton County) Hauer SSP2
- Today (2025)
- 134,055 people
- By 2030
- 131,753 · -1.7%
- By 2040
- 125,017 · -6.7%
- By 2050
- 116,825 · -12.9%
- By 2075
- 97,033 · -27.6%
- By 2100
- 76,188 · -43.2%
Race, ethnicity, and origin ACS 2023
- Neighborhood character
- Predominantly White (67%)
- Race & ethnicity
- White 67% Black 24% Two or more races 4% Hispanic / Latino 3%
- Common ancestry
- Slovak 2% Lithuanian 2% Italian 2%
- Foreign-born
- 3% · Canada, Guatemala
- Languages at home
- 97% English-only · Arabic 1% Spanish 1%
Political lean MEDSL · Hampton
- 2024 margin
- Solid D (+39.9) · D 69.2% · R 29.4% · Other 1.4%
- 2008→2024 swing
- +1.0pp no change · 2008: 38.9pp · 2024: 39.9pp
- All cycles
- 2024: D+39.9 2020: D+42.2 2016: D+37.8 2012: D+45.4 2008: D+38.9
Not yet ingested
- Civics
- —
Market trends
- HPI YoY
- ▼ -73.71%
- Current HPI
- 238.491
- Rent YoY
- —
- Metro
- Virginia Beach-Norfolk-Newport News, VA-NC
- State GDP YoY
- ▲ 2.40%
- F500 in state
- 50
Industry mix (Fortune 500 HQ in VA)
| Industry | F500 HQs | Revenue |
|---|---|---|
| Aerospace / Defense | 4 | $236B |
|
||
| Technology / Defense | 3 | $32B |
|
||
| Financial Services | 2 | $176B |
|
||
| Utilities | 2 | $27B |
|
||
| Insurance | 2 | $25B |
|
||
| Technology | 2 | $15B |
|
||
Price history
2 events — show timeline
- 2026-05-27 Listing Removed — CVRMLS
- 2026-05-12 Listed $75,000 CVRMLS
Property tax history
+10.2%/yrLatest (2025): $2,632 · +1.7% YoY. Source: county tax records.
Cash-flow waterfall
monthlySold comps — $/sqft
last 12 mo · ≤1 miLoading sold comps…