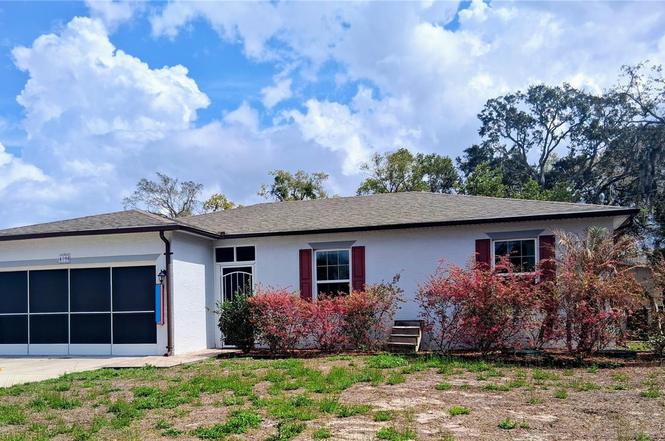
4096 Thunderbird Ave · Spring Hill, FL
Flood risk 1/10 · Minimal
- FEMA flood zone
- X (unshaded)
- Chance of flooding over 30 yrs
- 0.0%
- Est. flood insurance / yr
- $507 – $1,088
Fire risk 5/10 · Moderate
- Est. fire insurance / yr
- $947 – $1,759
Heat risk 10/10 · Severe
- Hot days now (above 110°F)
- 7 days/yr
- Hot days in 30 yrs
- 26 days/yr
Wind risk 10/10 · Severe
- Chance of severe wind over 30 yrs
- 99.0%
Air-quality risk 3/10 · Minor
- Unhealthy air days now
- 1 days/yr
- Unhealthy air days in 30 yrs
- 4 days/yr
Risk factors via First Street. Map © Google.
Why this score? — see what drove the D- grade
The composite is a weighted blend of 9 inputs, each scored 0–100. Each bar is that input's sub-score; the figure is the points it added to the 100-point composite (weight × sub-score).
- Cash flow +13.3/30.0
- Schools +4.2/10.0
- DSCR +4.0/10.0
- ARV discount +3.9/15.0
- Livability +3.2/5.0
- Condition / age +2.5/5.0
- 1% rule +2.4/10.0
- Rent growth +2.3/5.0
- Appreciation +0.0/10.0
$275,000
🖨 Deal sheet 📄 Offer letter ✓ Due diligence
Listing remarks MLS
Brand new builder owned 3/2 split planned spec home with estimated completion date of Sept 2019. CBS construction with full builder warranties. Terrific plan featuring large great room, 2 car garage and much, much more.
Key facts
- Close to us 19
- Spacious kitchen
- No cdd fees
Tags
Property features AI
Finance
- Other: Homestead exempt; No lease restrictions
- HOA & community: No association
Exterior
- Parking: Attached garage (2 spaces)
- Utilities: Public water; Septic sewer; Cable available; Electricity available; Water connected
- Home design: Single-family residence; One story; Facing west; Residential property
- Construction: Block construction; Shingle roof; Slab foundation; Built on 0.16-acre lot
- Exterior features: Lighting; Private mailbox; Rain gutters; Sliding doors; Asphalt road access
Interior
- Kitchen: Dishwasher; Disposal; Microwave; Range; Refrigerator; Electric water heater
- Bedrooms: 3 bedrooms
- Flooring: Ceramic tile; Laminate
- Bathrooms: 2 full bathrooms
- Heating & cooling: Central heating; Central air conditioning
- Interior features: Ceiling fans; Living room and dining room combo
- Laundry & utility: Laundry room
Neighborhood map
What this means for you Summary
Snapshot
- This is a 3-bed/2.0-bath single-family listed at $275k.
Deal economics
- At list price, monthly cash flow is $1 ($12/yr) — positive.
- The deal already cash-flows at list — no discount required.
- To meet the 1% rule (rent ≥ 1% of price), the offer needs to be $204k (25.6% below list).
- Recommended offer: $204k (25.6% below list) — sets the bar for 1% rule.
- Cap rate 6.3% vs local median 4.4% in Spring Hill — top-decile yield for the area; either an underpriced asset or a hidden risk that comps aren't pricing in. Stress-test before assuming the spread holds.
Location & tenants
- Location reads 63/100 on livability (#738 in FL) — a middle-class / working-renter tenant base. Strengths: cost of living A+, housing A+; Watch: health & safety C-, employment D+, amenities F.
- Hernando (suburban): math 50% / reading 50% proficiency, ranked #38 of 73 in FL (top 52%) — acceptable for families but not a draw, mixed tenant base, ~2y average lease.
- Zoned schools: Deltona Elementary School (math 45% / reading 50%, grade D, #1,182 of 2,144 statewide, top 55%, 843 students, 72% FRL); Central High School (math 34% / reading 44%, grade F, #312 of 667 statewide, top 48%, 1,426 students, 53% FRL).
- Market conditions: Rents soft (-0.9%/yr); 386 active listings in the ZIP; 14 comparable units currently listed for rent nearby; rentals at typical pace (median 18d on market — plan ~3-4 weeks tenant-placement turnaround); 2,505 units permitted in Hernando County in 2024 (318 in 5+ unit buildings).
- This rent runs 43% of the median local income ($57k/yr) — at the standard rent-burdened threshold; future hikes will face affordability resistance.
Forward outlook
- Local home prices are declining (-3.0%/yr); year-one equity from $2k of loan paydown is wiped out by about $8k of value loss. Plan a longer hold.
- Hernando County population projected at +11% by 2050 — modest demand growth; plan on rents tracking national, not racing it.
Negotiation context
- It's been on market 103 days — a 9% lower offer ($250k) is reasonable based on typical stale-listing flexibility.
- 3 sale attempts since 7y ago; this cycle's ask has dropped $24k (8%) from the opening price — seller is motivated, your offer sets the floor, not the list.
- Current owner paid $165k; list at $275k implies a 67% gain — meaningful room to come down on a strong offer.
Risks & watch-outs
- Climate carrying-cost: severe wind risk, 99% chance of damaging wind over 30y; moderate wildfire risk; extreme-heat days projected 7→26/yr by 2055 (HVAC capex compounding) — expect insurance premiums to compound above CPI over the hold.
Questions for the listing agent
- It's been on market 103 days. Have you received any prior offers? Is the seller open to a 26% concession, seller financing, or rate buy-down credit?
- Why hasn't it sold? Are there any deal-killer items the seller is aware of (foundation, flood, title, zoning, code violations)?
- Is there a deadline driving the sale (1031 exchange, divorce, estate, relocation)? That informs how much negotiation room exists.
- The area grade is low — what's the realistic commute time and amenity access for the typical tenant pool here? Any planned neighborhood developments (good or bad) we should know about?
- What's the average days-on-market for RENTAL listings here right now (not sales)? A rising rental-DOM trend means longer vacancies and softer asking-rent achievability than the comps imply.
- What's the recent tenant-quality profile in this submarket — average credit score on applications, eviction rate, late-payment / NSF rate, and stable-employment percentage? A property-management company in the area should have these aggregated.
- How much new for-sale + rental construction is in the pipeline within 1–3 miles? Heavy new supply typically softens prices + rents 12–24 months out; constrained supply supports both.
Investment metrics
- 1% rule
- 0.74% ✗
- Cap rate
- 6.30%
- Cash-on-cash
- 0.02%
- DSCR
- 1.00
- GRM
- 11.2
CMA / ARV
- ARV (on-the-fly)
- $254,826
- Comps found
- 12
Show comp detail 12 sales within ~0.75 mi
| Address | Dist | Beds/Ba | Sqft | Sold | Price | $/sf | Match |
|---|---|---|---|---|---|---|---|
| 7452 Wabash Trl | 0.23mi | 3/2.0 | 1,267 (-2%) | 1mo | $260,000 | $205 | 86 |
| 4077 Ramona Dr | 0.17mi | 2/2.0 (-1) | 1,275 (-1%) | 3mo | $247,000 | $194 | 83 |
| 4086 Arrowhead Ave | 0.10mi | 3/2.0 | 1,152 (-10%) | 0mo | $220,000 | $191 | 78 |
| 7464 Cherokee Trl | 0.36mi | 3/2.0 | 1,249 (-3%) | 6mo | $251,500 | $201 | 73 |
| 8040 Cessna Dr | 0.60mi | 3/2.0 | 1,304 (+1%) | 1mo | $194,900 | $149 | 69 |
| 4076 Monona Ave | 0.32mi | 3/2.0 | 1,408 (+9%) | 1mo | $304,990 | $217 | 68 |
| 3394 Memory Ln | 0.40mi | 2/2.0 (-1) | 1,215 (-6%) | 0mo | $215,000 | $177 | 67 |
| 8002 Navajo Trl | 0.38mi | 3/2.0 | 1,354 (+5%) | 8mo | $270,000 | $199 | 67 |
| 7210 Apache Trl | 0.34mi | 3/2.0 | 1,413 (+10%) | 6mo | $280,000 | $198 | 63 |
| 7376 Philatelic Dr | 0.75mi | 3/2.0 | 1,350 (+5%) | 1mo | $250,000 | $185 | 56 |
| 3250 Painters St | 0.70mi | 3/2.0 | 1,382 (+7%) | 0mo | $250,000 | $181 | 55 |
| 8082 Pagoda Dr | 0.74mi | 3/2.0 | 1,368 (+6%) | 3mo | $305,000 | $223 | 52 |
Match score weights: distance 35% · size 25% · config 20% · recency 20%. Top-matched comps best support the ARV.
Projected returns pro-forma
-3.0% appreciation · 0.0% rent growth · sell at horizon
- IRR
- -19.2%
- Equity multiple
- 0.34×
- Total profit
- $-50,636
- Equity at exit
- $41,003
- IRR
- -18.4%
- Equity multiple
- 0.12×
- Total profit
- $-67,759
- Equity at exit
- $23,777
Cash invested: $77,000 (down + closing). Projections, not guarantees.
Landlord ↔ Tenant lean methodology
- Overall (STATE)
- 87 Strongly Landlord-Friendly
- State Florida
- 87 Strongly Landlord-Friendly · R+3
- County
- — inherits STATE
- City
- — inherits STATE
ZIP-level market 34606
- Home prices YoY
- -24.7%
- Rents YoY
- -0.9%
- Active inventory
- 386
- Price-to-rent
- 11.2×
Monthly cashflow live
- Estimated rent
- $2,045 high interval (Pro) →
- Mortgage (P&I)
- −$1,442
- Tax from tax record
- −$58 /mo · $693/yr
- Insurance
- −$115
- HOA
- −$0
- Vacancy / Maint / Mgmt
- −$429
- Net cashflow
- $1
Break-even live
UW: 25.0% down · 7.5% · 30yr · 1.5% tax · 5.0% vac · 8.0% maint · 8.0% mgmt
Financing live
Cash to close
- Down payment
- $68,750
- Closing costs
- $8,250
- Reserves months
- —
- Total cash needed
- —
Loan-product check · same deal, 3 products live
Conventional
25% down · 7.5% · 30yr
- Down + closing
- —
- Monthly P&I
- —
- Monthly cashflow
- —
- DSCR
- —
- Eligible?
- —
Personal DTI + credit; lowest rate.
DSCR
20% down · 8.5% · 30yr
- Down + closing
- —
- Monthly P&I
- —
- Monthly cashflow
- —
- DSCR
- —
- Eligible?
- —
No personal income docs; deal must DSCR.
Hard money
10% down · 12.0% · 12mo
- Down + closing
- —
- Monthly P&I
- —
- Monthly cashflow
- —
- DSCR
- —
- Eligible?
- —
Short-term bridge; refi at stabilization.
Rent comps 14 comps
| Address | Beds | Baths | Sqft | Rent | $/sqft | DOM | Units | Dist |
|---|---|---|---|---|---|---|---|---|
| 7423 Mohawk Trl Spring Hill, FL | 3.0 | 2.0 | 1114 | $1,795 | $1.61 | 17d | 1 | 0.22mi |
| 7410 Cherokee Trl Spring Hill, FL | 3.0 | 2.0 | 1196 | $1,725 | $1.44 | 12d | 1 | 0.24mi |
| 7272 Apache Trl Spring Hill, FL | 3.0 | 2.0 | 1408 | $2,650 | $1.88 | 24d | 1 | 0.29mi |
| 7423 Apache Trl Spring Hill, FL | 3.0 | 2.0 | 1711 | $2,200 | $1.29 | 24d | 1 | 0.31mi |
| 4108 Monona Ave Spring Hill, FL | 3.0 | 2.0 | 1508 | $1,900 | $1.26 | 24d | 1 | 0.32mi |
| 7483 Apache Trl Spring Hill, FL | 3.0 | 2.0 | 1587 | $1,795 | $1.13 | 5d | 1 | 0.41mi |
| 4300 Bridgewater Club Loop Spring Hill, FL | 2.0–4.0 | 2.0–3.0 | 1214 | $1,396 | $1.15 | 1d | 13 | 0.50mi |
| 4398 Plumosa St Spring Hill, FL | 3.0 | 2.0 | 1646 | $1,985 | $1.21 | 24d | 1 | 0.62mi |
| 7369 Sealawn Dr Spring Hill, FL | 2.0 | 2.0 | 1154 | $2,500 | $2.17 | 3d | 1 | 0.76mi |
| 8316 Nevada St Spring Hill, FL | 2.0 | 1.0 | 1722 | $2,100 | $1.22 | 24d | 1 | 0.99mi |
| 8397 Coral St Spring Hill, FL | 3.0 | 2.0 | 1202 | $1,689 | $1.41 | 2d | 1 | 1.11mi |
| 3191 Deltona Blvd Spring Hill, FL | 3.0 | 2.0 | 1366 | $1,815 | $1.33 | 24d | 1 | 1.15mi |
| 8513 Beach Rd Spring Hill, FL | 3.0 | 2.0 | 1378 | $1,990 | $1.44 | 17d | 1 | 1.28mi |
| 4628 Bayridge Ct Spring Hill, FL | 3.0 | 2.0 | 1756 | $1,995 | $1.14 | 4d | 1 | 1.32mi |
Listing history 22 events
-
2026-06-18days on market $275,000 Active 103 DOM
-
2026-06-17days on market $275,000 Active 102 DOM
-
2026-06-16days on market $275,000 Active 101 DOM
-
2026-06-15days on market $275,000 Active 100 DOM
-
2026-06-13days on market $275,000 Active 98 DOM
-
2026-06-13pricedays on market $275,000 Active 97 DOM
-
2026-06-07days on market $279,000 Active 96 DOM
-
2026-06-04days on market $279,000 Active 93 DOM
-
2026-06-03days on market $279,000 Active 92 DOM
-
2026-06-02days on market $279,000 Active 91 DOM
-
2026-06-01days on market $279,000 Active 90 DOM
-
2026-05-31days on market $279,000 Active 89 DOM
-
2026-04-24price $279,000
-
2026-03-24price $289,000
-
2026-03-03$298,900 Active
-
2019-12-27soldstatus $164,700 219-char remark
Show marketing remark (219 chars)
Brand new builder owned 3/2 split planned spec home with estimated completion date of Sept 2019. CBS construction with full builder warranties. Terrific plan featuring large great room, 2 car garage and much, much more.
-
2019-05-01$172,700 219-char remark
Show marketing remark (219 chars)
Brand new builder owned 3/2 split planned spec home with estimated completion date of Sept 2019. CBS construction with full builder warranties. Terrific plan featuring large great room, 2 car garage and much, much more.
-
2019-05-01$172,700 219-char remark
Show marketing remark (219 chars)
Brand new builder owned 3/2 split planned spec home with estimated completion date of Sept 2019. CBS construction with full builder warranties. Terrific plan featuring large great room, 2 car garage and much, much more.
-
2018-11-16soldstatus $40,000
-
2018-10-23soldstatus $24,000
-
2004-04-30soldstatus $8,200
ⓘ Source: listings_history table (triggers on properties + properties_extension) + one-shot
backfill from property_details.listing_events for pre-trigger history.
Tax reassessment forecast FL · Resets to sale price
- Current annual tax
- $693 · $58/mo
- Projected year-2 tax
- $2,282 · $190/mo
- Expected delta
- +$1,590/yr (+$132/mo · 229.5%)
ⓘ Screening estimate from a state-policy table — verify with the county assessor before closing.
Climate risk First Street
- Flood 1/10 Low FEMA zone X (unshaded) · 0% chance over 30 yrs
- Wildfire 5/10 Major
- Heat 10/10 Extreme 7 d/yr ≥110°F today · 26 d/yr by 30 yrs out
- Wind 10/10 Extreme 99% chance of damaging wind over 30 yrs
- Air quality 3/10 Moderate 1 unhealthy d/yr today · 4 by 30 yrs out
Nearby sold comps map
Loading sold comps map…
Walkable amenities ~0.75 mi
Loading nearby amenities…
Taxation est. · year 1
- Rental income
- $24,538
- − Mortgage interest
- −$15,404
- − Property taxes
- −$693
- − Insurance
- −$1,375
- − Repairs & maintenance
- −$1,963
- − Management
- −$1,963
- − Depreciation
- −$8,000
- Taxable loss
- −$4,860
- Est. tax savings @ 24.0%
- +$1,166
- After-tax cash flow
- $1,178/yr
For passive investors: Depreciation is non-cash, so a rental often shows a tax loss while cash-flowing — sheltering income. Rental losses are passive: they offset passive income freely, and up to $25,000/yr can offset ordinary (W-2) income if you actively participate and your MAGI is under $100k (phasing out to $0 by $150k); unused losses carry forward. On sale, claimed depreciation is recaptured at up to 25%, and gains may owe capital-gains tax (a 1031 exchange can defer both). Figures are a year-1 estimate at your 24.0% rate — not tax advice; consult a CPA.
Schools (NCES district)
- District
- Hernando
- NCES district ID
- 1200810
- Math proficiency
- 50% ▼ -8.00%
- Reading proficiency
- 50% ▼ -4.00%
- Median HH income
- $41,985
- Composite
- 42.03/100
- National rank
- #3329
- State rank
- #38 of 73 in FL
Livability — Spring Hill
- Score
- 63/100
- State rank
- #738
- US rank
- #15937
Category grades
Schools grade is shown separately in the Schools card above.
Census & demographics
- Census place
- Spring Hill, FL
- County
- Hernando County · 169,677 people
- City population
- 83,915
- Metro
- Tampa-St. Petersburg-Clearwater, FL
- Population (ZIP)
- 28,668
- Household income
- $57,337
- Rent vs Own
- Severe rent burden
- 733.0
Population outlook (Hernando County) Hauer SSP2
- Today (2025)
- 189,218 people
- By 2030
- 194,367 · +2.7%
- By 2040
- 203,398 · +7.5%
- By 2050
- 209,589 · +10.8%
- By 2075
- 218,452 · +15.4%
- By 2100
- 205,923 · +8.8%
Race, ethnicity, and origin ACS 2023
- Neighborhood character
- Predominantly White (74%)
- Race & ethnicity
- White 74% Hispanic / Latino 16% Two or more races 13% Black 4%
- Hispanic origin (detail)
- Mexican 1% Puerto Rican 10% Cuban 2%
- Common ancestry
- Romanian 4% Lithuanian 3% Slovak 2%
- Foreign-born
- 8% · Canada, Jamaica
- Languages at home
- 87% English-only · Spanish 11% German/W. Germanic 1%
Political lean MEDSL · Hernando
- 2024 margin
- Solid R (+37.0) · D 31.1% · R 68.2%
- 2008→2024 swing
- -33.5pp toward R · 2008: -3.6pp · 2024: -37.0pp
- All cycles
- 2024: R+37.0 2020: R+30.2 2016: R+29.0 2012: R+8.5 2008: R+3.6
Not yet ingested
- Civics
- —
Market trends
- HPI YoY
- ▼ -98.11%
- Current HPI
- 298.5201
- Rent YoY
- ▼ -0.89%
- Metro
- Tampa-St. Petersburg-Clearwater, FL
- State GDP YoY
- ▲ 3.28%
- F500 in state
- 36
Industry mix (Fortune 500 HQ in FL)
| Industry | F500 HQs | Revenue |
|---|---|---|
| Industrial Technology | 2 | $29B |
|
||
| Insurance | 2 | $17B |
|
||
| Retail | 1 | $60B |
|
||
| Technology Distribution | 1 | $58B |
|
||
| Homebuilding | 1 | $35B |
|
||
| Technology Manufacturing | 1 | $35B |
|
||
Price history
+3302.4% since first listed10 events — show timeline
- 2026-04-24 Price Changed $279,000 Stellar MLS as Distributed by MLS Grid
- 2026-03-24 Price Changed $289,000 Stellar MLS as Distributed by MLS Grid
- 2026-03-03 Listed $298,900 Stellar MLS as Distributed by MLS Grid
- 2019-12-27 Sold (MLS) $164,700 St. Augustine and St. Johns County Board of REALTORS®
- 2019-12-27 Sold (MLS) $164,700 HCAR
- 2019-05-01 Listed $172,700 St. Augustine and St. Johns County Board of REALTORS®
- 2019-05-01 Listed $172,700 HCAR
- 2018-11-16 Sold (Public Records) $40,000 Public Records
- 2018-10-23 Sold (Public Records) $24,000 Public Records
- 2004-04-30 Sold (Public Records) $8,200 Public Records
Property tax history
+10.6%/yrLatest (2025): $693 · +1.7% YoY. Source: county tax records.
Cash-flow waterfall
monthlySold comps — $/sqft
last 12 mo · ≤1 miLoading sold comps…