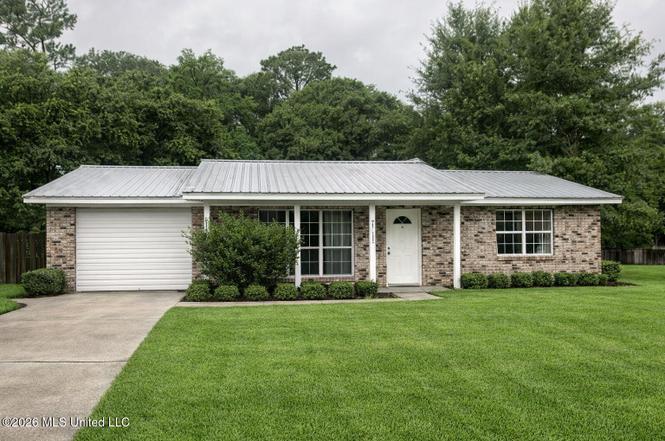
2717 Pleasant St · Pascagoula, MS
Flood risk 9/10 · Severe
- FEMA flood zone
- AE
- Chance of flooding over 30 yrs
- 0.99%
- Est. flood insurance / yr
- $1,737 – $8,500
Fire risk 2/10 · Minimal
- Est. fire insurance / yr
- $1,241 – $2,305
Heat risk 10/10 · Severe
- Hot days now (above 105°F)
- 7 days/yr
- Hot days in 30 yrs
- 21 days/yr
Wind risk 9/10 · Severe
- Chance of severe wind over 30 yrs
- 99.0%
Air-quality risk 3/10 · Minor
- Unhealthy air days now
- 2 days/yr
- Unhealthy air days in 30 yrs
- 3 days/yr
Risk factors via First Street. Map © Google.
Why this score? — see what drove the B+ grade
The composite is a weighted blend of 9 inputs, each scored 0–100. Each bar is that input's sub-score; the figure is the points it added to the 100-point composite (weight × sub-score).
- Cash flow +30.0/30.0
- ARV discount +15.0/15.0
- 1% rule +10.0/10.0
- DSCR +10.0/10.0
- Livability +3.5/5.0
- Schools +3.3/10.0
- Rent growth +2.5/5.0
- Condition / age +2.5/5.0
- Appreciation +0.0/10.0
$80,000
🖨 Deal sheet 📄 Offer letter ✓ Due diligence
Listing remarks
This home in a wonderful neighborhood is waiting on your touches and imagination. Perfect for an investor or someone looking to renovate this for their forever home. This is a 3 bedroom 1 bath with a space for a primary bathroom to be completed in the primary suite. There are 2 living spaces. The front living space is open to the kitchen. Great possibilities with the back porch. The roof is a metal roof. The electricity is not on. This home is being sold as is where is. There may be mold present. The buyer will be responsible to verify all information.
Key facts
- Metal roof
- 2 living spaces
- Open to the kitchen
Tags
Property features AI
Finance
- Other: Property listed as 2,380 building area (owner source); Zoned for single-family residential medium density
Exterior
- Parking: 1-car garage; Concrete parking surface
- Utilities: Public water; Public sewer; Cable available; Electricity connected; Sewer connected
- Home design: Single-family house; One story; Fixer condition
- Construction: Brick construction; Combination/slab foundation; Metal roof; Built (year per public records)
- Exterior features: Front porch; Patio; Dog run; Wood fencing; City lot
Interior
- Kitchen: Cooktop; Dishwasher; Refrigerator
- Flooring: Combination flooring
- Bathrooms: 1 full bathroom
- Heating & cooling: Window unit(s) for cooling
- Interior features: Granite counters; Vinyl-clad windows
- Laundry & utility: Washer hookup; Electric dryer hookup; Laundry room inside
Neighborhood map
What this means for you Summary
Snapshot
- This is a 3-bed/1.0-bath single-family listed at $80k.
Deal economics
- At list price, monthly cash flow is $-15 ($-176/yr) — negative.
- To cash-flow at today's rent, offer at most $77k (3.2% below list).
- Meets the 1% rule at list price ($1k rent vs $80k).
- Recommended offer: $77k (3.2% below list) — sets the bar for cash-flow.
- Cap rate 12.5% vs local median 4.2% in Pascagoula — top-decile yield for the area; either an underpriced asset or a hidden risk that comps aren't pricing in. Stress-test before assuming the spread holds.
Location & tenants
- Location reads 70/100 on livability (#41 in MS) — a middle-class / working-renter tenant base. Strengths: cost of living A+, housing A+, health & safety A+; Watch: crime F, amenities D-, commute F.
- Pascagoula-Gautier School District (urban): math 40% / reading 38% proficiency, ranked #41 of 130 in MS (top 32%) — families likely to look elsewhere, expect single-tenant / working-renter base with shorter leases; 78% free/reduced lunch — lower-income household profile, screen leases tightly.
- Market conditions: 79 active listings in the ZIP; 8 comparable units currently listed for rent nearby; rentals leasing fast (median 14d on market — plan ~1-2 weeks tenant-placement turnaround); lower-income renter base — watch delinquency; 516 units permitted in Jackson County in 2024 (6 in 5+ unit buildings).
- This rent runs 42% of the median local income ($38k/yr) — at the standard rent-burdened threshold; future hikes will face affordability resistance.
Forward outlook
- Local home prices are declining (-3.0%/yr); year-one equity from $553 of loan paydown is wiped out by about $2k of value loss. Plan a longer hold.
Negotiation context
- Only 1 days on market — expect competitive offers; lowballing is unlikely to land.
Risks & watch-outs
- Watch-outs: property tax is 2.7% of price; flood insurance adds $427/mo.
- Climate carrying-cost: in FEMA flood zone AE (mandatory federal flood insurance); severe wind risk, 99% chance of damaging wind over 30y; extreme-heat days projected 7→21/yr by 2055 (HVAC capex compounding) — expect insurance premiums to compound above CPI over the hold.
Questions for the listing agent
- What do current leases actually rent for vs. the listed asking? Can we see a recent rent roll and the last 12 months of T-12 income?
- Built in 1965 — when were the roof, HVAC, electrical panel, plumbing, and water heater last replaced?
- Property tax is high relative to price — has the assessment been appealed recently, and will the sale trigger a re-assessment?
- What's the actual annual flood-insurance premium (NFIP or private), and is the property in a SFHA with mandatory coverage?
- Is there a deadline driving the sale (1031 exchange, divorce, estate, relocation)? That informs how much negotiation room exists.
- Crime grade is F in this area — have there been break-ins, vandalism, or insurance claims at this property in the last 3 years? What carrier currently insures it and at what premium?
- What's the average days-on-market for RENTAL listings here right now (not sales)? A rising rental-DOM trend means longer vacancies and softer asking-rent achievability than the comps imply.
- What's the recent tenant-quality profile in this submarket — average credit score on applications, eviction rate, late-payment / NSF rate, and stable-employment percentage? A property-management company in the area should have these aggregated.
- How much new for-sale + rental construction is in the pipeline within 1–3 miles? Heavy new supply typically softens prices + rents 12–24 months out; constrained supply supports both.
Investment metrics
- 1% rule
- 1.65% ✓
- Cap rate
- 12.47%
- Cash-on-cash
- 22.07%
- DSCR
- 1.98
- GRM
- 5.1
CMA / ARV
- ARV (on-the-fly)
- $104,500
- Comps found
- 9
Show comp detail 9 sales within ~0.75 mi
| Address | Dist | Beds/Ba | Sqft | Sold | Price | $/sf | Match |
|---|---|---|---|---|---|---|---|
| 4603 Legare Ave | 0.11mi | 3/1.0 | 1,008 (+6%) | 6mo | $125,000 | $124 | 80 |
| 3110 Argentina St | 0.42mi | 3/1.5 | 900 (-5%) | 2mo | $60,000 | $67 | 68 |
| 4806 Legare Ave | 0.20mi | 3/1.0 | 1,040 (+10%) | 21mo | $108,000 | $104 | 58 |
| 2713 Brazil St | 0.33mi | 3/2.0 | 1,091 (+15%) | 4mo | $125,000 | $115 | 52 |
| 4302 Newman Ave | 0.33mi | 2/1.0 (-1) | 855 (-10%) | 13mo | $108,000 | $126 | 52 |
| 4607 Seminole Ave | 0.67mi | 3/2.0 | 1,048 (+10%) | 13mo | $110,000 | $105 | 36 |
| 2311 Chicot Rd | 0.65mi | 3/2.5 | 1,023 (+8%) | 21mo | $89,000 | $87 | 33 |
| 3307 Lanier Ave | 0.74mi | 2/1.0 (-1) | 845 (-11%) | 12mo | $99,900 | $118 | 32 |
| 3414 Ken Ave | 0.69mi | 2/1.0 (-1) | 862 (-9%) | 22mo | $94,500 | $110 | 29 |
Match score weights: distance 35% · size 25% · config 20% · recency 20%. Top-matched comps best support the ARV.
Projected returns pro-forma
-3.0% appreciation · 3.0% rent growth · sell at horizon
- IRR
- -17.1%
- Equity multiple
- 0.39×
- Total profit
- $-13,566
- Equity at exit
- $11,928
- IRR
- -8.1%
- Equity multiple
- 0.48×
- Total profit
- $-11,674
- Equity at exit
- $6,917
Cash invested: $22,400 (down + closing). Projections, not guarantees.
Landlord ↔ Tenant lean methodology
- Overall (STATE)
- 90 Strongly Landlord-Friendly
- State Mississippi
- 90 Strongly Landlord-Friendly · R+11
- County
- — inherits STATE
- City
- — inherits STATE
ZIP-level market 39581
- Home prices YoY
- -10.5%
- Active inventory
- 79
- Price-to-rent
- 5.1×
Monthly cashflow live
- Estimated rent
- $1,319 high interval (Pro) →
- Mortgage (P&I)
- −$420
- Tax from tax record
- −$178 /mo · $2,131/yr
- Insurance
- −$33
- Flood insurance flood zone
- −$427 /mo · $5,118/yr
- HOA
- −$0
- Vacancy / Maint / Mgmt
- −$277
- Net cashflow
- $-15
Break-even live
UW: 25.0% down · 7.5% · 30yr · 1.5% tax · 5.0% vac · 8.0% maint · 8.0% mgmt
Financing live
Cash to close
- Down payment
- $20,000
- Closing costs
- $2,400
- Reserves months
- —
- Total cash needed
- —
Loan-product check · same deal, 3 products live
Conventional
25% down · 7.5% · 30yr
- Down + closing
- —
- Monthly P&I
- —
- Monthly cashflow
- —
- DSCR
- —
- Eligible?
- —
Personal DTI + credit; lowest rate.
DSCR
20% down · 8.5% · 30yr
- Down + closing
- —
- Monthly P&I
- —
- Monthly cashflow
- —
- DSCR
- —
- Eligible?
- —
No personal income docs; deal must DSCR.
Hard money
10% down · 12.0% · 12mo
- Down + closing
- —
- Monthly P&I
- —
- Monthly cashflow
- —
- DSCR
- —
- Eligible?
- —
Short-term bridge; refi at stabilization.
Rent comps 8 comps
| Address | Beds | Baths | Sqft | Rent | $/sqft | DOM | Units | Dist |
|---|---|---|---|---|---|---|---|---|
| 4610 Legare Ave Pascagoula, MS | 3.0 | 1.0 | 975 | $1,250 | $1.28 | 21d | 1 | 0.13mi |
| 4502 Newman Ave Pascagoula, MS | 2.0 | 1.0 | 850 | $825 | $0.97 | 13d | 1 | 0.28mi |
| 3000 Brazil St Pascagoula, MS | 1.0–3.0 | 1.0 | 695 | $1,430 | $2.06 | 13d | 12 | 0.31mi |
| 4315 Orchard Ave Pascagoula, MS | 2.0 | 1.5 | 921 | $1,267 | $1.37 | 13d | 21 | 0.41mi |
| 5111 Orchard Ave Pascagoula, MS | 1.0–3.0 | 1.0–1.5 | 853 | $1,430 | $1.68 | 13d | 15 | 0.56mi |
| 3015 Eden St Pascagoula, MS | 1.0–3.0 | 1.0–1.5 | 875 | $1,430 | $1.63 | 13d | 43 | 0.91mi |
| 3801 Melton Dr Pascagoula, MS | 1.0–3.0 | 1.0–2.0 | 825 | $1,430 | $1.73 | 13d | 43 | 1.15mi |
| 4800 Long Ave Pascagoula, MS | 1.0–3.0 | 1.0–2.0 | 904 | $1,430 | $1.58 | 13d | 27 | 1.26mi |
Listing history 3 events
-
2026-06-17remarks 559-char remark
-
2026-06-17remarks 532-char remark
-
2026-06-17$80,000 Active 1 DOM
ⓘ Source: listings_history table (triggers on properties + properties_extension) + one-shot
backfill from property_details.listing_events for pre-trigger history.
Tax reassessment forecast MS · Resets to sale price
- Current annual tax
- $2,131 · $178/mo
- Projected year-2 tax
- $2,131 · $178/mo
- Expected delta
- $0/yr ($0/mo · 0.0%)
ⓘ Screening estimate from a state-policy table — verify with the county assessor before closing.
Climate risk First Street
- Flood 9/10 Extreme FEMA zone AE · 99% chance over 30 yrs
- Wildfire 2/10 Low
- Heat 10/10 Extreme 7 d/yr ≥105°F today · 21 d/yr by 30 yrs out
- Wind 9/10 Extreme 99% chance of damaging wind over 30 yrs
- Air quality 3/10 Moderate 2 unhealthy d/yr today · 3 by 30 yrs out
Nearby sold comps map
Loading sold comps map…
Walkable amenities ~0.75 mi
Loading nearby amenities…
Taxation est. · year 1
- Rental income
- $15,833
- − Mortgage interest
- −$4,481
- − Property taxes
- −$2,131
- − Insurance
- −$5,518
- − Repairs & maintenance
- −$1,267
- − Management
- −$1,267
- − Depreciation
- −$2,327
- Taxable loss
- −$1,158
- Est. tax savings @ 24.0%
- +$278
- After-tax cash flow
- $102/yr
For passive investors: Depreciation is non-cash, so a rental often shows a tax loss while cash-flowing — sheltering income. Rental losses are passive: they offset passive income freely, and up to $25,000/yr can offset ordinary (W-2) income if you actively participate and your MAGI is under $100k (phasing out to $0 by $150k); unused losses carry forward. On sale, claimed depreciation is recaptured at up to 25%, and gains may owe capital-gains tax (a 1031 exchange can defer both). Figures are a year-1 estimate at your 24.0% rate — not tax advice; consult a CPA.
Schools (NCES district)
- District
- Pascagoula-Gautier School District
- NCES district ID
- 2803480
- Math proficiency
- 40% ▼ -3.00%
- Reading proficiency
- 38% ▼ -4.00%
- Median HH income
- $41,392
- Composite
- 32.86/100
- National rank
- #5613
- State rank
- #41 of 130 in MS
Livability — Pascagoula
- Score
- 70/100
- State rank
- #41
- US rank
- #7866
Category grades
Schools grade is shown separately in the Schools card above.
Census & demographics
- Census place
- Pascagoula, MS
- County
- Jackson County · 82,196 people
- City population
- 21,731
- Metro
- Gulfport-Biloxi, MS
- Population (ZIP)
- 11,390
- Household income
- $37,927
- Rent vs Own
- Severe rent burden
- 965.0
Population outlook (Jackson County) Hauer SSP2
- Today (2025)
- 146,926 people
- By 2030
- 148,442 · +1.0%
- By 2040
- 149,631 · +1.8%
- By 2050
- 148,723 · +1.2%
- By 2075
- 147,845 · +0.6%
- By 2100
- 144,510 · -1.6%
Race, ethnicity, and origin ACS 2023
- Neighborhood character
- Diverse neighborhood (Simpson 0.66)
- Race & ethnicity
- Black 40% White 38% Hispanic / Latino 18% Two or more races 7% Asian 2%
- Hispanic origin (detail)
- Mexican 3% Puerto Rican 7% Dominican 5%
- Common ancestry
- Lithuanian 2% Serbian 2% Slovak 1%
- Foreign-born
- 8% · Canada
- Languages at home
- 82% English-only · Spanish 16% Other Indo-European 1%
Political lean MEDSL · Jackson
- 2024 margin
- Solid R (+39.9) · D 29.5% · R 69.4% · Other 1.1%
- 2008→2024 swing
- -6.4pp toward R · 2008: -33.5pp · 2024: -39.9pp
- All cycles
- 2024: R+39.9 2020: R+34.6 2016: R+39.9 2012: R+36.1 2008: R+33.5
Not yet ingested
- Civics
- —
Market trends
- HPI YoY
- ▼ -22.34%
- Current HPI
- 191.273
- Rent YoY
- —
- Metro
- Gulfport-Biloxi, MS
- State GDP YoY
- —
- F500 in state
- 0
Price history
1 event — show timeline
- 2026-06-17 Listed $80,000 MLSU
Property tax history
+13.0%/yrLatest (2025): $2,131 · +8.7% YoY. Source: county tax records.
Cash-flow waterfall
monthlySold comps — $/sqft
last 12 mo · ≤1 miLoading sold comps…