 7-Plex
91 ROMAINE Ave · Jersey City, NJ
Flood risk 1/10 · Minimal
- FEMA flood zone
- X (unshaded)
- Chance of flooding over 30 yrs
- 0.0%
- Est. flood insurance / yr
- $507 – $1,088
Fire risk 1/10 · Minimal
- Est. fire insurance / yr
- $526 – $976
Heat risk 7/10 · Major
- Hot days now (above 98°F)
- 7 days/yr
- Hot days in 30 yrs
- 15 days/yr
Wind risk 6/10 · Moderate
- Chance of severe wind over 30 yrs
- 27.0%
Air-quality risk 4/10 · Minor
- Unhealthy air days now
- 5 days/yr
- Unhealthy air days in 30 yrs
- 6 days/yr
Risk factors via First Street. Map © Google.
Why this score? — see what drove the C+ grade
The composite is a weighted blend of 9 inputs, each scored 0–100. Each bar is that input's sub-score; the figure is the points it added to the 100-point composite (weight × sub-score).
- Cash flow +26.0/30.0
- DSCR +8.8/10.0
- ARV discount +7.5/15.0
- 1% rule +6.5/10.0
- Livability +3.9/5.0
- Rent growth +3.2/5.0
- Condition / age +2.5/5.0
- Schools +2.4/10.0
- Appreciation +0.0/10.0
$1,600,000
🖨 Deal sheet 📄 Offer letter ✓ Due diligence
Multi-family units
County records classify this as Multi-Family (5+ Unit). Listing-text estimate: 7 units. confirmed
5+ unit building — per-unit beds/baths from public records are typically unavailable; the breakdown below (if shown) is an estimate from the listing text.
Listing remarks
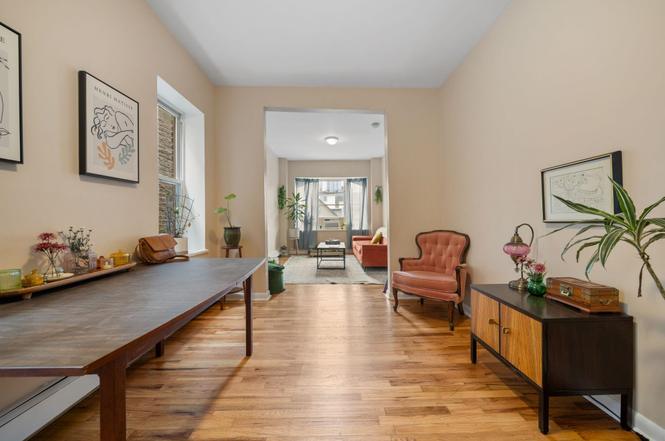
Tenant occupied. Showing Unit 2, 6 on Thursday, Jan 1 between 12 - 2pm; Saturday Jan 3, from 11am - 12pm. Multifamily Investors or Developers Delight! Welcome to 91 Romaine Ave, a premium 3 story, 7-unit residential building in the heart of Journal Square, on an oversized 3,337 SQFT Oversized lot in R3 Zone. Unit mix includes spacious 2 or 3 bedroom, 1 bathroom units. Property is fully occupied with below market rents, with current gross rental income of $109,056, offering an upside with a potential gross income of ~ $180,000, at market rents. Property is in excellent condition, four of the seven units have been recently renovated. Each unit comes with sub-metered utilities including indivi
Key facts
- 4 story building
- R3 zoning
- Recently renovated
Tags
Neighborhood map
What this means for you Summary
Snapshot
- This is a 7 × 2-bed/1.0-bath units multifamily listed at $1.60M.
Deal economics
- At list price, monthly cash flow is $4k ($48k/yr) — positive. Per door: $571/mo.
- The deal already cash-flows at list — no discount required.
- Meets the 1% rule at list price ($18k rent vs $1.60M).
- Recommended offer: $1.55M (3.0% below list) — sets the bar for market timing.
- Cap rate 9.3% vs local median 1.8% in Jersey City — top-decile yield for the area; either an underpriced asset or a hidden risk that comps aren't pricing in. Stress-test before assuming the spread holds.
Location & tenants
- Location reads 77/100 on livability (#116 in NJ, #2,955 nationally) — a middle-class / working-renter tenant base. Strengths: amenities A+, commute A+, employment A+; Watch: crime F, cost of living F.
- Jersey City Public Schools (urban): math 16% / reading 38% proficiency, ranked #369 of 472 in NJ (top 78%) — low school quality limits family demand, transient renter base, plan for 1-2y turnover; 69% free/reduced lunch — lower-income household profile, screen leases tightly.
- Market conditions: Rents rising (+2.6%/yr); 217 active listings in the ZIP; 5,310 units permitted in Hudson County in 2024 (4,154 in 5+ unit buildings).
- At $18,473/mo this rent would consume 296% of the median local household income ($75k/yr) (locally 4050% of renters already pay >50% of income on rent) — very limited rent-growth headroom before tenants either downsize or default.
Forward outlook
- Local home prices are declining (-3.0%/yr); year-one equity from $11k of loan paydown is wiped out by about $48k of value loss. Plan a longer hold.
- Hudson County population projected at +29% by 2050 — long-run rental-demand tailwind backs the buy-and-hold thesis.
Negotiation context
- It's been on market 49 days — a 3% lower offer ($1.55M) is reasonable based on typical stale-listing flexibility.
- 3 sale attempts with the ask held roughly flat each time — persistent listings suggest the price (not the market) is what's stuck; bring a comps-based counter.
- Current owner paid $680k; list at $1.60M implies a 135% gain — meaningful room to come down on a strong offer.
Risks & watch-outs
- Watch-outs: built in 1913 — expect roof / HVAC / electrical / plumbing capex.
- Climate carrying-cost: major wind risk, 27% chance of damaging wind over 30y; extreme-heat days projected 7→15/yr by 2055 (HVAC capex compounding) — expect insurance premiums to compound above CPI over the hold.
Questions for the listing agent
- It's been on market 49 days. Have you received any prior offers? Is the seller open to a 3% concession, seller financing, or rate buy-down credit?
- Can we see the unit-by-unit rent roll, current vacancy, and any below-market leases? What's the average tenancy length?
- What capital expenditures (roof, boiler, parking lot, exteriors) have been made in the last 5 years, and what's planned in the next 2?
- Built in 1913 — when were the roof, HVAC, electrical panel, plumbing, and water heater last replaced?
- Is there a deadline driving the sale (1031 exchange, divorce, estate, relocation)? That informs how much negotiation room exists.
- Schools are B-rated — typically a magnet for longer-tenancy family renters. What's the average tenant stay here, and is there a school-zone premium baked into asking?
- Crime grade is F in this area — have there been break-ins, vandalism, or insurance claims at this property in the last 3 years? What carrier currently insures it and at what premium?
- What's the average days-on-market for RENTAL listings here right now (not sales)? A rising rental-DOM trend means longer vacancies and softer asking-rent achievability than the comps imply.
- What's the recent tenant-quality profile in this submarket — average credit score on applications, eviction rate, late-payment / NSF rate, and stable-employment percentage? A property-management company in the area should have these aggregated.
- How much new apartment / multifamily construction is in the pipeline within 1–3 miles? Heavy new supply (>2% of stock underway) typically softens rents 12–24 months out; light construction supports rent growth.
Investment metrics
- 1% rule
- 1.15% ✓
- Cap rate
- 9.29%
- Cash-on-cash
- 10.70%
- DSCR
- 1.48
- GRM
- 7.2
CMA / ARV
No comps found within radius.
Projected returns pro-forma
-3.0% appreciation · 2.65% rent growth · sell at horizon
- IRR
- -0.7%
- Equity multiple
- 0.97×
- Total profit
- $-11,401
- Equity at exit
- $238,565
- IRR
- 8.6%
- Equity multiple
- 1.65×
- Total profit
- $291,168
- Equity at exit
- $138,339
Cash invested: $448,000 (down + closing). Projections, not guarantees.
Landlord ↔ Tenant lean methodology
- Overall (CITY)
- 6 Strongly Tenant-Friendly
- State New Jersey
- 21 Tenant-Leaning · D+6
- County
- — inherits STATE
- City Jersey City
- 6 Strongly Tenant-Friendly · D+34
ZIP-level market 07306
- Rents YoY
- 2.6%
- Active inventory
- 217
- Price-to-rent
- 50.5×
Monthly cashflow live
- Estimated rent
- $18,473 high interval (Pro) →
- Mortgage (P&I)
- −$8,391
- Tax from tax record
- −$1,543 /mo · $18,514/yr
- Insurance
- −$667
- HOA
- −$0
- Vacancy / Maint / Mgmt
- −$3,879
- Net cashflow
- $3,994
Break-even live
7-unit breakdown (identical units grouped — click to expand)
| Units | Beds | Baths | Est. rent |
|---|---|---|---|
| 7× units | 2 | 1 | $18,473 |
| #1 | 2 | 1 | $2,639 |
| #2 | 2 | 1 | $2,639 |
| #3 | 2 | 1 | $2,639 |
| #4 | 2 | 1 | $2,639 |
| #5 | 2 | 1 | $2,639 |
| #6 | 2 | 1 | $2,639 |
| #7 | 2 | 1 | $2,639 |
| Total (7 units) | $18,473 | ||
UW: 25.0% down · 7.5% · 30yr · 1.5% tax · 5.0% vac · 8.0% maint · 8.0% mgmt
Financing live
Cash to close
- Down payment
- $400,000
- Closing costs
- $48,000
- Reserves months
- —
- Total cash needed
- —
Loan-product check · same deal, 3 products live
Conventional
25% down · 7.5% · 30yr
- Down + closing
- —
- Monthly P&I
- —
- Monthly cashflow
- —
- DSCR
- —
- Eligible?
- —
Personal DTI + credit; lowest rate.
DSCR
20% down · 8.5% · 30yr
- Down + closing
- —
- Monthly P&I
- —
- Monthly cashflow
- —
- DSCR
- —
- Eligible?
- —
No personal income docs; deal must DSCR.
Hard money
10% down · 12.0% · 12mo
- Down + closing
- —
- Monthly P&I
- —
- Monthly cashflow
- —
- DSCR
- —
- Eligible?
- —
Short-term bridge; refi at stabilization.
Listing history 13 events
-
2026-01-31status Under Contract
-
2025-12-12$1,600,000 Active
-
2025-12-09historical
-
2025-09-26status Active
-
2025-08-05$1,750,000 Active
-
2009-04-15soldstatus $680,500
-
2000-05-23soldstatus $275,000
-
1993-03-08soldstatus $50,000
-
1988-11-18soldstatus $200,000
-
1986-07-26soldstatus $132,500
-
1986-06-05soldstatus $265,000
-
1983-04-01soldstatus $70,000
-
1981-06-01soldstatus $57,000
ⓘ Source: listings_history table (triggers on properties + properties_extension) + one-shot
backfill from property_details.listing_events for pre-trigger history.
Tax reassessment forecast NJ · Partial reset (capped growth)
- Current annual tax
- $18,514 · $1,543/mo
- Projected year-2 tax
- $29,177 · $2,431/mo
- Expected delta
- +$10,663/yr (+$889/mo · 57.6%)
ⓘ Screening estimate from a state-policy table — verify with the county assessor before closing.
Climate risk First Street
- Flood 1/10 Low FEMA zone X (unshaded) · 0% chance over 30 yrs
- Wildfire 1/10 Low
- Heat 7/10 Severe 7 d/yr ≥98°F today · 15 d/yr by 30 yrs out
- Wind 6/10 Major 27% chance of damaging wind over 30 yrs
- Air quality 4/10 Moderate 5 unhealthy d/yr today · 6 by 30 yrs out
Nearby sold comps map
Loading sold comps map…
Walkable amenities ~0.75 mi
Loading nearby amenities…
Taxation est. · year 1
- Rental income
- $221,676
- − Mortgage interest
- −$89,625
- − Property taxes
- −$18,514
- − Insurance
- −$8,000
- − Repairs & maintenance
- −$17,734
- − Management
- −$17,734
- − Depreciation
- −$46,545
- Taxable income
- $23,523
- Est. tax owed @ 24.0%
- −$5,646
- After-tax cash flow
- $42,277/yr
For passive investors: Depreciation is non-cash, so a rental often shows a tax loss while cash-flowing — sheltering income. Rental losses are passive: they offset passive income freely, and up to $25,000/yr can offset ordinary (W-2) income if you actively participate and your MAGI is under $100k (phasing out to $0 by $150k); unused losses carry forward. On sale, claimed depreciation is recaptured at up to 25%, and gains may owe capital-gains tax (a 1031 exchange can defer both). Figures are a year-1 estimate at your 24.0% rate — not tax advice; consult a CPA.
Schools (NCES district)
- District
- Jersey City Public Schools
- NCES district ID
- 3407830
- Math proficiency
- 16% ▼ -17.00%
- Reading proficiency
- 38% ▼ -11.00%
- Median HH income
- $58,431
- Composite
- 24.43/100
- National rank
- #7678
- State rank
- #369 of 472 in NJ
Livability — Jersey City
- Score
- 77/100
- State rank
- #116
- US rank
- #2955
Category grades
Schools grade is shown separately in the Schools card above.
Census & demographics
- Census place
- Jersey City, NJ
- County
- Hudson County · 718,323 people
- City population
- 294,078
- Metro
- New York-Newark-Jersey City, NY-NJ-PA
- Population (ZIP)
- 54,017
- Household income
- $74,953
- Rent vs Own
- Severe rent burden
- 4050.0
Population outlook (Hudson County) Hauer SSP2
- Today (2025)
- 771,834 people
- By 2030
- 818,028 · +6.0%
- By 2040
- 907,866 · +17.6%
- By 2050
- 994,480 · +28.8%
- By 2075
- 1,163,301 · +50.7%
- By 2100
- 1,254,703 · +62.6%
Race, ethnicity, and origin ACS 2023
- Neighborhood character
- Highly diverse neighborhood (Simpson 0.75)
- Race & ethnicity
- Asian 33% White 25% Hispanic / Latino 25% Two or more races 15% Black 12% Native American 1%
- Hispanic origin (detail)
- Mexican 1% Puerto Rican 7% Dominican 6%
- Common ancestry
- Romanian 2% Hispanic 1% Scotch-Irish 1%
- Foreign-born
- 51% · Canada, China, Jamaica
- Languages at home
- 38% English-only · Spanish 20% Other Indo-European 18% Arabic 8%
Political lean MEDSL · Hudson
- 2024 margin
- Strong D (+28.1) · D 62.6% · R 34.6% · Other 2.8%
- 2008→2024 swing
- -18.7pp toward R · 2008: 46.7pp · 2024: 28.1pp
- All cycles
- 2024: D+28.1 2020: D+46.2 2016: D+51.8 2012: D+55.7 2008: D+46.7
Not yet ingested
- Civics
- —
Market trends
- HPI YoY
- ▼ -219.21%
- Current HPI
- 352.909
- Rent YoY
- ▲ 2.65%
- Metro
- New York-Newark-Jersey City, NY-NJ-PA
- State GDP YoY
- ▲ 2.05%
- F500 in state
- 34
Industry mix (Fortune 500 HQ in NJ)
| Industry | F500 HQs | Revenue |
|---|---|---|
| Consumer Goods | 3 | $31B |
|
||
| Pharmaceuticals | 2 | $153B |
|
||
| Technology | 2 | $21B |
|
||
| Insurance | 2 | $20B |
|
||
| Healthcare | 2 | $19B |
|
||
| Financial Services | 1 | $70B |
|
||
Price history
+2707.0% since first listed13 events — show timeline
- 2026-01-31 Pending — HCMLS
- 2025-12-12 Listed $1,600,000 HCMLS
- 2025-12-09 Listing Removed — HCMLS
- 2025-09-26 Relisted — HCMLS
- 2025-08-05 Listed $1,750,000 HCMLS
- 2009-04-15 Sold (Public Records) $680,500 Public Records
- 2000-05-23 Sold (Public Records) $275,000 Public Records
- 1993-03-08 Sold (Public Records) $50,000 Public Records
- 1988-11-18 Sold (Public Records) $200,000 Public Records
- 1986-07-26 Sold (Public Records) $132,500 Public Records
- 1986-06-05 Sold (Public Records) $265,000 Public Records
- 1983-04-01 Sold (Public Records) $70,000 Public Records
- 1981-06-01 Sold (Public Records) $57,000 Public Records
Property tax history
+3.8%/yrLatest (2025): $18,514 · +4.6% YoY. Source: county tax records.
Cash-flow waterfall
monthlySold comps — $/sqft
last 12 mo · ≤1 miLoading sold comps…