 9-Plex
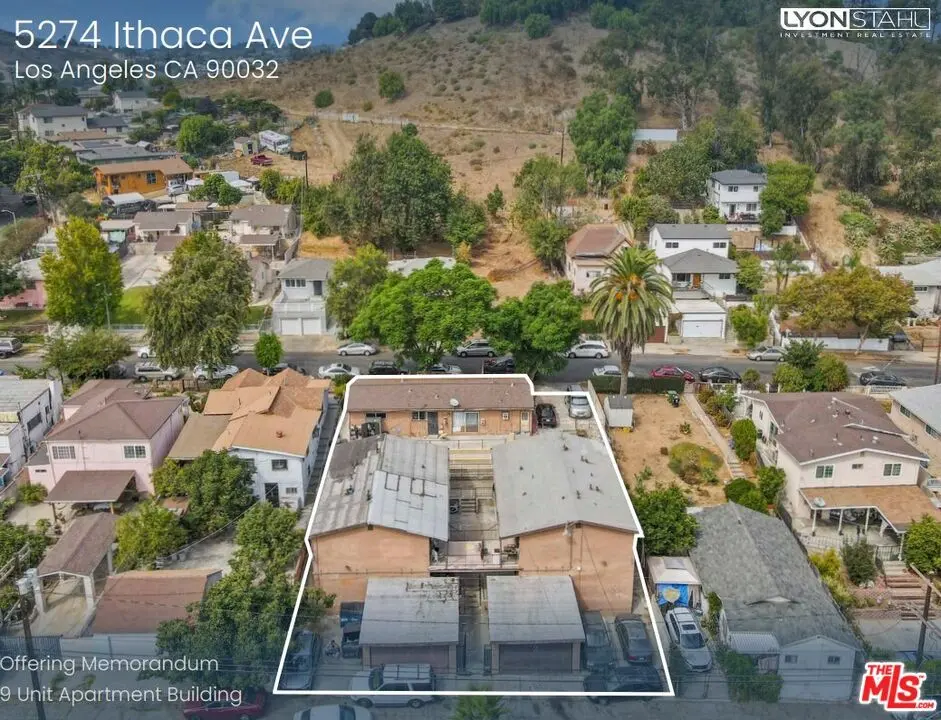
5274 Ithaca Ave · Los Angeles, CA
Flood risk 1/10 · Minimal
- FEMA flood zone
- X (unshaded)
- Chance of flooding over 30 yrs
- 0.0%
- Est. flood insurance / yr
- $507 – $1,088
Fire risk 1/10 · Minimal
- Est. fire insurance / yr
- $659 – $1,223
Heat risk 6/10 · Moderate
- Hot days now (above 97°F)
- 7 days/yr
- Hot days in 30 yrs
- 22 days/yr
Wind risk 1/10 · Minimal
- Chance of severe wind over 30 yrs
- —
Air-quality risk 6/10 · Moderate
- Unhealthy air days now
- 11 days/yr
- Unhealthy air days in 30 yrs
- 12 days/yr
Risk factors via First Street. Map © Google.
Why this score? — see what drove the C+ grade
The composite is a weighted blend of 9 inputs, each scored 0–100. Each bar is that input's sub-score; the figure is the points it added to the 100-point composite (weight × sub-score).
- Cash flow +26.2/30.0
- ARV discount +9.3/15.0
- DSCR +8.9/10.0
- 1% rule +6.7/10.0
- Rent growth +4.3/5.0
- Schools +3.6/10.0
- Livability +3.4/5.0
- Condition / age +2.5/5.0
- Appreciation +0.0/10.0
$1,650,000
🖨 Deal sheet 📄 Offer letter ✓ Due diligence
Multi-family units
County records classify this as Multi-Family (5+ Unit). Listing-text estimate: 9 units. confirmed
5+ unit building — per-unit beds/baths from public records are typically unavailable; the breakdown below (if shown) is an estimate from the listing text.
Listing remarks MLS
Located in the growing community of El Sereno, 5274 Ithaca Ave is a well-positioned 9-unit apartment building offered at$1,650,000. With a strong 7.23% Cap Rate and 8.59 GRM, this property provides immediate income along with long-term potential. The unit mix includes (1) 3-bed/1-bath, (4) 2-bed/1-bath, and (4) 1-bed/1-bath units spread across 5,439 square feet of living space. A large lot offers ADU development potential for added upside (buyer to verify). An excellent investment in a rapidly developing pocket of Northeast LA, with convenient access to Downtown, Highland Park, and surrounding neighborhoods
Key facts
- Convenient access
- Strong cap rate
- Excellent investment
Tags
Neighborhood map
What this means for you Summary
Snapshot
- This is a 1×3bd/1ba + 4×2bd/1ba + 4×1bd/1ba units multifamily listed at $1.65M.
Deal economics
- At list price, monthly cash flow is $4k ($50k/yr) — positive. Per door: $466/mo.
- The deal already cash-flows at list — no discount required.
- Meets the 1% rule at list price ($19k rent vs $1.65M).
- Recommended offer: $1.55M (6.0% below list) — sets the bar for market timing.
- Cap rate 9.3% vs local median 2.1% in Los Angeles — top-decile yield for the area; either an underpriced asset or a hidden risk that comps aren't pricing in. Stress-test before assuming the spread holds.
Location & tenants
- Location reads 68/100 on livability (#273 in CA) — a middle-class / working-renter tenant base. Strengths: amenities A+, commute A+, employment B; Watch: health & safety C-, schools D+, crime F.
- Los Angeles Unified (urban): math 29% / reading 54% proficiency, ranked #223 of 517 in CA (top 43%) — families likely to look elsewhere, expect single-tenant / working-renter base with shorter leases; 67% free/reduced lunch — lower-income household profile, screen leases tightly.
- Market conditions: Rents rising fast (+7.2%/yr); 153 active listings in the ZIP; solid renter incomes; 19,697 units permitted in Los Angeles County in 2024 (9,426 in 5+ unit buildings).
- At $19,285/mo this rent would consume 281% of the median local household income ($82k/yr) (locally 1522% of renters already pay >50% of income on rent) — very limited rent-growth headroom before tenants either downsize or default.
Forward outlook
- Local home prices are declining (-3.0%/yr); year-one equity from $11k of loan paydown is wiped out by about $50k of value loss. Plan a longer hold.
- Los Angeles County population projected at +9% by 2050 — modest demand growth; plan on rents tracking national, not racing it.
- At projected returns (-3.0% appreciation + 7.2% rent growth), your $462k cash investment doubles in ~8 years — after that, you're playing with house money.
Negotiation context
- It's been on market 62 days — a 6% lower offer ($1.55M) is reasonable based on typical stale-listing flexibility.
- 7 sale attempts since 19y ago with the ask held roughly flat each time — persistent listings suggest the price (not the market) is what's stuck; bring a comps-based counter.
Risks & watch-outs
- Climate carrying-cost: extreme-heat days projected 7→22/yr by 2055 (HVAC capex compounding) — expect insurance premiums to compound above CPI over the hold.
Questions for the listing agent
- It's been on market 62 days. Have you received any prior offers? Is the seller open to a 6% concession, seller financing, or rate buy-down credit?
- Can we see the unit-by-unit rent roll, current vacancy, and any below-market leases? What's the average tenancy length?
- What capital expenditures (roof, boiler, parking lot, exteriors) have been made in the last 5 years, and what's planned in the next 2?
- Built in 1963 — when were the roof, HVAC, electrical panel, plumbing, and water heater last replaced?
- Why hasn't it sold? Are there any deal-killer items the seller is aware of (foundation, flood, title, zoning, code violations)?
- Is there a deadline driving the sale (1031 exchange, divorce, estate, relocation)? That informs how much negotiation room exists.
- Schools are D-rated, which usually means shorter tenancies and higher turnover. Who's the typical renter profile here, and what's been the actual vacancy rate?
- Crime grade is F in this area — have there been break-ins, vandalism, or insurance claims at this property in the last 3 years? What carrier currently insures it and at what premium?
- What's the average days-on-market for RENTAL listings here right now (not sales)? A rising rental-DOM trend means longer vacancies and softer asking-rent achievability than the comps imply.
- What's the recent tenant-quality profile in this submarket — average credit score on applications, eviction rate, late-payment / NSF rate, and stable-employment percentage? A property-management company in the area should have these aggregated.
- How much new apartment / multifamily construction is in the pipeline within 1–3 miles? Heavy new supply (>2% of stock underway) typically softens rents 12–24 months out; light construction supports rent growth.
Investment metrics
- 1% rule
- 1.17% ✓
- Cap rate
- 9.35%
- Cash-on-cash
- 10.90%
- DSCR
- 1.49
- GRM
- 7.1
CMA / ARV
- ARV (median comp)
- $1,718,757
- List price
- $1,650,000
- Delta
- -4.00%
- Verdict
- FAIR
- Comps
- 5 within 1.0 mi
Projected returns pro-forma
-3.0% appreciation · 7.21% rent growth · sell at horizon
- IRR
- 4.6%
- Equity multiple
- 1.18×
- Total profit
- $85,189
- Equity at exit
- $246,020
- IRR
- 17.5%
- Equity multiple
- 2.73×
- Total profit
- $799,849
- Equity at exit
- $142,662
Cash invested: $462,000 (down + closing). Projections, not guarantees.
Landlord ↔ Tenant lean methodology
- Overall (CITY)
- 0 Strongly Tenant-Friendly
- State California
- 18 Strongly Tenant-Friendly · D+13
- County
- — inherits STATE
- City Los Angeles
- 0 Strongly Tenant-Friendly · D+22
ZIP-level market 90032
- Rents YoY
- 7.2%
- Active inventory
- 153
- Price-to-rent
- 52.6×
Monthly cashflow live
- Estimated rent
- $19,285 medium interval (Pro) →
- Mortgage (P&I)
- −$8,653
- Tax from tax record
- −$1,697 /mo · $20,368/yr
- Insurance
- −$688
- HOA
- −$0
- Vacancy / Maint / Mgmt
- −$4,050
- Net cashflow
- $4,198
Break-even live
9-unit breakdown (identical units grouped — click to expand)
| Units | Beds | Baths | Est. rent |
|---|---|---|---|
| 1× unit | 3 | 1 | $2,616 |
| 4× units | 2 | 1 | $9,244 |
| #2 | 2 | 1 | $2,311 |
| #3 | 2 | 1 | $2,311 |
| #4 | 2 | 1 | $2,311 |
| #5 | 2 | 1 | $2,311 |
| 4× units | 1 | 1 | $7,424 |
| #6 | 1 | 1 | $1,856 |
| #7 | 1 | 1 | $1,856 |
| #8 | 1 | 1 | $1,856 |
| #9 | 1 | 1 | $1,856 |
| Total (9 units) | $19,285 | ||
UW: 25.0% down · 7.5% · 30yr · 1.5% tax · 5.0% vac · 8.0% maint · 8.0% mgmt
Financing live
Cash to close
- Down payment
- $412,500
- Closing costs
- $49,500
- Reserves months
- —
- Total cash needed
- —
Loan-product check · same deal, 3 products live
Conventional
25% down · 7.5% · 30yr
- Down + closing
- —
- Monthly P&I
- —
- Monthly cashflow
- —
- DSCR
- —
- Eligible?
- —
Personal DTI + credit; lowest rate.
DSCR
20% down · 8.5% · 30yr
- Down + closing
- —
- Monthly P&I
- —
- Monthly cashflow
- —
- DSCR
- —
- Eligible?
- —
No personal income docs; deal must DSCR.
Hard money
10% down · 12.0% · 12mo
- Down + closing
- —
- Monthly P&I
- —
- Monthly cashflow
- —
- DSCR
- —
- Eligible?
- —
Short-term bridge; refi at stabilization.
Listing history 28 events
-
2026-06-18days on market $1,650,000 Active 62 DOM
-
2026-06-17days on market $1,650,000 Active 61 DOM
-
2026-06-16days on market $1,650,000 Active 60 DOM
-
2026-06-15days on market $1,650,000 Active 59 DOM
-
2026-06-13days on market $1,650,000 Active 57 DOM
-
2026-06-09days on market $1,650,000 Active 53 DOM
-
2026-06-08days on market $1,650,000 Active 52 DOM
-
2026-06-07days on market $1,650,000 Active 51 DOM
-
2026-06-04days on market $1,650,000 Active 48 DOM
-
2026-06-03days on market $1,650,000 Active 47 DOM
-
2026-06-02days on market $1,650,000 Active 46 DOM
-
2026-06-01days on market $1,650,000 Active 45 DOM
-
2026-05-31days on market $1,650,000 Active 44 DOM
-
2026-04-17$1,650,000 Active 614-char remark
Show marketing remark (614 chars)
Located in the growing community of El Sereno, 5274 Ithaca Ave is a well-positioned 9-unit apartment building offered at$1,650,000. With a strong 7.23% Cap Rate and 8.59 GRM, this property provides immediate income along with long-term potential. The unit mix includes (1) 3-bed/1-bath, (4) 2-bed/1-bath, and (4) 1-bed/1-bath units spread across 5,439 square feet of living space. A large lot offers ADU development potential for added upside (buyer to verify). An excellent investment in a rapidly developing pocket of Northeast LA, with convenient access to Downtown, Highland Park, and surrounding neighborhoods
-
2025-11-17historical
-
2025-11-10status Active
-
2025-09-24historical Active Under Contract
-
2025-05-29$1,700,000 Active
-
2024-10-08Active
-
2018-04-09soldstatus $1,442,000
-
2012-12-18historical
-
2012-11-25price $1,095,000
-
2012-11-25$104,900,000 Active
-
2008-03-21historical
-
2007-12-09$1,049,000
-
2007-11-06historical
-
2007-06-20$1,085,000
-
2004-11-16soldstatus $655,000
ⓘ Source: listings_history table (triggers on properties + properties_extension) + one-shot
backfill from property_details.listing_events for pre-trigger history.
Tax reassessment forecast CA · Resets to sale price
- Current annual tax
- $20,368 · $1,697/mo
- Projected year-2 tax
- $20,368 · $1,697/mo
- Expected delta
- $0/yr ($0/mo · 0.0%)
ⓘ Screening estimate from a state-policy table — verify with the county assessor before closing.
Climate risk First Street
- Flood 1/10 Low FEMA zone X (unshaded) · 0% chance over 30 yrs
- Wildfire 1/10 Low
- Heat 6/10 Major 7 d/yr ≥97°F today · 22 d/yr by 30 yrs out
- Wind 1/10 Low
- Air quality 6/10 Major 11 unhealthy d/yr today · 12 by 30 yrs out
Nearby sold comps map
Loading sold comps map…
Walkable amenities ~0.75 mi
Loading nearby amenities…
Taxation est. · year 1
- Rental income
- $231,420
- − Mortgage interest
- −$92,426
- − Property taxes
- −$20,368
- − Insurance
- −$8,250
- − Repairs & maintenance
- −$18,514
- − Management
- −$18,514
- − Depreciation
- −$48,000
- Taxable income
- $25,349
- Est. tax owed @ 24.0%
- −$6,084
- After-tax cash flow
- $44,287/yr
For passive investors: Depreciation is non-cash, so a rental often shows a tax loss while cash-flowing — sheltering income. Rental losses are passive: they offset passive income freely, and up to $25,000/yr can offset ordinary (W-2) income if you actively participate and your MAGI is under $100k (phasing out to $0 by $150k); unused losses carry forward. On sale, claimed depreciation is recaptured at up to 25%, and gains may owe capital-gains tax (a 1031 exchange can defer both). Figures are a year-1 estimate at your 24.0% rate — not tax advice; consult a CPA.
Schools (NCES district)
- District
- Los Angeles Unified
- NCES district ID
- 0622710
- Math proficiency
- 29% ▼ -4.00%
- Reading proficiency
- 54% ▲ 10.00%
- Median HH income
- $50,403
- Composite
- 35.67/100
- National rank
- #4875
- State rank
- #223 of 517 in CA
Livability — Los Angeles
- Score
- 68/100
- State rank
- #273
- US rank
- #9237
Category grades
Schools grade is shown separately in the Schools card above.
Census & demographics
- Census place
- Los Angeles, CA
- County
- Los Angeles County · 9,444,647 people
- City population
- 3,838,149
- Metro
- Los Angeles-Long Beach-Anaheim, CA
- Population (ZIP)
- 43,117
- Household income
- $82,292
- Rent vs Own
- Severe rent burden
- 1522.0
Population outlook (Los Angeles County) Hauer SSP2
- Today (2025)
- 10,940,515 people
- By 2030
- 11,256,481 · +2.9%
- By 2040
- 11,729,929 · +7.2%
- By 2050
- 11,948,407 · +9.2%
- By 2075
- 11,818,114 · +8.0%
- By 2100
- 10,842,928 · -0.9%
Race, ethnicity, and origin ACS 2023
- Neighborhood character
- Predominantly Hispanic (74%)
- Race & ethnicity
- Hispanic / Latino 74% Two or more races 19% Asian 12% White 10% Black 3% Native American 2%
- Hispanic origin (detail)
- Mexican 60%
- Common ancestry
- Iranian 1%
- Foreign-born
- 36% · Canada, China, South Korea
- Languages at home
- 33% English-only · Spanish 57% Chinese 6% Tagalog/Filipino 1%
Political lean MEDSL · Los Angeles
- 2024 margin
- Solid D (+32.9) · D 64.8% · R 31.9% · Other 3.3%
- 2008→2024 swing
- -7.4pp toward R · 2008: 40.4pp · 2024: 32.9pp
- All cycles
- 2024: D+32.9 2020: D+44.2 2016: D+48.0 2012: D+40.0 2008: D+40.4
Not yet ingested
- Civics
- —
Market trends
- HPI YoY
- ▼ -1250.52%
- Current HPI
- 507.2343
- Rent YoY
- ▲ 7.21%
- Metro
- Los Angeles-Long Beach-Anaheim, CA
- State GDP YoY
- ▲ 3.21%
- F500 in state
- 116
Industry mix (Fortune 500 HQ in CA)
| Industry | F500 HQs | Revenue |
|---|---|---|
| Technology | 27 | $1,492B |
|
||
| Financial Services | 3 | $174B |
|
||
| Retail | 3 | $44B |
|
||
| Insurance | 3 | $26B |
|
||
| Media / Entertainment | 2 | $115B |
|
||
| Pharmaceuticals / Biotech | 2 | $62B |
|
||
Price history
+151.9% since first listed15 events — show timeline
- 2026-04-17 Listed $1,650,000 TheMLS
- 2025-11-17 Listing Removed — CRMLS
- 2025-11-10 Relisted — CRMLS
- 2025-09-24 Contingent — CRMLS
- 2025-05-29 Listed $1,700,000 CRMLS
- 2024-10-08 Listed — TheMLS
- 2018-04-09 Sold (Public Records) $1,442,000 Public Records
- 2012-12-18 Listing Removed — CRMLS
- 2012-11-25 Price Changed $1,095,000 CRMLS
- 2012-11-25 Listed $104,900,000 CRMLS
- 2008-03-21 Listing Removed — CRMLS
- 2007-12-09 Listed $1,049,000 CRMLS
- 2007-11-06 Listing Removed — CRMLS
- 2007-06-20 Listed $1,085,000 CRMLS
- 2004-11-16 Sold (Public Records) $655,000 Public Records
Property tax history
+4.8%/yrLatest (2025): $20,368 · -1.0% YoY. Source: county tax records.
Cash-flow waterfall
monthlySold comps — $/sqft
last 12 mo · ≤1 miLoading sold comps…