 Duplex
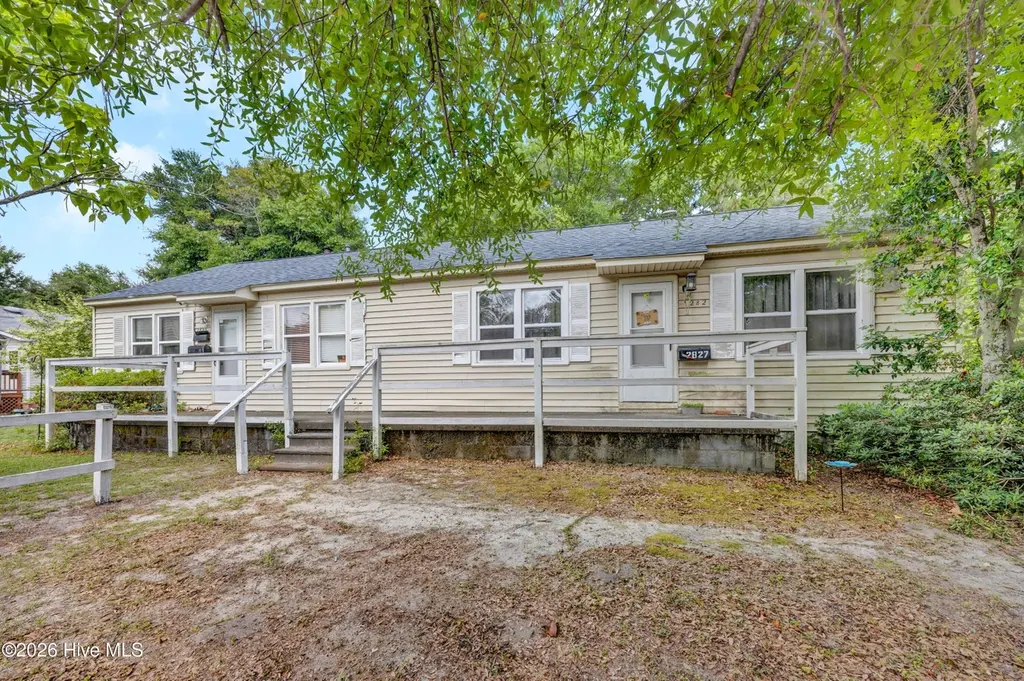
2827 Penn St · Wilmington, NC
Flood risk 1/10 · Minimal
- FEMA flood zone
- X (unshaded)
- Chance of flooding over 30 yrs
- 0.0%
- Est. flood insurance / yr
- $507 – $1,088
Fire risk 2/10 · Minimal
- Est. fire insurance / yr
- $906 – $1,684
Heat risk 9/10 · Severe
- Hot days now (above 104°F)
- 7 days/yr
- Hot days in 30 yrs
- 19 days/yr
Wind risk 8/10 · Major
- Chance of severe wind over 30 yrs
- 99.0%
Air-quality risk 2/10 · Minimal
- Unhealthy air days now
- 1 days/yr
- Unhealthy air days in 30 yrs
- 1 days/yr
Risk factors via First Street. Map © Google.
Why this score? — see what drove the B grade
The composite is a weighted blend of 9 inputs, each scored 0–100. Each bar is that input's sub-score; the figure is the points it added to the 100-point composite (weight × sub-score).
- Cash flow +27.9/30.0
- ARV discount +15.0/15.0
- DSCR +9.9/10.0
- 1% rule +6.3/10.0
- Schools +4.3/10.0
- Livability +3.5/5.0
- Rent growth +2.9/5.0
- Condition / age +2.5/5.0
- Appreciation +0.0/10.0
$259,900
🖨 Deal sheet 📄 Offer letter ✓ Due diligence
Multi-family units
County records classify this as Multi-Family (2-4 Unit). Listing-text estimate: 2 units. confirmed
Listing remarks
Attention investors and house-hackers! Welcome to 2825 & 2827 Penn Street, a highly desirable side-by-side duplex located in the heart of Wilmington, NC. This rare, low-maintenance income property features two distinct units, making it the perfect addition to any real estate portfolio or an ideal opportunity to live in one side and rent out the other. Each unit boasts a functional layout with classic hardwood flooring, separate utility meters, and a spacious shared yard. Situated in a quiet, established neighborhood with no HOA restrictions, this property offers incredible ease of management and maximum rental flexibility. Enjoy a stellar location just minutes from Downtown Wilmington
Key facts
- 0.24 acre lot
- Built 1942
- Listed 5 days
Property features AI
Finance
- Financial info: Property listed as residential income (duplex)
Exterior
- Parking: Gravel/unpaved parking; Shed for additional parking/storage
- Utilities: Public water; Public sewer; Natural gas available and connected; Electricity available and connected; Phone available; Sewer connected; Water connected
- Home design: Duplex (Residential income); One-story
- Construction: Vinyl siding and frame construction; Shingle roof
- Exterior features: Screened porch; Front porch; Rear porch; Corner lot; City street and state road frontage
Interior
- Kitchen: Electric water heater
- Flooring: Vinyl flooring; Hardwood flooring
- Heating & cooling: Wall furnace (natural gas); Wall/window air conditioning units
- Interior features: Unfurnished; Crawl space basement; Has view
- Laundry & utility: Dryer included; No dedicated laundry room listed
Neighborhood map
What this means for you Summary
Snapshot
- This is a 2 × 2-bed/1.0-bath units multifamily listed at $260k.
Deal economics
- At list price, monthly cash flow is $804 ($10k/yr) — positive. Per door: $402/mo.
- The deal already cash-flows at list — no discount required.
- Meets the 1% rule at list price ($3k rent vs $260k).
- Cap rate 10.0% vs local median 2.6% in Wilmington — top-decile yield for the area; either an underpriced asset or a hidden risk that comps aren't pricing in. Stress-test before assuming the spread holds.
Location & tenants
- Location reads 70/100 on livability (#142 in NC) — a middle-class / working-renter tenant base. Strengths: health & safety A+, cost of living B+, housing B+; Watch: amenities C-, employment C-, crime F.
- New Hanover County Schools (urban): math 48% / reading 53% proficiency, ranked #61 of 178 in NC (top 34%) — acceptable for families but not a draw, mixed tenant base, ~2y average lease.
- Zoned schools: Sunset Park Elementary (math 22% / reading 27%, grade F, #1,112 of 1,410 statewide, top 82%, 409 students, 99% FRL); Williston Middle (math 17% / reading 30%, grade F, #402 of 475 statewide, top 85%, 683 students, 100% FRL); New Hanover High (math 60% / reading 53%, grade C, #261 of 535 statewide, top 49%, 1,466 students, 100% FRL) — zoned schools average 100% FRL vs 42% district-wide (58 pts higher); higher-poverty schools than district average — tighter screening recommended.
- Zoned-school proficiency averages 35% at this address vs 50% district-wide (-16 pts) — the specific schools serving this property underperform the New Hanover County Schools average; the district grade overstates school quality for this exact location.
- Market conditions: Rents rising (+1.6%/yr); 417 active listings in the ZIP; 19 comparable units currently listed for rent nearby; rentals at typical pace (median 14d on market — plan ~3-4 weeks tenant-placement turnaround); 2,581 units permitted in New Hanover County in 2024 (1,185 in 5+ unit buildings).
- At $2,936/mo this rent would consume 49% of the median local household income ($72k/yr) (locally 2337% of renters already pay >50% of income on rent) — very limited rent-growth headroom before tenants either downsize or default.
Forward outlook
- Local home prices are declining (-3.0%/yr); year-one equity from $2k of loan paydown is wiped out by about $8k of value loss. Plan a longer hold.
- New Hanover County population projected at +37% by 2050 — long-run rental-demand tailwind backs the buy-and-hold thesis.
- At projected returns (-3.0% appreciation + 1.6% rent growth), your $73k cash investment doubles in ~10 years — after that, you're playing with house money.
Negotiation context
- Only 5 days on market — expect competitive offers; lowballing is unlikely to land.
Risks & watch-outs
- Watch-outs: built in 1942 — expect roof / HVAC / electrical / plumbing capex.
- Climate carrying-cost: severe wind risk, 99% chance of damaging wind over 30y; extreme-heat days projected 7→19/yr by 2055 (HVAC capex compounding) — expect insurance premiums to compound above CPI over the hold.
Questions for the listing agent
- Can we see the unit-by-unit rent roll, current vacancy, and any below-market leases? What's the average tenancy length?
- What capital expenditures (roof, boiler, parking lot, exteriors) have been made in the last 5 years, and what's planned in the next 2?
- Built in 1942 — when were the roof, HVAC, electrical panel, plumbing, and water heater last replaced?
- Is there a deadline driving the sale (1031 exchange, divorce, estate, relocation)? That informs how much negotiation room exists.
- Crime grade is F in this area — have there been break-ins, vandalism, or insurance claims at this property in the last 3 years? What carrier currently insures it and at what premium?
- What's the average days-on-market for RENTAL listings here right now (not sales)? A rising rental-DOM trend means longer vacancies and softer asking-rent achievability than the comps imply.
- What's the recent tenant-quality profile in this submarket — average credit score on applications, eviction rate, late-payment / NSF rate, and stable-employment percentage? A property-management company in the area should have these aggregated.
- How much new apartment / multifamily construction is in the pipeline within 1–3 miles? Heavy new supply (>2% of stock underway) typically softens rents 12–24 months out; light construction supports rent growth.
Investment metrics
- 1% rule
- 1.13% ✓
- Cap rate
- 10.01%
- Cash-on-cash
- 13.26%
- DSCR
- 1.59
- GRM
- 7.4
CMA / ARV
- ARV (on-the-fly)
- $328,512
- Comps found
- 3
Show comp detail 3 sales within ~0.75 mi
| Address | Dist | Beds/Ba | Sqft | Sold | Price | $/sf | Match |
|---|---|---|---|---|---|---|---|
| 2803 Chappell Ave | 0.27mi | 4/2.0 | 1,350 (-3%) | 0mo | $335,000 | $248 | 82 |
| 230 Williamson Dr | 0.37mi | 4/2.0 | 1,400 (+1%) | 17mo | $330,000 | $236 | 68 |
| 2703 Dare St | 0.42mi | 4/2.0 | 1,430 (+3%) | 20mo | $275,000 | $192 | 59 |
Match score weights: distance 35% · size 25% · config 20% · recency 20%. Top-matched comps best support the ARV.
Projected returns pro-forma
-3.0% appreciation · 1.64% rent growth · sell at horizon
- IRR
- 1.8%
- Equity multiple
- 1.07×
- Total profit
- $4,999
- Equity at exit
- $38,752
- IRR
- 10.1%
- Equity multiple
- 1.74×
- Total profit
- $53,942
- Equity at exit
- $22,471
Cash invested: $72,772 (down + closing). Projections, not guarantees.
Landlord ↔ Tenant lean methodology
- Overall (STATE)
- 85 Strongly Landlord-Friendly
- State North Carolina
- 85 Strongly Landlord-Friendly · R+3
- County
- — inherits STATE
- City
- — inherits STATE
ZIP-level market 28412
- Rents YoY
- 1.6%
- Active inventory
- 417
- Price-to-rent
- 14.8×
Monthly cashflow live
- Estimated rent
- $2,936 high interval (Pro) →
- Mortgage (P&I)
- −$1,363
- Tax from tax record
- −$44 /mo · $531/yr
- Insurance
- −$108
- HOA
- −$0
- Vacancy / Maint / Mgmt
- −$617
- Net cashflow
- $804
Break-even live
2-unit breakdown (identical units grouped — click to expand)
| Units | Beds | Baths | Est. rent |
|---|---|---|---|
| 2× units | 2 | 1 | $2,936 |
| #1 | 2 | 1 | $1,468 |
| #2 | 2 | 1 | $1,468 |
| Total (2 units) | $2,936 | ||
UW: 25.0% down · 7.5% · 30yr · 1.5% tax · 5.0% vac · 8.0% maint · 8.0% mgmt
Financing live
Cash to close
- Down payment
- $64,975
- Closing costs
- $7,797
- Reserves months
- —
- Total cash needed
- —
Loan-product check · same deal, 3 products live
Conventional
25% down · 7.5% · 30yr
- Down + closing
- —
- Monthly P&I
- —
- Monthly cashflow
- —
- DSCR
- —
- Eligible?
- —
Personal DTI + credit; lowest rate.
DSCR
20% down · 8.5% · 30yr
- Down + closing
- —
- Monthly P&I
- —
- Monthly cashflow
- —
- DSCR
- —
- Eligible?
- —
No personal income docs; deal must DSCR.
Hard money
10% down · 12.0% · 12mo
- Down + closing
- —
- Monthly P&I
- —
- Monthly cashflow
- —
- DSCR
- —
- Eligible?
- —
Short-term bridge; refi at stabilization.
Rent comps 19 comps
| Address | Beds | Baths | Sqft | Rent | $/sqft | DOM | Units | Dist |
|---|---|---|---|---|---|---|---|---|
| 719 Galley Ln Wilmington, NC | 1.0–3.0 | 1.0–2.0 | 1158 | $1,532 | $1.32 | 14d | 10 | 0.47mi |
| 509 Conley Dr Wilmington, NC | 1.0–3.0 | 1.0–2.0 | 938 | $1,442 | $1.54 | 14d | 79 | 0.69mi |
| 1192 Harbour Dr Wilmington, NC | 2.0–3.0 | 1.5–2.0 | 1142 | $1,791 | $1.57 | 14d | 30 | 0.78mi |
| 315 Bordeaux Ave Wilmington, NC | 4.0 | 2.0 | 1650 | $1,975 | $1.20 | 21d | 1 | 0.86mi |
| 2439 Carolina Cove Way Wilmington, NC | 2.0–3.0 | 2.0–2.5 | 1397 | $3,024 | $2.16 | 14d | 53 | 0.94mi |
| 1436 Harbour Dr Wilmington, NC | 1.0–3.0 | 1.0–2.0 | 812 | $1,500 | $1.85 | 14d | 8 | 1.04mi |
| 3960 Independence Blvd Wilmington, NC | 1.0–3.0 | 1.0–2.0 | 1127 | $2,536 | $2.25 | 14d | 25 | 1.09mi |
| 2402 Flint Dr Wilmington, NC | 2.0–3.0 | 1.0–2.0 | 1037 | $1,450 | $1.40 | 21d | 6 | 1.09mi |
| 1522 Cadfel Ct Wilmington, NC | 1.0–3.0 | 1.0–2.0 | 1036 | $1,894 | $1.83 | 14d | 13 | 1.14mi |
| 2320 Canterwood Dr Wilmington, NC | 1.0–3.0 | 1.0–2.0 | 975 | $1,685 | $1.73 | 14d | 9 | 1.16mi |
| 3510 Corder Dr Wilmington, NC | 2.0–3.0 | 2.0–3.5 | 1516 | $2,624 | $1.73 | 14d | 12 | 1.31mi |
| 3956 Echo Farms Blvd Wilmington, NC | 3.0 | 3.0 | 1468 | $1,625 | $1.11 | 14d | 1 | 1.33mi |
| 1518 Village Dr Wilmington, NC | 1.0–3.0 | 1.0–2.0 | 1000 | $1,619 | $1.62 | 21d | 7 | 1.36mi |
| 1605 Barclay Pointe Blvd Wilmington, NC | 1.0–3.0 | 1.0–2.5 | 1203 | $2,437 | $2.03 | 14d | 30 | 1.38mi |
| 1841 Dusty Miller Ln Wilmington, NC | 1.0–3.0 | 1.0–2.0 | 1164 | $2,496 | $2.14 | 14d | 24 | 1.42mi |
| 980 Coosaw Pl Wilmington, NC | 3.0 | 2.5 | 1619 | $2,225 | $1.37 | 21d | 1 | 1.43mi |
| 842 Coosaw Pl Wilmington, NC | 5.0 | 2.5 | 1857 | $2,495 | $1.34 | 14d | 1 | 1.45mi |
| 844 Coosaw Pl Wilmington, NC | 3.0 | 2.5 | 1619 | $2,225 | $1.37 | 21d | 1 | 1.45mi |
| 912 Coosaw Pl Wilmington, NC | 5.0 | 2.5 | 1857 | $2,495 | $1.34 | 21d | 1 | 1.47mi |
Listing history 6 events
-
2026-06-10status $259,900 Pending 5 DOM
-
2026-06-09days on market $259,900 Active 5 DOM
-
2026-06-08days on market $259,900 Active 4 DOM
-
2026-06-07days on market $259,900 Active 3 DOM
-
2026-06-05remarks 695-char remark
-
2026-06-05$259,900 Active 1 DOM
ⓘ Source: listings_history table (triggers on properties + properties_extension) + one-shot
backfill from property_details.listing_events for pre-trigger history.
Tax reassessment forecast NC · Resets to sale price
- Current annual tax
- $531 · $44/mo
- Projected year-2 tax
- $2,131 · $178/mo
- Expected delta
- +$1,601/yr (+$133/mo · 301.7%)
ⓘ Screening estimate from a state-policy table — verify with the county assessor before closing.
Climate risk First Street
- Flood 1/10 Low FEMA zone X (unshaded) · 0% chance over 30 yrs
- Wildfire 2/10 Low
- Heat 9/10 Extreme 7 d/yr ≥104°F today · 19 d/yr by 30 yrs out
- Wind 8/10 Severe 99% chance of damaging wind over 30 yrs
- Air quality 2/10 Low 1 unhealthy d/yr today · 1 by 30 yrs out
Nearby sold comps map
Loading sold comps map…
Walkable amenities ~0.75 mi
Loading nearby amenities…
Taxation est. · year 1
- Rental income
- $35,232
- − Mortgage interest
- −$14,558
- − Property taxes
- −$531
- − Insurance
- −$1,300
- − Repairs & maintenance
- −$2,819
- − Management
- −$2,819
- − Depreciation
- −$7,561
- Taxable income
- $5,646
- Est. tax owed @ 24.0%
- −$1,355
- After-tax cash flow
- $8,293/yr
For passive investors: Depreciation is non-cash, so a rental often shows a tax loss while cash-flowing — sheltering income. Rental losses are passive: they offset passive income freely, and up to $25,000/yr can offset ordinary (W-2) income if you actively participate and your MAGI is under $100k (phasing out to $0 by $150k); unused losses carry forward. On sale, claimed depreciation is recaptured at up to 25%, and gains may owe capital-gains tax (a 1031 exchange can defer both). Figures are a year-1 estimate at your 24.0% rate — not tax advice; consult a CPA.
Schools (NCES district)
- District
- New Hanover County Schools
- NCES district ID
- 3703330
- Math proficiency
- 48% ▼ -3.00%
- Reading proficiency
- 53% ▬ 0.00%
- Median HH income
- $49,406
- Composite
- 43.13/100
- National rank
- #3081
- State rank
- #61 of 178 in NC
Livability — Wilmington
- Score
- 70/100
- State rank
- #142
- US rank
- #8131
Category grades
Schools grade is shown separately in the Schools card above.
Census & demographics
- Census place
- Wilmington, NC
- County
- New Hanover County · 232,153 people
- City population
- 215,355
- Metro
- Wilmington, NC
- Population (ZIP)
- 44,166
- Household income
- $71,636
- Rent vs Own
- Severe rent burden
- 2337.0
Population outlook (New Hanover County) Hauer SSP2
- Today (2025)
- 259,517 people
- By 2030
- 279,586 · +7.7%
- By 2040
- 318,223 · +22.6%
- By 2050
- 354,831 · +36.7%
- By 2075
- 437,158 · +68.5%
- By 2100
- 486,769 · +87.6%
Race, ethnicity, and origin ACS 2023
- Neighborhood character
- Predominantly White (77%)
- Race & ethnicity
- White 77% Hispanic / Latino 10% Two or more races 8% Black 7%
- Hispanic origin (detail)
- Mexican 3%
- Common ancestry
- Lithuanian 3% Romanian 3% Slovak 2%
- Foreign-born
- 6% · Canada, South Korea
- Languages at home
- 89% English-only · Spanish 8% Arabic 1% Other Indo-European 1%
Political lean MEDSL · New Hanover
- 2024 margin
- Toss-up / Even · D 49.8% · R 49.1% · Other 1.1%
- 2008→2024 swing
- +2.0pp toward D · 2008: -1.4pp · 2024: 0.6pp
- All cycles
- 2024: D+0.6 2020: D+2.1 2016: R+4.1 2012: R+4.7 2008: R+1.4
Not yet ingested
- Civics
- —
Market trends
- HPI YoY
- ▼ -147.83%
- Current HPI
- 226.3292
- Rent YoY
- ▲ 1.64%
- Metro
- Wilmington, NC
- State GDP YoY
- ▲ 3.28%
- F500 in state
- 26
Industry mix (Fortune 500 HQ in NC)
| Industry | F500 HQs | Revenue |
|---|---|---|
| Financial Services | 2 | $213B |
|
||
| Retail | 2 | $95B |
|
||
| Industrial Conglomerate | 1 | $38B |
|
||
| Metals / Steel | 1 | $35B |
|
||
| Utilities | 1 | $30B |
|
||
| Industrial Machinery | 1 | $19B |
|
||
Price history
1 event — show timeline
- 2026-06-04 Listed $259,900 Hive MLS
Property tax history
+0.4%/yrLatest (2025): $531 · -31.9% YoY. Source: county tax records.
Cash-flow waterfall
monthlySold comps — $/sqft
last 12 mo · ≤1 miLoading sold comps…