 Duplex
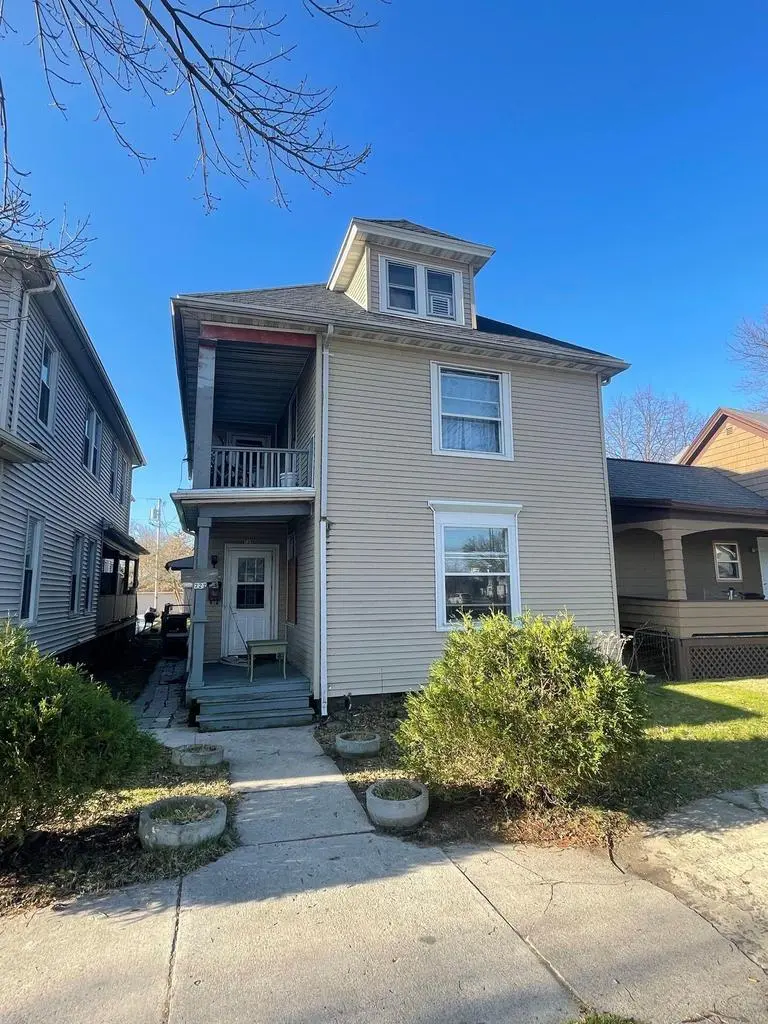
729 Kentucky Ave #729 · Sheboygan, WI
Flood risk 8/10 · Major
- FEMA flood zone
- X (unshaded)
- Chance of flooding over 30 yrs
- 0.99%
- Est. flood insurance / yr
- $507 – $1,088
Fire risk 1/10 · Minimal
- Est. fire insurance / yr
- $636 – $1,182
Heat risk 1/10 · Minimal
- Hot days now (above 95°F)
- 7 days/yr
- Hot days in 30 yrs
- 13 days/yr
Wind risk 2/10 · Minimal
- Chance of severe wind over 30 yrs
- —
Air-quality risk 3/10 · Minor
- Unhealthy air days now
- 3 days/yr
- Unhealthy air days in 30 yrs
- 4 days/yr
Risk factors via First Street. Map © Google.
Why this score? — see what drove the B+ grade
The composite is a weighted blend of 9 inputs, each scored 0–100. Each bar is that input's sub-score; the figure is the points it added to the 100-point composite (weight × sub-score).
- Cash flow +28.0/30.0
- ARV discount +15.0/15.0
- DSCR +9.9/10.0
- 1% rule +7.7/10.0
- Rent growth +5.0/5.0
- Livability +3.9/5.0
- Condition / age +3.8/5.0
- Schools +2.6/10.0
- Appreciation +0.0/10.0
$169,900
🖨 Deal sheet 📄 Offer letter ✓ Due diligence
Multi-family units
County records classify this as Multi-Family (2-4 Unit). Listing-text estimate: 2 units. confirmed
Listing remarks
excellent investment opportunity or owner occupied Duplex! This 2 family homes features 3 beds/1 bath in each upper and lower apartment. Upper unit is already leased! Separate entrances and functional layouts! Approx. 2400 sq ft on a convenient lot with off street parking. Located in a well established neighborhood with easy access to schools, parks, shopping and more! Strong rental potential! Schedule your showing today!
Key facts
- Off street parking
- Separate entrances
- Duplex
Tags
Property features AI
Finance
- Other: Includes 2 stoves and 2 refrigerators; seller/tenant personal property excluded
Exterior
- Parking: Detached 1-car garage; Approximately 1.5 garage parking spaces total
- Utilities: Municipal water; Municipal sewer; 2 electric meters; 2 gas meters
- Home design: 2-story duplex (multi-family); Information source lists year built from assessor/public record
- Construction: Wood construction
- Exterior features: Wood and other exterior materials; Lot size less than 1/2 acre (approximately 0.1 acre); Zoned residential
Interior
- Kitchen: Unit 2 kitchen on upper level; Two stoves and two refrigerators included
- Bedrooms: Unit 1: 3 bedrooms; Unit 2: 3 bedrooms (master and other bedrooms on upper level)
- Bathrooms: Unit 1: 1 full bathroom; Unit 2: 1 full bathroom
- Interior features: Full basement with dual entry
Neighborhood map
What this means for you Summary
Snapshot
- This is a 2 × 3-bed/1.0-bath units multifamily listed at $170k. Condition is rated good.
Deal economics
- At list price, monthly cash flow is $461 ($6k/yr) — positive. Per door: $231/mo.
- The deal already cash-flows at list — no discount required.
- Meets the 1% rule at list price ($2k rent vs $170k).
- Recommended offer: $167k (1.5% below list) — sets the bar for market timing.
- Cap rate 10.0% vs local median 3.1% in Sheboygan — top-decile yield for the area; either an underpriced asset or a hidden risk that comps aren't pricing in. Stress-test before assuming the spread holds.
Location & tenants
- Location reads 77/100 on livability (#117 in WI, #3,019 nationally) — a middle-class / working-renter tenant base. Strengths: cost of living A+, housing A+, health & safety A+; Watch: crime C-, employment C-, schools D+.
- Sheboygan Area School District (urban): math 28% / reading 31% proficiency, ranked #282 of 342 in WI (top 82%) — low school quality limits family demand, transient renter base, plan for 1-2y turnover.
- Market conditions: Rents rising fast (+11.1%/yr); 97 active listings in the ZIP; 383 units permitted in Sheboygan County in 2024 (105 in 5+ unit buildings).
- This rent runs 40% of the median local income ($64k/yr) — at the standard rent-burdened threshold; future hikes will face affordability resistance.
Forward outlook
- Local home prices are declining (-3.0%/yr); year-one equity from $1k of loan paydown is wiped out by about $5k of value loss. Plan a longer hold.
- Sheboygan County population projected to shrink 8% by 2050 — rents likely to lag national; underwrite the cash flow, not the appreciation.
- At projected returns (-3.0% appreciation + 8.0% rent growth), your $48k cash investment doubles in ~7 years — after that, you're playing with house money.
Negotiation context
- It's been on market 24 days — a 2% lower offer ($167k) is reasonable based on typical stale-listing flexibility.
Risks & watch-outs
- Watch-outs: flood insurance adds $66/mo; built in 1890 — expect roof / HVAC / electrical / plumbing capex.
- Climate carrying-cost: severe flood risk — expect insurance premiums to compound above CPI over the hold.
Questions for the listing agent
- Can we see the unit-by-unit rent roll, current vacancy, and any below-market leases? What's the average tenancy length?
- What capital expenditures (roof, boiler, parking lot, exteriors) have been made in the last 5 years, and what's planned in the next 2?
- Built in 1890 — when were the roof, HVAC, electrical panel, plumbing, and water heater last replaced?
- What's the actual annual flood-insurance premium (NFIP or private), and is the property in a SFHA with mandatory coverage?
- Is there a deadline driving the sale (1031 exchange, divorce, estate, relocation)? That informs how much negotiation room exists.
- Schools are D-rated, which usually means shorter tenancies and higher turnover. Who's the typical renter profile here, and what's been the actual vacancy rate?
- What's the average days-on-market for RENTAL listings here right now (not sales)? A rising rental-DOM trend means longer vacancies and softer asking-rent achievability than the comps imply.
- What's the recent tenant-quality profile in this submarket — average credit score on applications, eviction rate, late-payment / NSF rate, and stable-employment percentage? A property-management company in the area should have these aggregated.
- How much new apartment / multifamily construction is in the pipeline within 1–3 miles? Heavy new supply (>2% of stock underway) typically softens rents 12–24 months out; light construction supports rent growth.
Investment metrics
- 1% rule
- 1.27% ✓
- Cap rate
- 10.02%
- Cash-on-cash
- 13.31%
- DSCR
- 1.59
- GRM
- 6.6
CMA / ARV
- ARV (on-the-fly)
- $206,400
- Comps found
- 10
Show comp detail 10 sales within ~0.75 mi
| Address | Dist | Beds/Ba | Sqft | Sold | Price | $/sf | Match |
|---|---|---|---|---|---|---|---|
| 730 Georgia Ave Unit 730A | 0.12mi | 6/2.5 | 2,557 (+6%) | 2mo | $225,000 | $88 | 80 |
| 1332 S 9th St | 0.17mi | 6/2.0 | 2,620 (+9%) | 6mo | $209,000 | $80 | 71 |
| 730 Georgia Ave | 0.12mi | 6/2.0 | 2,557 (+6%) | 17mo | $188,900 | $74 | 70 |
| 1122 S 15th St #1124 | 0.61mi | 6/2.0 | 2,395 (-0%) | 2mo | $205,000 | $86 | 69 |
| 1301 Jefferson Ave | 0.64mi | 5/2.0 (-1) | 2,451 (+2%) | 2mo | $199,000 | $81 | 60 |
| 1413 Jefferson Ave #1415 | 0.72mi | 5/2.0 (-1) | 2,397 (-0%) | 9mo | $172,000 | $72 | 53 |
| 903 High Ave | 0.52mi | 5/2.0 (-1) | 2,144 (-11%) | 11mo | $255,000 | $119 | 44 |
| 1209 S 12th St | 0.34mi | 5/2.0 (-1) | 2,082 (-13%) | 21mo | $225,000 | $108 | 39 |
| 718 S 14th St | 0.64mi | 6/2.0 | 2,719 (+13%) | 14mo | $181,000 | $67 | 36 |
| 919 S 16th St #921 | 0.70mi | 5/2.0 (-1) | 2,072 (-14%) | 19mo | $178,000 | $86 | 24 |
Match score weights: distance 35% · size 25% · config 20% · recency 20%. Top-matched comps best support the ARV.
Projected returns pro-forma
-3.0% appreciation · 8.0% rent growth · sell at horizon
- IRR
- 6.8%
- Equity multiple
- 1.28×
- Total profit
- $13,291
- Equity at exit
- $25,333
- IRR
- 20.3%
- Equity multiple
- 3.13×
- Total profit
- $101,494
- Equity at exit
- $14,690
Cash invested: $47,572 (down + closing). Projections, not guarantees.
Landlord ↔ Tenant lean methodology
- Overall (STATE)
- 73 Landlord-Friendly
- State Wisconsin
- 73 Landlord-Friendly · R+2
- County
- — inherits STATE
- City
- — inherits STATE
ZIP-level market 53081
- Home prices YoY
- -34.0%
- Rents YoY
- 11.1%
- Active inventory
- 97
- Price-to-rent
- 13.1×
Monthly cashflow live
- Estimated rent
- $2,154 medium interval (Pro) →
- Mortgage (P&I)
- −$891
- Tax est. 1.5%
- −$212 /mo · $2,548/yr
- Insurance
- −$71
- Flood insurance flood zone
- −$66 /mo · $798/yr
- HOA
- −$0
- Vacancy / Maint / Mgmt
- −$452
- Net cashflow
- $461
Break-even live
2-unit breakdown (identical units grouped — click to expand)
| Units | Beds | Baths | Est. rent |
|---|---|---|---|
| 2× units | 3 | 1 | $2,154 |
| #1 | 3 | 1 | $1,077 |
| #2 | 3 | 1 | $1,077 |
| Total (2 units) | $2,154 | ||
UW: 25.0% down · 7.5% · 30yr · 1.5% tax · 5.0% vac · 8.0% maint · 8.0% mgmt
Financing live
Cash to close
- Down payment
- $42,475
- Closing costs
- $5,097
- Reserves months
- —
- Total cash needed
- —
Loan-product check · same deal, 3 products live
Conventional
25% down · 7.5% · 30yr
- Down + closing
- —
- Monthly P&I
- —
- Monthly cashflow
- —
- DSCR
- —
- Eligible?
- —
Personal DTI + credit; lowest rate.
DSCR
20% down · 8.5% · 30yr
- Down + closing
- —
- Monthly P&I
- —
- Monthly cashflow
- —
- DSCR
- —
- Eligible?
- —
No personal income docs; deal must DSCR.
Hard money
10% down · 12.0% · 12mo
- Down + closing
- —
- Monthly P&I
- —
- Monthly cashflow
- —
- DSCR
- —
- Eligible?
- —
Short-term bridge; refi at stabilization.
Listing history 16 events
-
2026-06-19days on market $169,900 Active 24 DOM
-
2026-06-18days on market $169,900 Active 23 DOM
-
2026-06-17days on market $169,900 Active 22 DOM
-
2026-06-16days on market $169,900 Active 21 DOM
-
2026-06-15days on market $169,900 Active 20 DOM
-
2026-06-14days on market $169,900 Active 18 DOM
-
2026-06-13days on market $169,900 Active 17 DOM
-
2026-06-10days on market $169,900 Active 15 DOM
-
2026-06-09days on market $169,900 Active 14 DOM
-
2026-06-08days on market $169,900 Active 13 DOM
-
2026-06-07days on market $169,900 Active 12 DOM
-
2026-06-02days on market $169,900 Active 7 DOM
-
2026-06-01days on market $169,900 Active 6 DOM
-
2026-05-31days on market $169,900 Active 5 DOM
-
2026-05-30days on market $169,900 Active 4 DOM
-
2026-05-26$169,900 Active
ⓘ Source: listings_history table (triggers on properties + properties_extension) + one-shot
backfill from property_details.listing_events for pre-trigger history.
Climate risk First Street
- Flood 8/10 Severe FEMA zone X (unshaded) · 99% chance over 30 yrs
- Wildfire 1/10 Low
- Heat 1/10 Low 7 d/yr ≥95°F today · 13 d/yr by 30 yrs out
- Wind 2/10 Low
- Air quality 3/10 Moderate 3 unhealthy d/yr today · 4 by 30 yrs out
Nearby sold comps map
Loading sold comps map…
Walkable amenities ~0.75 mi
Loading nearby amenities…
Taxation est. · year 1
- Rental income
- $25,848
- − Mortgage interest
- −$9,517
- − Property taxes
- −$2,548
- − Insurance
- −$1,647
- − Repairs & maintenance
- −$2,068
- − Management
- −$2,068
- − Depreciation
- −$4,943
- Taxable income
- $3,057
- Est. tax owed @ 24.0%
- −$734
- After-tax cash flow
- $4,799/yr
For passive investors: Depreciation is non-cash, so a rental often shows a tax loss while cash-flowing — sheltering income. Rental losses are passive: they offset passive income freely, and up to $25,000/yr can offset ordinary (W-2) income if you actively participate and your MAGI is under $100k (phasing out to $0 by $150k); unused losses carry forward. On sale, claimed depreciation is recaptured at up to 25%, and gains may owe capital-gains tax (a 1031 exchange can defer both). Figures are a year-1 estimate at your 24.0% rate — not tax advice; consult a CPA.
Condition & rehab AI · 8 photos
This 2-family home presents as move-in ready with good condition and minimal repairs needed. It offers a strong investment opportunity with potential for rental or resale value enhancement through minor updates.
Value-add opportunities
- Both Painting — Fresh paint can enhance curb appeal and interior aesthetics
- Both Landscaping — Well-maintained landscaping can improve curb appeal and attract potential buyers
- Both Appliance upgrades — Modern appliances can increase the home's appeal and value
- Both Flooring upgrades — Upgrading flooring can improve the home's overall appearance and value
Renovation cost estimate screening
Value-add ROI direction
- Both Painting — Fresh paint can enhance curb appeal and interior aesthetics ↑
- Both Landscaping — Well-maintained landscaping can improve curb appeal and attract potential buyers ↑
- Both Appliance upgrades — Modern appliances can increase the home's appeal and value ↑
- Both Flooring upgrades — Upgrading flooring can improve the home's overall appearance and value ↑
ⓘ Cost ranges are severity-bucket heuristics (US national rule-of-thumb). Get contractor quotes + a written scope before underwriting a rehab budget.
Schools (NCES district)
- District
- Sheboygan Area School District
- NCES district ID
- 5513650
- Math proficiency
- 28% ▼ -8.00%
- Reading proficiency
- 31% ▼ -5.00%
- Median HH income
- $47,301
- Composite
- 25.53/100
- National rank
- #7435
- State rank
- #282 of 342 in WI
Livability — Sheboygan
- Score
- 77/100
- State rank
- #117
- US rank
- #3019
Category grades
Schools grade is shown separately in the Schools card above.
Census & demographics
- Census place
- Sheboygan, WI
- County
- Sheboygan County · 59,517 people
- City population
- 43,381
- Metro
- Sheboygan, WI
- Population (ZIP)
- 43,381
- Household income
- $64,042
- Rent vs Own
- Severe rent burden
- 1312.0
Population outlook (Sheboygan County) Hauer SSP2
- Today (2025)
- 115,612 people
- By 2030
- 114,575 · -0.9%
- By 2040
- 110,767 · -4.2%
- By 2050
- 106,170 · -8.2%
- By 2075
- 100,361 · -13.2%
- By 2100
- 92,749 · -19.8%
Race, ethnicity, and origin ACS 2023
- Neighborhood character
- Predominantly White (71%)
- Race & ethnicity
- White 71% Asian 11% Hispanic / Latino 11% Two or more races 8% Black 4%
- Hispanic origin (detail)
- Mexican 8% Puerto Rican 2%
- Common ancestry
- Portuguese 4% Iranian 4% Romanian 3%
- Foreign-born
- 9% · Canada, China
- Languages at home
- 83% English-only · Other Asian/Pacific 8% Spanish 7% Other Indo-European 1%
Political lean MEDSL · Sheboygan
- 2024 margin
- R (+16.4) · D 41.1% · R 57.5% · Other 1.4%
- 2008→2024 swing
- -15.7pp toward R · 2008: -0.7pp · 2024: -16.4pp
- All cycles
- 2024: R+16.4 2020: R+15.9 2016: R+16.7 2012: R+9.4 2008: R+0.7
Not yet ingested
- Civics
- —
Market trends
- HPI YoY
- ▼ -116.80%
- Current HPI
- 226.7468
- Rent YoY
- ▲ 11.07%
- Metro
- Sheboygan, WI
- State GDP YoY
- ▲ 2.10%
- F500 in state
- 20
Industry mix (Fortune 500 HQ in WI)
| Industry | F500 HQs | Revenue |
|---|---|---|
| Industrial Machinery | 4 | $23B |
|
||
| Industrial Technology | 2 | $36B |
|
||
| Insurance | 1 | $36B |
|
||
| Professional Services | 1 | $19B |
|
||
| Utilities | 1 | $9B |
|
||
| Consumer Goods | 1 | $3B |
|
||
Price history
1 event — show timeline
- 2026-05-26 Listed $169,900 METROMLS
Cash-flow waterfall
monthlySold comps — $/sqft
last 12 mo · ≤1 miLoading sold comps…