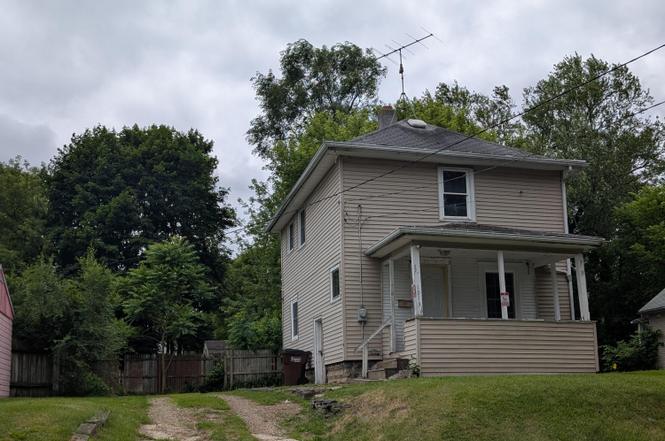
1913 Plymouth St · Jackson, MI
Flood risk 1/10 · Minimal
- FEMA flood zone
- X (unshaded)
- Chance of flooding over 30 yrs
- 0.0%
- Est. flood insurance / yr
- $473 – $860
Fire risk 1/10 · Minimal
- Est. fire insurance / yr
- $784 – $1,456
Heat risk 2/10 · Minimal
- Hot days now (above 97°F)
- 7 days/yr
- Hot days in 30 yrs
- 14 days/yr
Wind risk 2/10 · Minimal
- Chance of severe wind over 30 yrs
- —
Air-quality risk 2/10 · Minimal
- Unhealthy air days now
- 1 days/yr
- Unhealthy air days in 30 yrs
- 1 days/yr
Risk factors via First Street. Map © Google.
Why this score? — see what drove the D grade
The composite is a weighted blend of 9 inputs, each scored 0–100. Each bar is that input's sub-score; the figure is the points it added to the 100-point composite (weight × sub-score).
- Cash flow +15.0/30.0
- ARV discount +7.5/15.0
- 1% rule +5.0/10.0
- DSCR +5.0/10.0
- Rent growth +4.4/5.0
- Livability +3.7/5.0
- Condition / age +2.5/5.0
- Schools +1.8/10.0
- Appreciation +0.0/10.0
$19,900
🖨 Deal sheet (PDF) 📄 Offer letter ✓ Due diligence
Listing remarks MLS
Opportunity awaits with this 2 Bedroom Home. Offering Plenty of Potential, this Home is Ready for Repairs, Up-Dates, & your Personal Touch. Bring your Vision & TLC to Restore it to its Full Potential. Whether you are an Investor, Someone that Flips or a Buyer looking to build Equity, this Affordable Home presents a Great chance to Add Value & Make it your Own. Endless Possibilities Await! Seller is a licensed Real Estate agent in the State of Michigan
Key facts
- 3,049 sq ft lot
- Built 1900
- Listed 3 days
Property features AI
Exterior
- Utilities: Public water
- Home design: Traditional single-family residence; Built in 1900
- Construction: Vinyl siding; Shingle roof; Approximately 960 square feet of living area
- Exterior features: Sidewalk; Paved road access
Interior
- Kitchen: Dishwasher; Oven; Refrigerator; Freezer
- Bathrooms: One full bathroom
- Heating & cooling: Forced air heating
- Interior features: Window treatments; Six total rooms; Full basement
Neighborhood map
What this means for you Summary
Snapshot
- This is a 2-bed/1.0-bath single-family listed at $20k.
Deal economics
- At list price, monthly cash flow is $773 ($9k/yr) — positive.
- The deal already cash-flows at list — no discount required.
- Meets the 1% rule at list price ($1k rent vs $20k).
- Cap rate 52.9% vs local median 5.6% in Jackson — top-decile yield for the area; either an underpriced asset or a hidden risk that comps aren't pricing in. Stress-test before assuming the spread holds.
Location & tenants
- Location reads 74/100 on livability (#197 in MI, #4,970 nationally) — a middle-class / working-renter tenant base. Strengths: cost of living A+, housing A+, health & safety A+; Watch: schools D, crime F, employment F.
- Jackson Public Schools (urban): math 15% / reading 28% proficiency, ranked #458 of 540 in MI (top 85%) — low school quality limits family demand, transient renter base, plan for 1-2y turnover; 63% free/reduced lunch — lower-income household profile, screen leases tightly.
- Market conditions: Rents rising fast (+7.5%/yr); 172 active listings in the ZIP; 5 comparable units currently listed for rent nearby; rentals lingering (median 46d on market — plan ~5-8 weeks vacancy on turnover, expect pricing pressure); 100% of comp listings sitting > 30 days — soft ceiling on asking rent; 317 units permitted in Jackson County in 2024 (103 in 5+ unit buildings).
Forward outlook
- Local home prices are declining (-3.0%/yr); year-one equity from $138 of loan paydown is wiped out by about $597 of value loss. Plan a longer hold.
- Jackson County population projected at -13% by 2050 — secular population decline; favor cash flow + early exit over multi-decade hold.
- At projected returns (-3.0% appreciation + 7.5% rent growth), your $6k cash investment doubles in ~1 year — after that, you're playing with house money.
Negotiation context
- Only 3 days on market — expect competitive offers; lowballing is unlikely to land.
- 7 sale attempts since 19y ago with the ask held roughly flat each time — persistent listings suggest the price (not the market) is what's stuck; bring a comps-based counter.
- Current owner paid $10k; list at $20k implies a 109% gain — meaningful room to come down on a strong offer.
Risks & watch-outs
- Watch-outs: built in 1900 — expect roof / HVAC / electrical / plumbing capex.
Questions for the listing agent
- Built in 1900 — when were the roof, HVAC, electrical panel, plumbing, and water heater last replaced?
- Is there a deadline driving the sale (1031 exchange, divorce, estate, relocation)? That informs how much negotiation room exists.
- Schools are D-rated, which usually means shorter tenancies and higher turnover. Who's the typical renter profile here, and what's been the actual vacancy rate?
- Crime grade is F in this area — have there been break-ins, vandalism, or insurance claims at this property in the last 3 years? What carrier currently insures it and at what premium?
- The area grade is low — what's the realistic commute time and amenity access for the typical tenant pool here? Any planned neighborhood developments (good or bad) we should know about?
- What's the average days-on-market for RENTAL listings here right now (not sales)? A rising rental-DOM trend means longer vacancies and softer asking-rent achievability than the comps imply.
- What's the recent tenant-quality profile in this submarket — average credit score on applications, eviction rate, late-payment / NSF rate, and stable-employment percentage? A property-management company in the area should have these aggregated.
- How much new for-sale + rental construction is in the pipeline within 1–3 miles? Heavy new supply typically softens prices + rents 12–24 months out; constrained supply supports both.
Investment metrics
- 1% rule
- 5.79% ✓
- Cap rate
- 52.92%
- Cash-on-cash
- 166.53%
- DSCR
- 8.41
- GRM
- 1.4
CMA / ARV
- ARV (on-the-fly)
- $98,880
- Comps found
- 12
Show comp detail 12 sales within ~0.75 mi
| Address | Dist | Beds/Ba | Sqft | Sold | Price | $/sf | Match |
|---|---|---|---|---|---|---|---|
| 125 N Elm Ave | 0.41mi | 2/1.5 | 960 (0%) | 2mo | $189,000 | $197 | 77 |
| 1500 Deyo St | 0.32mi | 2/1.0 | 1,026 (+7%) | 6mo | $35,007 | $34 | 69 |
| 2016 Pringle Ave | 0.10mi | 2/1.0 | 836 (-13%) | 7mo | $71,000 | $85 | 68 |
| 626 Chester | 0.22mi | 2/1.0 | 825 (-14%) | 9mo | $62,500 | $76 | 58 |
| 133 N Forbes St | 0.52mi | 2/1.0 | 882 (-8%) | 8mo | $92,500 | $105 | 56 |
| 408 N Pleasant St | 0.68mi | 2/1.0 | 1,033 (+8%) | 6mo | $128,100 | $124 | 50 |
| 1712 E Ganson St | 0.54mi | 3/1.0 (+1) | 1,049 (+9%) | 6mo | $42,500 | $41 | 49 |
| 1319 Rhodes St | 0.69mi | 3/1.0 (+1) | 996 (+4%) | 10mo | $117,000 | $117 | 48 |
| 1313 Rhodes St | 0.70mi | 2/1.0 | 886 (-8%) | 12mo | $94,900 | $107 | 45 |
| 307 N Gorham St | 0.67mi | 3/1.5 (+1) | 1,066 (+11%) | 7mo | $21,700 | $20 | 38 |
| 1315 Mitchell St | 0.73mi | 2/1.0 | 816 (-15%) | 5mo | $55,000 | $67 | 37 |
| 606 Edgewood St | 0.72mi | 2/1.5 | 1,096 (+14%) | 12mo | $112,500 | $103 | 31 |
Match score weights: distance 35% · size 25% · config 20% · recency 20%. Top-matched comps best support the ARV.
Projected returns pro-forma
-3.0% appreciation · 7.54% rent growth · sell at horizon
- IRR
- —
- Equity multiple
- 10.25×
- Total profit
- $51,549
- Equity at exit
- $2,967
- IRR
- —
- Equity multiple
- 24.90×
- Total profit
- $133,197
- Equity at exit
- $1,721
Cash invested: $5,572 (down + closing). Projections, not guarantees.
Landlord ↔ Tenant lean methodology
- Overall (STATE)
- 62 Landlord-Friendly
- State Michigan
- 62 Landlord-Friendly · EVEN
- County
- — inherits STATE
- City
- — inherits STATE
ZIP-level market 49203
- Home prices YoY
- -31.7%
- Rents YoY
- 7.5%
- Active inventory
- 172
- Price-to-rent
- 1.4×
Monthly cashflow live
- Estimated rent
- $1,153 high interval (Pro) →
- Mortgage (P&I)
- −$104
- Tax est. 1.5%
- −$25 /mo · $298/yr
- Insurance
- −$8
- HOA
- −$0
- Vacancy / Maint / Mgmt
- −$242
- Net cashflow
- $773
Break-even live
Sensitivity live
| Price | -10% $787 | -5% $780 | +0% $773 | +5% $766 | +10% $759 |
|---|---|---|---|---|---|
| Rent | -10% $682 | -5% $728 | +0% $773 | +5% $819 | +10% $864 |
| Rate | -1.0pp $783 | -0.5pp $778 | base $773 | +0.5pp $768 | +1.0pp $763 |
UW: 25.0% down · 7.5% · 30yr · 1.5% tax · 5.0% vac · 8.0% maint · 8.0% mgmt
Financing live
Cash to close
- Down payment
- $4,975
- Closing costs
- $597
- Reserves months
- —
- Total cash needed
- —
Loan-product check · same deal, 3 products live
Conventional
25% down · 7.5% · 30yr
- Down + closing
- —
- Monthly P&I
- —
- Monthly cashflow
- —
- DSCR
- —
- Eligible?
- —
Personal DTI + credit; lowest rate.
DSCR
20% down · 8.5% · 30yr
- Down + closing
- —
- Monthly P&I
- —
- Monthly cashflow
- —
- DSCR
- —
- Eligible?
- —
No personal income docs; deal must DSCR.
Hard money
10% down · 12.0% · 12mo
- Down + closing
- —
- Monthly P&I
- —
- Monthly cashflow
- —
- DSCR
- —
- Eligible?
- —
Short-term bridge; refi at stabilization.
Rent comps 5 comps
| Address | Beds | Baths | Sqft | Rent | $/sqft | DOM | Units | Dist |
|---|---|---|---|---|---|---|---|---|
| 1604 Homewild Ave Jackson, MI | 2.0 | 1.0 | 726 | $1,100 | $1.52 | 45d | 1 | 0.47mi |
| 2921 Woods Circle Dr Jackson, MI | 1.0–3.0 | 1.0–2.0 | 872 | $1,132 | $1.30 | 45d | 11 | 0.71mi |
| 408 N Perrine St Jackson, MI | 3.0 | 1.0 | 990 | $1,350 | $1.36 | 45d | 1 | 1.02mi |
| 223 E Washington Ave Jackson, MI | 1.0 | 1.0 | 900 | $850 | $0.94 | 45d | 1 | 1.13mi |
| 159 W Pearl St Unit 202 Jackson, MI | 2.0 | 1.0 | 1000 | $1,350 | $1.35 | 45d | 1 | 1.44mi |
Listing history 4 events
-
2026-06-22remarks 460-char remark
-
2026-06-22statusdays on market $19,900 Pending 3 DOM
-
2026-06-19remarks 396-char remark
-
2026-06-19$19,900 Active 1 DOM
ⓘ Source: listings_history table (triggers on properties + properties_extension) + one-shot
backfill from property_details.listing_events for pre-trigger history.
Climate risk First Street
- Flood 1/10 Low FEMA zone X (unshaded) · 0% chance over 30 yrs
- Wildfire 1/10 Low
- Heat 2/10 Low 7 d/yr ≥97°F today · 14 d/yr by 30 yrs out
- Wind 2/10 Low
- Air quality 2/10 Low 1 unhealthy d/yr today · 1 by 30 yrs out
Nearby sold comps map
Loading sold comps map…
Walkable amenities ~0.75 mi
Loading nearby amenities…
Taxation est. · year 1
- Rental income
- $13,835
- − Mortgage interest
- −$1,115
- − Property taxes
- −$298
- − Insurance
- −$100
- − Repairs & maintenance
- −$1,107
- − Management
- −$1,107
- − Depreciation
- −$579
- Taxable income
- $9,529
- Est. tax owed @ 24.0%
- −$2,287
- After-tax cash flow
- $6,992/yr
For passive investors: Depreciation is non-cash, so a rental often shows a tax loss while cash-flowing — sheltering income. Rental losses are passive: they offset passive income freely, and up to $25,000/yr can offset ordinary (W-2) income if you actively participate and your MAGI is under $100k (phasing out to $0 by $150k); unused losses carry forward. On sale, claimed depreciation is recaptured at up to 25%, and gains may owe capital-gains tax (a 1031 exchange can defer both). Figures are a year-1 estimate at your 24.0% rate — not tax advice; consult a CPA.
Schools (NCES district)
- District
- Jackson Public Schools
- NCES district ID
- 2619620
- Math proficiency
- 15% ▼ -6.00%
- Reading proficiency
- 28% ▼ -3.00%
- Median HH income
- $38,344
- Composite
- 17.99/100
- National rank
- #8986
- State rank
- #458 of 540 in MI
Livability — Jackson
- Score
- 74/100
- State rank
- #197
- US rank
- #4970
Category grades
Schools grade is shown separately in the Schools card above.
Census & demographics
- Census place
- Jackson, MI
- County
- Jackson County · 85,581 people
- City population
- 85,581
- Metro
- Jackson, MI
- Population (ZIP)
- 36,474
- Household income
- $56,201
- Rent vs Own
- Severe rent burden
- 1383.0
Population outlook (Jackson County) Hauer SSP2
- Today (2025)
- 156,365 people
- By 2030
- 153,123 · -2.1%
- By 2040
- 144,981 · -7.3%
- By 2050
- 135,671 · -13.2%
- By 2075
- 113,833 · -27.2%
- By 2100
- 86,592 · -44.6%
Race, ethnicity, and origin ACS 2023
- Neighborhood character
- Predominantly White (73%)
- Race & ethnicity
- White 73% Black 15% Two or more races 9% Hispanic / Latino 5%
- Common ancestry
- Romanian 6% Lithuanian 3% Slovak 2%
- Foreign-born
- 2% · Canada
- Languages at home
- 97% English-only · Spanish 1% Other Indo-European 1%
Political lean MEDSL · Jackson
- 2024 margin
- Strong R (+21.3) · D 38.6% · R 59.9% · Other 1.5%
- 2008→2024 swing
- -23.7pp toward R · 2008: 2.4pp · 2024: -21.3pp
- All cycles
- 2024: R+21.3 2020: R+19.0 2016: R+20.1 2012: R+5.8 2008: D+2.4
Not yet ingested
- Civics
- —
Market trends
- HPI YoY
- ▼ -98.09%
- Current HPI
- 211.5474
- Rent YoY
- ▲ 7.54%
- Metro
- Jackson, MI
- State GDP YoY
- ▲ 1.37%
- F500 in state
- 28
Industry mix (Fortune 500 HQ in MI)
| Industry | F500 HQs | Revenue |
|---|---|---|
| Automotive Parts | 3 | $48B |
|
||
| Automotive | 2 | $372B |
|
||
| Chemicals | 1 | $45B |
|
||
| Automotive Retail | 1 | $29B |
|
||
| Healthcare / Medical Devices | 1 | $23B |
|
||
| Automotive Technology | 1 | $20B |
|
||
Price history
+33.6% since first listed12 events — show timeline
- 2026-06-18 Listed $19,900 SW Michigan MLS
- 2026-06-18 Listed $19,900 REALCOMP
- 2026-06-18 Listed $19,900 MiRealSource-MiMLS
- 2014-06-06 Listing Removed — REALCOMP
- 2014-03-26 Listed $11,500 REALCOMP
- 2008-03-07 Sold (MLS) $9,500 MiRealSource-MiMLS
- 2008-03-07 Sold (MLS) $9,500 REALCOMP
- 2008-03-07 Sold (MLS) $9,500 SW Michigan MLS
- 2008-02-25 Listing Removed — MiRealSource-MiMLS
- 2007-12-26 Listed $14,900 MiRealSource-MiMLS
- 2007-12-26 Listed $14,900 REALCOMP
- 2007-12-26 Listed $14,900 SW Michigan MLS
Property tax history
+5.2%/yrLatest (2025): $1,513 · -49.4% YoY. Source: county tax records.
Cash-flow waterfall
monthlySold comps — $/sqft
last 12 mo · ≤1 miLoading sold comps…