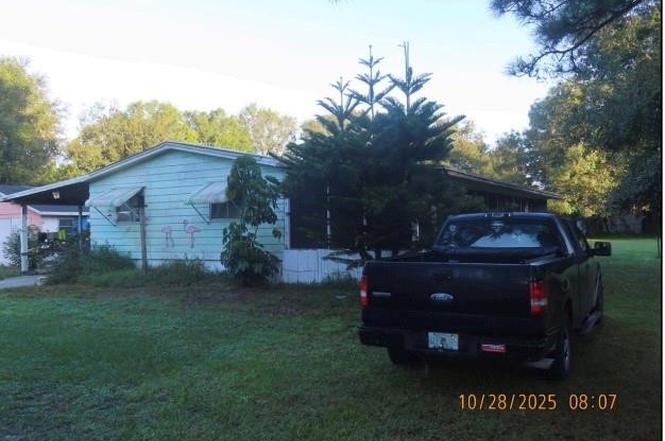
5889 NE 2nd St · Taylor Creek, FL
Flood risk 1/10 · Minimal
- FEMA flood zone
- X (unshaded)
- Chance of flooding over 30 yrs
- 0.0%
- Est. flood insurance / yr
- $507 – $1,088
Fire risk 4/10 · Minor
- Est. fire insurance / yr
- $947 – $1,759
Heat risk 9/10 · Severe
- Hot days now (above 108°F)
- 7 days/yr
- Hot days in 30 yrs
- 24 days/yr
Wind risk 10/10 · Severe
- Chance of severe wind over 30 yrs
- 99.0%
Air-quality risk 2/10 · Minimal
- Unhealthy air days now
- 1 days/yr
- Unhealthy air days in 30 yrs
- 2 days/yr
Risk factors via First Street. Map © Google.
Why this score? — see what drove the B- grade
The composite is a weighted blend of 9 inputs, each scored 0–100. Each bar is that input's sub-score; the figure is the points it added to the 100-point composite (weight × sub-score).
- Cash flow +30.0/30.0
- 1% rule +10.0/10.0
- DSCR +10.0/10.0
- ARV discount +4.3/15.0
- Schools +3.6/10.0
- Livability +2.8/5.0
- Rent growth +2.5/5.0
- Condition / age +2.5/5.0
- Appreciation +0.0/10.0
$75,000
🖨 Deal sheet (PDF) 📄 Offer letter ✓ Due diligence
Listing remarks
This 2-bedroom, 2-bath double wide with a detached garage is the perfect project for someone looking to bring a property back to life. The home will need a new roof, HVAC system, water heater, and some electrical work, along with a full interior update and likely some new windows. Situated on just under an acre, this property offers plenty of space and potential for the right buyer to renovate and make it their own or add to an investment portfolio.
Key facts
- 1 acre lot
- 2 garage spots
- Built 1980
Neighborhood map
What this means for you Summary
Snapshot
- This is a 2-bed/2.0-bath manufactured listed at $75k.
Deal economics
- At list price, monthly cash flow is $471 ($6k/yr) — positive.
- The deal already cash-flows at list — no discount required.
- Meets the 1% rule at list price ($1k rent vs $75k).
- Cap rate 13.8% vs local median 4.1% in Taylor Creek — top-decile yield for the area; either an underpriced asset or a hidden risk that comps aren't pricing in. Stress-test before assuming the spread holds.
Location & tenants
- Location reads 56/100 on livability (#874 in FL) — a working-class tenant base; expect higher turnover. Strengths: cost of living A+, housing A+, crime B+; Watch: schools F, amenities F, commute F.
- Okeechobee (town): math 44% / reading 42% proficiency, ranked #58 of 73 in FL (top 80%) — families likely to look elsewhere, expect single-tenant / working-renter base with shorter leases; 72% free/reduced lunch — lower-income household profile, screen leases tightly.
- Market conditions: 402 active listings in the ZIP; 18 units permitted in Okeechobee County in 2024 (0 in 5+ unit buildings).
- This rent runs 31% of the median local income ($53k/yr) — at the standard rent-burdened threshold; future hikes will face affordability resistance.
Forward outlook
- Local home prices are declining (-3.0%/yr); year-one equity from $519 of loan paydown is wiped out by about $2k of value loss. Plan a longer hold.
- Okeechobee County population projected at -21% by 2050 — secular population decline; favor cash flow + early exit over multi-decade hold.
- At projected returns (-3.0% appreciation + 3.0% rent growth), your $21k cash investment doubles in ~5 years — after that, you're playing with house money.
Negotiation context
- Only 0 days on market — expect competitive offers; lowballing is unlikely to land.
- Current owner paid $58k; 29% above their basis — modest negotiation headroom, anchor on the comps not their cost.
Risks & watch-outs
- Watch-outs: property tax is 2.7% of price.
- Climate carrying-cost: severe wind risk, 99% chance of damaging wind over 30y; extreme-heat days projected 7→24/yr by 2055 (HVAC capex compounding) — expect insurance premiums to compound above CPI over the hold.
Questions for the listing agent
- Property tax is high relative to price — has the assessment been appealed recently, and will the sale trigger a re-assessment?
- Is there a deadline driving the sale (1031 exchange, divorce, estate, relocation)? That informs how much negotiation room exists.
- Schools are F-rated, which usually means shorter tenancies and higher turnover. Who's the typical renter profile here, and what's been the actual vacancy rate?
- What's the average days-on-market for RENTAL listings here right now (not sales)? A rising rental-DOM trend means longer vacancies and softer asking-rent achievability than the comps imply.
- What's the recent tenant-quality profile in this submarket — average credit score on applications, eviction rate, late-payment / NSF rate, and stable-employment percentage? A property-management company in the area should have these aggregated.
- How much new for-sale + rental construction is in the pipeline within 1–3 miles? Heavy new supply typically softens prices + rents 12–24 months out; constrained supply supports both.
Investment metrics
- 1% rule
- 1.80% ✓
- Cap rate
- 13.84%
- Cash-on-cash
- 26.94%
- DSCR
- 2.20
- GRM
- 4.6
CMA / ARV
- ARV (on-the-fly)
- $69,984
- Comps found
- 1
Show comp detail 1 sale within ~0.75 mi
| Address | Dist | Beds/Ba | Sqft | Sold | Price | $/sf | Match |
|---|---|---|---|---|---|---|---|
| 6055 NE 9th Way | 0.47mi | 2/2.0 | 924 (+7%) | 8mo | $75,000 | $81 | 60 |
Match score weights: distance 35% · size 25% · config 20% · recency 20%. Top-matched comps best support the ARV.
Projected returns pro-forma
-3.0% appreciation · 3.0% rent growth · sell at horizon
- IRR
- 20.9%
- Equity multiple
- 1.85×
- Total profit
- $17,938
- Equity at exit
- $11,183
- IRR
- 29.1%
- Equity multiple
- 3.60×
- Total profit
- $54,553
- Equity at exit
- $6,485
Cash invested: $21,000 (down + closing). Projections, not guarantees.
Landlord ↔ Tenant lean methodology
- Overall (STATE)
- 87 Strongly Landlord-Friendly
- State Florida
- 87 Strongly Landlord-Friendly · R+3
- County
- — inherits STATE
- City
- — inherits STATE
ZIP-level market 34974
- Home prices YoY
- -15.6%
- Active inventory
- 402
- Price-to-rent
- 4.6×
Monthly cashflow live
- Estimated rent
- $1,349 medium interval (Pro) →
- Mortgage (P&I)
- −$393
- Tax from tax record
- −$170 /mo · $2,034/yr
- Insurance
- −$31
- HOA
- −$0
- Vacancy / Maint / Mgmt
- −$283
- Net cashflow
- $471
Break-even live
Sensitivity live
| Price | -10% $514 | -5% $493 | +0% $471 | +5% $450 | +10% $429 |
|---|---|---|---|---|---|
| Rent | -10% $365 | -5% $418 | +0% $471 | +5% $525 | +10% $578 |
| Rate | -1.0pp $509 | -0.5pp $490 | base $471 | +0.5pp $452 | +1.0pp $432 |
UW: 25.0% down · 7.5% · 30yr · 1.5% tax · 5.0% vac · 8.0% maint · 8.0% mgmt
Financing live
Cash to close
- Down payment
- $18,750
- Closing costs
- $2,250
- Reserves months
- —
- Total cash needed
- —
Loan-product check · same deal, 3 products live
Conventional
25% down · 7.5% · 30yr
- Down + closing
- —
- Monthly P&I
- —
- Monthly cashflow
- —
- DSCR
- —
- Eligible?
- —
Personal DTI + credit; lowest rate.
DSCR
20% down · 8.5% · 30yr
- Down + closing
- —
- Monthly P&I
- —
- Monthly cashflow
- —
- DSCR
- —
- Eligible?
- —
No personal income docs; deal must DSCR.
Hard money
10% down · 12.0% · 12mo
- Down + closing
- —
- Monthly P&I
- —
- Monthly cashflow
- —
- DSCR
- —
- Eligible?
- —
Short-term bridge; refi at stabilization.
Listing history 4 events
-
2025-11-04historical
-
2025-10-29$75,000
-
1988-04-01soldstatus $58,000
-
1979-12-01soldstatus $8,500
ⓘ Source: listings_history table (triggers on properties + properties_extension) + one-shot
backfill from property_details.listing_events for pre-trigger history.
Tax reassessment forecast FL · Resets to sale price
- Current annual tax
- $2,034 · $170/mo
- Projected year-2 tax
- $2,034 · $170/mo
- Expected delta
- $0/yr ($0/mo · 0.0%)
ⓘ Screening estimate from a state-policy table — verify with the county assessor before closing.
Climate risk First Street
- Flood 1/10 Low FEMA zone X (unshaded) · 0% chance over 30 yrs
- Wildfire 4/10 Moderate
- Heat 9/10 Extreme 7 d/yr ≥108°F today · 24 d/yr by 30 yrs out
- Wind 10/10 Extreme 99% chance of damaging wind over 30 yrs
- Air quality 2/10 Low 1 unhealthy d/yr today · 2 by 30 yrs out
Nearby sold comps map
Loading sold comps map…
Walkable amenities ~0.75 mi
Loading nearby amenities…
Taxation est. · year 1
- Rental income
- $16,185
- − Mortgage interest
- −$4,201
- − Property taxes
- −$2,034
- − Insurance
- −$375
- − Repairs & maintenance
- −$1,295
- − Management
- −$1,295
- − Depreciation
- −$2,182
- Taxable income
- $4,803
- Est. tax owed @ 24.0%
- −$1,153
- After-tax cash flow
- $4,504/yr
For passive investors: Depreciation is non-cash, so a rental often shows a tax loss while cash-flowing — sheltering income. Rental losses are passive: they offset passive income freely, and up to $25,000/yr can offset ordinary (W-2) income if you actively participate and your MAGI is under $100k (phasing out to $0 by $150k); unused losses carry forward. On sale, claimed depreciation is recaptured at up to 25%, and gains may owe capital-gains tax (a 1031 exchange can defer both). Figures are a year-1 estimate at your 24.0% rate — not tax advice; consult a CPA.
Schools (NCES district)
- District
- Okeechobee
- NCES district ID
- 1201410
- Math proficiency
- 44% ▼ -12.00%
- Reading proficiency
- 42% ▼ -4.00%
- Median HH income
- $36,710
- Composite
- 35.73/100
- National rank
- #4855
- State rank
- #58 of 73 in FL
Livability — Taylor Creek
- Score
- 56/100
- State rank
- #874
- US rank
- #23017
Category grades
Schools grade is shown separately in the Schools card above.
Census & demographics
- County
- Okeechobee County · 23,975 people
- Metro
- Okeechobee, FL
- Population (ZIP)
- 23,975
- Household income
- $53,013
- Rent vs Own
- Severe rent burden
- 399.0
Population outlook (Okeechobee County) Hauer SSP2
- Today (2025)
- 37,273 people
- By 2030
- 35,885 · -3.7%
- By 2040
- 32,931 · -11.6%
- By 2050
- 29,433 · -21.0%
- By 2075
- 19,607 · -47.4%
- By 2100
- 11,814 · -68.3%
Race, ethnicity, and origin ACS 2023
- Neighborhood character
- Predominantly White (74%)
- Race & ethnicity
- White 74% Hispanic / Latino 19% Two or more races 8% Asian 2% Black 2% Native American 1%
- Hispanic origin (detail)
- Mexican 12% Puerto Rican 1% Cuban 2%
- Common ancestry
- Lithuanian 2% Iranian 2% Italian 2%
- Foreign-born
- 11% · Canada, Jamaica
- Languages at home
- 81% English-only · Spanish 16% French/Haitian/Cajun 1% Other Indo-European 1%
Political lean MEDSL · Okeechobee
- 2024 margin
- Solid R (+53.8) · D 22.9% · R 76.7%
- 2008→2024 swing
- -34.6pp toward R · 2008: -19.2pp · 2024: -53.8pp
- All cycles
- 2024: R+53.8 2020: R+44.4 2016: R+39.5 2012: R+20.0 2008: R+19.2
Not yet ingested
- Civics
- —
Market trends
- HPI YoY
- ▼ -64.47%
- Current HPI
- 348.6692
- Rent YoY
- —
- Metro
- Okeechobee, FL
- State GDP YoY
- ▲ 3.28%
- F500 in state
- 36
Industry mix (Fortune 500 HQ in FL)
| Industry | F500 HQs | Revenue |
|---|---|---|
| Industrial Technology | 2 | $29B |
|
||
| Insurance | 2 | $17B |
|
||
| Retail | 1 | $60B |
|
||
| Technology Distribution | 1 | $58B |
|
||
| Homebuilding | 1 | $35B |
|
||
| Technology Manufacturing | 1 | $35B |
|
||
Price history
+782.4% since first listed4 events — show timeline
- 2025-11-04 Listing Removed — Beaches MLS
- 2025-10-29 Listed $75,000 Beaches MLS
- 1988-04-01 Sold (Public Records) $58,000 Public Records
- 1979-12-01 Sold (Public Records) $8,500 Public Records
Property tax history
+6.7%/yrLatest (2025): $2,034 · +5.5% YoY. Source: county tax records.
Cash-flow waterfall
monthlySold comps — $/sqft
last 12 mo · ≤1 miLoading sold comps…