 8-Plex
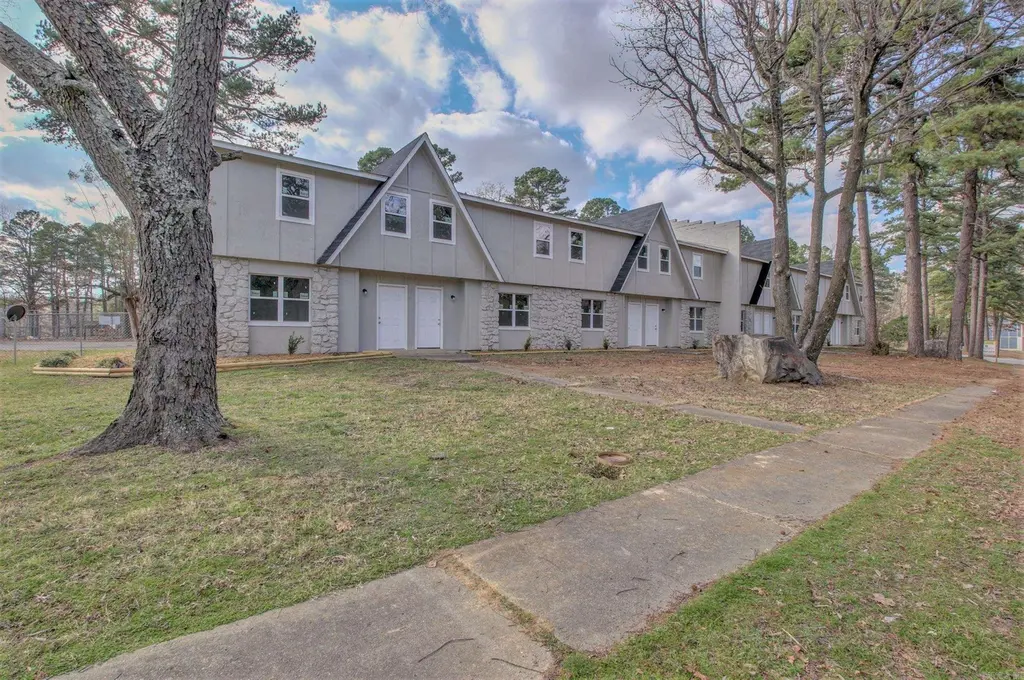
1900 Labette Manor Dr · Little Rock, AR
Flood risk 1/10 · Minimal
- FEMA flood zone
- X (unshaded)
- Chance of flooding over 30 yrs
- 0.0%
- Est. flood insurance / yr
- $507 – $1,088
Fire risk 1/10 · Minimal
- Est. fire insurance / yr
- $1,499 – $2,785
Heat risk 7/10 · Major
- Hot days now (above 111°F)
- 7 days/yr
- Hot days in 30 yrs
- 19 days/yr
Wind risk 4/10 · Minor
- Chance of severe wind over 30 yrs
- 9.0%
Air-quality risk 2/10 · Minimal
- Unhealthy air days now
- 0 days/yr
- Unhealthy air days in 30 yrs
- 1 days/yr
Risk factors via First Street. Map © Google.
Why this score? — see what drove the C+ grade
The composite is a weighted blend of 9 inputs, each scored 0–100. Each bar is that input's sub-score; the figure is the points it added to the 100-point composite (weight × sub-score).
- Cash flow +26.4/30.0
- DSCR +9.0/10.0
- ARV discount +7.5/15.0
- 1% rule +7.1/10.0
- Livability +3.7/5.0
- Rent growth +3.1/5.0
- Condition / age +2.5/5.0
- Schools +2.1/10.0
- Appreciation +0.0/10.0
$799,000
🖨 Deal sheet 📄 Offer letter ✓ Due diligence
Multi-family units
County records classify this as Multi-Family (5+ Unit). Listing-text estimate: 8 units. confirmed
5+ unit building — per-unit beds/baths from public records are typically unavailable; the breakdown below (if shown) is an estimate from the listing text.
Listing remarks MLS
Renovated in the last 4 years. INSTANT INCOME! Fantastic 8-unit apartment building in West Central Little Rock, close to interstates, hospitals (Baptist), shopping, dining, and just 10–15 minutes from downtown! These townhomes are highly desirable and easy to lease, with consistent interest from renters. All units share the same floorplan: 3 bedrooms upstairs with a full bath, and downstairs features a spacious living room, furnished kitchen, and ½ bath. Each unit has washer & dryer hookups, front and rear entrances, onsite parking, and extra private storage outside. Currently, 7 of the 8 units are leased at $895/month, with the vacant unit actively being marketed. This is an excellent opportunity for investors seeking steady cash flow in a convenient, high-demand area. No seller property disclosure. Buyers should verify and calculate lot size using their own measurements. Agents: see remarks. Owner financing terms found in the docs section.
Key facts
- Close to interstates
- Close to hospitals
- Close to dining
Tags
Neighborhood map
What this means for you Summary
Snapshot
- This is a 8 × 3-bed/2.5-bath units multifamily listed at $799k.
Deal economics
- At list price, monthly cash flow is $2k ($25k/yr) — positive. Per door: $261/mo.
- The deal already cash-flows at list — no discount required.
- Meets the 1% rule at list price ($10k rent vs $799k).
- Recommended offer: $703k (12.0% below list) — sets the bar for market timing.
- Cap rate 9.4% vs local median 4.1% in Little Rock — top-decile yield for the area; either an underpriced asset or a hidden risk that comps aren't pricing in. Stress-test before assuming the spread holds.
Location & tenants
- Location reads 73/100 on livability (#22 in AR) — a middle-class / working-renter tenant base. Strengths: commute A+, cost of living A+, housing A+; Watch: crime F.
- Little Rock School District (urban): math 23% / reading 26% proficiency, ranked #183 of 238 in AR (top 77%) — low school quality limits family demand, transient renter base, plan for 1-2y turnover; 69% free/reduced lunch — lower-income household profile, screen leases tightly.
- Market conditions: Rents rising (+2.4%/yr); 116 active listings in the ZIP; 1,006 units permitted in Pulaski County in 2024 (0 in 5+ unit buildings).
- At $9,632/mo this rent would consume 169% of the median local household income ($68k/yr) (locally 1073% of renters already pay >50% of income on rent) — very limited rent-growth headroom before tenants either downsize or default.
Forward outlook
- Local home prices are declining (-3.0%/yr); year-one equity from $6k of loan paydown is wiped out by about $24k of value loss. Plan a longer hold.
- Pulaski County population projected at +6% by 2050 — modest demand growth; plan on rents tracking national, not racing it.
Negotiation context
- It's been on market 252 days — a 12% lower offer ($703k) is reasonable based on typical stale-listing flexibility.
- 8 sale attempts since 19y ago with the ask held roughly flat each time — persistent listings suggest the price (not the market) is what's stuck; bring a comps-based counter.
- Current owner paid $380k; list at $799k implies a 110% gain — meaningful room to come down on a strong offer.
Risks & watch-outs
- Climate carrying-cost: extreme-heat days projected 7→19/yr by 2055 (HVAC capex compounding) — expect insurance premiums to compound above CPI over the hold.
Questions for the listing agent
- It's been on market 252 days. Have you received any prior offers? Is the seller open to a 12% concession, seller financing, or rate buy-down credit?
- Can we see the unit-by-unit rent roll, current vacancy, and any below-market leases? What's the average tenancy length?
- What capital expenditures (roof, boiler, parking lot, exteriors) have been made in the last 5 years, and what's planned in the next 2?
- Why hasn't it sold? Are there any deal-killer items the seller is aware of (foundation, flood, title, zoning, code violations)?
- Is there a deadline driving the sale (1031 exchange, divorce, estate, relocation)? That informs how much negotiation room exists.
- Crime grade is F in this area — have there been break-ins, vandalism, or insurance claims at this property in the last 3 years? What carrier currently insures it and at what premium?
- What's the average days-on-market for RENTAL listings here right now (not sales)? A rising rental-DOM trend means longer vacancies and softer asking-rent achievability than the comps imply.
- What's the recent tenant-quality profile in this submarket — average credit score on applications, eviction rate, late-payment / NSF rate, and stable-employment percentage? A property-management company in the area should have these aggregated.
- How much new apartment / multifamily construction is in the pipeline within 1–3 miles? Heavy new supply (>2% of stock underway) typically softens rents 12–24 months out; light construction supports rent growth.
Investment metrics
- 1% rule
- 1.21% ✓
- Cap rate
- 9.43%
- Cash-on-cash
- 11.20%
- DSCR
- 1.50
- GRM
- 6.9
CMA / ARV
- ARV (median comp)
- $512,685
- List price
- $799,000
- Delta
- 55.85%
- Verdict
- OVERPRICED
- Comps
- 2 within 2.0 mi
Projected returns pro-forma
-3.0% appreciation · 2.4% rent growth · sell at horizon
- IRR
- -0.3%
- Equity multiple
- 0.99×
- Total profit
- $-2,149
- Equity at exit
- $119,133
- IRR
- 8.8%
- Equity multiple
- 1.65×
- Total profit
- $146,490
- Equity at exit
- $69,083
Cash invested: $223,720 (down + closing). Projections, not guarantees.
Landlord ↔ Tenant lean methodology
- Overall (STATE)
- 92 Strongly Landlord-Friendly
- State Arkansas
- 92 Strongly Landlord-Friendly · R+14
- County
- — inherits STATE
- City
- — inherits STATE
ZIP-level market 72205
- Rents YoY
- 2.4%
- Active inventory
- 116
- Price-to-rent
- 55.3×
Monthly cashflow live
- Estimated rent
- $9,632 high interval (Pro) →
- Mortgage (P&I)
- −$4,190
- Tax est. 1.5%
- −$999 /mo · $11,985/yr
- Insurance
- −$333
- HOA
- −$0
- Vacancy / Maint / Mgmt
- −$2,023
- Net cashflow
- $2,088
Break-even live
8-unit breakdown (identical units grouped — click to expand)
| Units | Beds | Baths | Est. rent |
|---|---|---|---|
| 8× units | 3 | 2.5 | $9,632 |
| #1 | 3 | 2.5 | $1,204 |
| #2 | 3 | 2.5 | $1,204 |
| #3 | 3 | 2.5 | $1,204 |
| #4 | 3 | 2.5 | $1,204 |
| #5 | 3 | 2.5 | $1,204 |
| #6 | 3 | 2.5 | $1,204 |
| #7 | 3 | 2.5 | $1,204 |
| #8 | 3 | 2.5 | $1,204 |
| Total (8 units) | $9,632 | ||
UW: 25.0% down · 7.5% · 30yr · 1.5% tax · 5.0% vac · 8.0% maint · 8.0% mgmt
Financing live
Cash to close
- Down payment
- $199,750
- Closing costs
- $23,970
- Reserves months
- —
- Total cash needed
- —
Loan-product check · same deal, 3 products live
Conventional
25% down · 7.5% · 30yr
- Down + closing
- —
- Monthly P&I
- —
- Monthly cashflow
- —
- DSCR
- —
- Eligible?
- —
Personal DTI + credit; lowest rate.
DSCR
20% down · 8.5% · 30yr
- Down + closing
- —
- Monthly P&I
- —
- Monthly cashflow
- —
- DSCR
- —
- Eligible?
- —
No personal income docs; deal must DSCR.
Hard money
10% down · 12.0% · 12mo
- Down + closing
- —
- Monthly P&I
- —
- Monthly cashflow
- —
- DSCR
- —
- Eligible?
- —
Short-term bridge; refi at stabilization.
Listing history 32 events
-
2026-06-18days on market $799,000 Active 252 DOM
-
2026-06-17days on market $799,000 Active 251 DOM
-
2026-06-16days on market $799,000 Active 250 DOM
-
2026-06-15days on market $799,000 Active 249 DOM
-
2026-06-14days on market $799,000 Active 247 DOM
-
2026-06-13days on market $799,000 Active 246 DOM
-
2026-06-10days on market $799,000 Active 244 DOM
-
2026-06-09days on market $799,000 Active 243 DOM
-
2026-06-08days on market $799,000 Active 242 DOM
-
2026-06-05days on market $799,000 Active 238 DOM
-
2026-06-03days on market $799,000 Active 237 DOM
-
2026-06-02days on market $799,000 Active 236 DOM
-
2026-06-01days on market $799,000 Active 235 DOM
-
2026-05-31days on market $799,000 Active 234 DOM
-
2026-05-31days on market $799,000 Active 233 DOM
-
2025-10-09$799,000 New Listing 974-char remark
Show marketing remark (974 chars)
Renovated in the last 4 years. INSTANT INCOME! Fantastic 8-unit apartment building in West Central Little Rock, close to interstates, hospitals (Baptist), shopping, dining, and just 10–15 minutes from downtown! These townhomes are highly desirable and easy to lease, with consistent interest from renters. All units share the same floorplan: 3 bedrooms upstairs with a full bath, and downstairs features a spacious living room, furnished kitchen, and ½ bath. Each unit has washer & dryer hookups, front and rear entrances, onsite parking, and extra private storage outside. Currently, 7 of the 8 units are leased at $895/month, with the vacant unit actively being marketed. This is an excellent opportunity for investors seeking steady cash flow in a convenient, high-demand area. No seller property disclosure. Buyers should verify and calculate lot size using their own measurements. Agents: see remarks. Owner financing terms found in the docs section.
-
2025-03-30historical $895
-
2025-02-26$895
-
2025-02-26historical $895
-
2025-01-31$895
-
2020-01-01historical
-
2019-12-04status Back on Market
-
2019-08-17historical
-
2019-07-25$285,000
-
2016-05-01historical
-
2016-02-27price $330,000
-
2015-06-04$359,000 Active
-
2014-02-15historical
-
2013-08-14$325,000
-
2008-06-02soldstatus $380,000
-
2008-03-28historical
-
2007-11-19$408,000
ⓘ Source: listings_history table (triggers on properties + properties_extension) + one-shot
backfill from property_details.listing_events for pre-trigger history.
Climate risk First Street
- Flood 1/10 Low FEMA zone X (unshaded) · 0% chance over 30 yrs
- Wildfire 1/10 Low
- Heat 7/10 Severe 7 d/yr ≥111°F today · 19 d/yr by 30 yrs out
- Wind 4/10 Moderate 9% chance of damaging wind over 30 yrs
- Air quality 2/10 Low 0 unhealthy d/yr today · 1 by 30 yrs out
Nearby sold comps map
Loading sold comps map…
Walkable amenities ~0.75 mi
Loading nearby amenities…
Taxation est. · year 1
- Rental income
- $115,584
- − Mortgage interest
- −$44,756
- − Property taxes
- −$11,985
- − Insurance
- −$3,995
- − Repairs & maintenance
- −$9,247
- − Management
- −$9,247
- − Depreciation
- −$23,244
- Taxable income
- $13,111
- Est. tax owed @ 24.0%
- −$3,147
- After-tax cash flow
- $21,904/yr
For passive investors: Depreciation is non-cash, so a rental often shows a tax loss while cash-flowing — sheltering income. Rental losses are passive: they offset passive income freely, and up to $25,000/yr can offset ordinary (W-2) income if you actively participate and your MAGI is under $100k (phasing out to $0 by $150k); unused losses carry forward. On sale, claimed depreciation is recaptured at up to 25%, and gains may owe capital-gains tax (a 1031 exchange can defer both). Figures are a year-1 estimate at your 24.0% rate — not tax advice; consult a CPA.
Schools (NCES district)
- District
- Little Rock School District
- NCES district ID
- 0509000
- Math proficiency
- 23% ▼ -12.00%
- Reading proficiency
- 26% ▼ -8.00%
- Median HH income
- $43,346
- Composite
- 21.0/100
- National rank
- #8457
- State rank
- #183 of 238 in AR
Livability — Little Rock
- Score
- 73/100
- State rank
- #22
- US rank
- #5295
Category grades
Schools grade is shown separately in the Schools card above.
Census & demographics
- Census place
- Little Rock, AR
- County
- Pulaski County · 372,764 people
- City population
- 218,896
- Metro
- Little Rock-North Little Rock-Conway, AR
- Population (ZIP)
- 23,043
- Household income
- $68,415
- Rent vs Own
- Severe rent burden
- 1073.0
Population outlook (Pulaski County) Hauer SSP2
- Today (2025)
- 415,378 people
- By 2030
- 423,720 · +2.0%
- By 2040
- 435,182 · +4.8%
- By 2050
- 440,904 · +6.1%
- By 2075
- 445,521 · +7.3%
- By 2100
- 419,173 · +0.9%
Race, ethnicity, and origin ACS 2023
- Neighborhood character
- Majority White (64%)
- Race & ethnicity
- White 64% Black 26% Two or more races 4% Hispanic / Latino 3% Asian 3%
- Common ancestry
- Italian 5% Slovak 3% Lithuanian 1%
- Foreign-born
- 4% · Canada
- Languages at home
- 93% English-only · Spanish 3% Tagalog/Filipino 1% Other Indo-European 1%
Political lean MEDSL · Pulaski
- 2024 margin
- Strong D (+22.1) · D 59.8% · R 37.7% · Other 2.5%
- 2008→2024 swing
- +10.6pp toward D · 2008: 11.6pp · 2024: 22.1pp
- All cycles
- 2024: D+22.1 2020: D+22.5 2016: D+17.9 2012: D+11.4 2008: D+11.6
Not yet ingested
- Civics
- —
Market trends
- HPI YoY
- ▼ -243.61%
- Current HPI
- 215.0083
- Rent YoY
- ▲ 2.40%
- Metro
- Little Rock-North Little Rock-Conway, AR
- State GDP YoY
- ▲ 3.80%
- F500 in state
- 10
Industry mix (Fortune 500 HQ in AR)
| Industry | F500 HQs | Revenue |
|---|---|---|
| Retail | 1 | $681B |
|
||
| Food / Agriculture | 1 | $53B |
|
||
| Retail / Energy | 1 | $22B |
|
||
| Transportation / Logistics | 1 | $12B |
|
||
| Energy | 1 | $4B |
|
||
Price history
+95.8% since first listed17 events — show timeline
- 2025-10-09 Listed $799,000 CARMLS
- 2025-03-30 Rental Removed $895 CARMLS
- 2025-02-26 Listed for Rent $895 CARMLS
- 2025-02-26 Rental Removed $895 CARMLS
- 2025-01-31 Listed for Rent $895 CARMLS
- 2020-01-01 Listing Removed — CARMLS
- 2019-12-04 Relisted — CARMLS
- 2019-08-17 Listing Removed — CARMLS
- 2019-07-25 Listed $285,000 CARMLS
- 2016-05-01 Listing Removed — CARMLS
- 2016-02-27 Price Changed $330,000 CARMLS
- 2015-06-04 Listed $359,000 CARMLS
- 2014-02-15 Listing Removed — CARMLS
- 2013-08-14 Listed $325,000 CARMLS
- 2008-06-02 Sold (MLS) $380,000 CARMLS
- 2008-03-28 Listing Removed — CARMLS
- 2007-11-19 Listed $408,000 CARMLS
Cash-flow waterfall
monthlySold comps — $/sqft
last 12 mo · ≤1 miLoading sold comps…