 Duplex
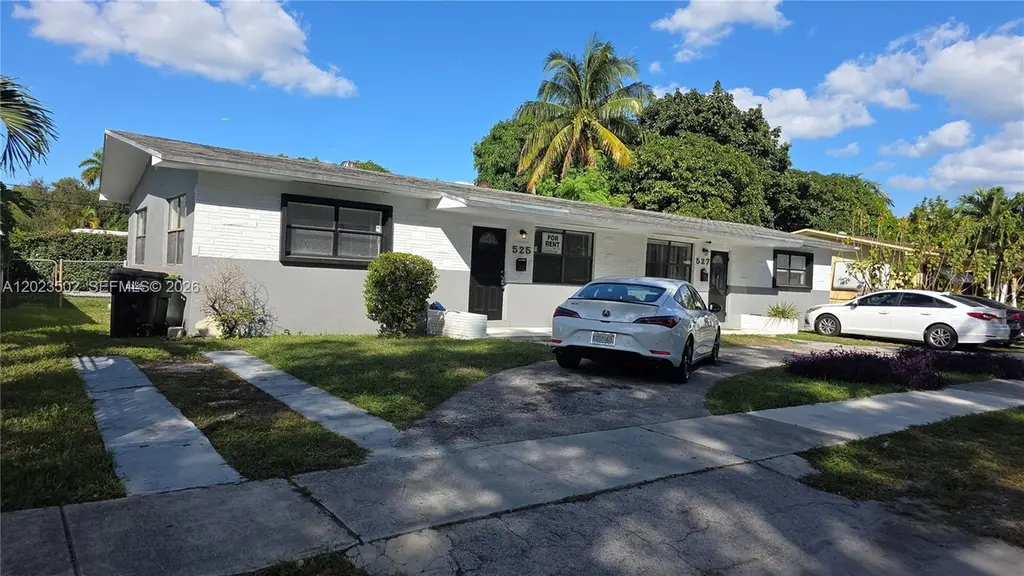
525 NE 132nd Ter · North Miami, FL
Flood risk 4/10 · Minor
- FEMA flood zone
- X (unshaded)
- Chance of flooding over 30 yrs
- 0.13%
- Est. flood insurance / yr
- $507 – $1,088
Fire risk 1/10 · Minimal
- Est. fire insurance / yr
- $947 – $1,759
Heat risk 10/10 · Severe
- Hot days now (above 104°F)
- 7 days/yr
- Hot days in 30 yrs
- 27 days/yr
Wind risk 10/10 · Severe
- Chance of severe wind over 30 yrs
- 99.0%
Air-quality risk 2/10 · Minimal
- Unhealthy air days now
- 1 days/yr
- Unhealthy air days in 30 yrs
- 2 days/yr
Risk factors via First Street. Map © Google.
Why this score? — see what drove the C grade
The composite is a weighted blend of 9 inputs, each scored 0–100. Each bar is that input's sub-score; the figure is the points it added to the 100-point composite (weight × sub-score).
- Cash flow +23.1/30.0
- ARV discount +7.5/15.0
- DSCR +7.4/10.0
- 1% rule +5.9/10.0
- Schools +4.2/10.0
- Livability +4.2/5.0
- Condition / age +2.5/5.0
- Rent growth +2.3/5.0
- Appreciation +0.0/10.0
$705,000
🖨 Deal sheet 📄 Offer letter ✓ Due diligence
Multi-family units
County records classify this as Multi-Family (2-4 Unit). Listing-text estimate: 2 units. confirmed
Listing remarks
Charming Duplex with 2-bedrooms, 1-bath and Florida room in North Miami. This light-filled home offers an inviting floor plan with tile floors, an ample space big kitchen, and a spacious living area. Outside, you’ll find a beautiful private patio perfect for entertaining, plus a large driveway with room for up to six cars. Located on a quiet street near NE 135th St and NE 6th Ave, you’ll enjoy quick access to shops, restaurants, major highways, and local parks while still having a peaceful neighborhood feel. Freshly painted and move-in ready, this residence features ample closet space, washer/dryer connections. Barry University, grocery stores, and public transit are all within
Key facts
- Quiet street
- Large driveway
- Public transit
Tags
Property features AI
Finance
- Financial info: Current actual rent: $4,900 (for the listed unit type); Rent includes gardener
Exterior
- Parking: Four total parking spaces
- Utilities: Public water; Public sewer; Cable not available
- Home design: Single-story building; Resale property
- Construction: Block construction; Shingle roof
- Exterior features: Less than quarter acre lot
Interior
- Kitchen: Range; Microwave; Refrigerator
- Bedrooms: Two 2-bedroom units
- Flooring: Tile
- Bathrooms: Each unit has 1 full bathroom
- Heating & cooling: Central heating; Central air conditioning
- Interior features: Double-hung and metal windows; Tile flooring
- Laundry & utility: Hot water included with rent
Neighborhood map
What this means for you Summary
Snapshot
- This is a 2 × 2-bed/1.0-bath units multifamily listed at $705k.
Deal economics
- At list price, monthly cash flow is $1k ($15k/yr) — positive. Per door: $629/mo.
- The deal already cash-flows at list — no discount required.
- Meets the 1% rule at list price ($8k rent vs $705k).
- Recommended offer: $694k (1.5% below list) — sets the bar for market timing.
- Cap rate 8.4% vs local median 4.1% in North Miami — top-decile yield for the area; either an underpriced asset or a hidden risk that comps aren't pricing in. Stress-test before assuming the spread holds.
Location & tenants
- Location reads 83/100 on livability (#51 in FL, #914 nationally) — a professional / high-income tenant draw. Strengths: amenities A+, commute A+, health & safety A+; Watch: schools D+, employment D.
- Miami-Dade (suburban): math 45% / reading 54% proficiency, ranked #40 of 73 in FL (top 55%) — families likely to look elsewhere, expect single-tenant / working-renter base with shorter leases; 64% free/reduced lunch — lower-income household profile, screen leases tightly.
- Market conditions: Rents soft (-0.7%/yr); 338 active listings in the ZIP; 10,051 units permitted in Miami-Dade County in 2024 (7,758 in 5+ unit buildings).
- At $7,691/mo this rent would consume 158% of the median local household income ($58k/yr) (locally 3226% of renters already pay >50% of income on rent) — very limited rent-growth headroom before tenants either downsize or default.
Forward outlook
- Local home prices are declining (-3.0%/yr); year-one equity from $5k of loan paydown is wiped out by about $21k of value loss. Plan a longer hold.
- Miami-Dade County population projected at +28% by 2050 — long-run rental-demand tailwind backs the buy-and-hold thesis.
Negotiation context
- It's been on market 18 days — a 2% lower offer ($694k) is reasonable based on typical stale-listing flexibility.
- 10 sale attempts since 6y ago with the ask held roughly flat each time — persistent listings suggest the price (not the market) is what's stuck; bring a comps-based counter.
- Current owner paid $375k; list at $705k implies a 88% gain — meaningful room to come down on a strong offer.
Risks & watch-outs
- Watch-outs: built in 1959 — expect roof / HVAC / electrical / plumbing capex.
- Climate carrying-cost: severe wind risk, 99% chance of damaging wind over 30y; extreme-heat days projected 7→27/yr by 2055 (HVAC capex compounding) — expect insurance premiums to compound above CPI over the hold.
Questions for the listing agent
- Can we see the unit-by-unit rent roll, current vacancy, and any below-market leases? What's the average tenancy length?
- What capital expenditures (roof, boiler, parking lot, exteriors) have been made in the last 5 years, and what's planned in the next 2?
- Built in 1959 — when were the roof, HVAC, electrical panel, plumbing, and water heater last replaced?
- Is there a deadline driving the sale (1031 exchange, divorce, estate, relocation)? That informs how much negotiation room exists.
- Schools are D-rated, which usually means shorter tenancies and higher turnover. Who's the typical renter profile here, and what's been the actual vacancy rate?
- What's the average days-on-market for RENTAL listings here right now (not sales)? A rising rental-DOM trend means longer vacancies and softer asking-rent achievability than the comps imply.
- What's the recent tenant-quality profile in this submarket — average credit score on applications, eviction rate, late-payment / NSF rate, and stable-employment percentage? A property-management company in the area should have these aggregated.
- How much new apartment / multifamily construction is in the pipeline within 1–3 miles? Heavy new supply (>2% of stock underway) typically softens rents 12–24 months out; light construction supports rent growth.
Investment metrics
- 1% rule
- 1.09% ✓
- Cap rate
- 8.44%
- Cash-on-cash
- 7.65%
- DSCR
- 1.34
- GRM
- 7.6
CMA / ARV
No comps found within radius.
Projected returns pro-forma
-3.0% appreciation · 0.0% rent growth · sell at horizon
- IRR
- -8.0%
- Equity multiple
- 0.71×
- Total profit
- $-56,532
- Equity at exit
- $105,118
- IRR
- -2.9%
- Equity multiple
- 0.83×
- Total profit
- $-32,772
- Equity at exit
- $60,956
Cash invested: $197,400 (down + closing). Projections, not guarantees.
Landlord ↔ Tenant lean methodology
- Overall (STATE)
- 87 Strongly Landlord-Friendly
- State Florida
- 87 Strongly Landlord-Friendly · R+3
- County
- — inherits STATE
- City
- — inherits STATE
ZIP-level market 33161
- Rents YoY
- -0.7%
- Active inventory
- 338
- Price-to-rent
- 15.3×
Monthly cashflow live
- Estimated rent
- $7,691 medium interval (Pro) →
- Mortgage (P&I)
- −$3,697
- Tax from tax record
- −$826 /mo · $9,916/yr
- Insurance
- −$294
- HOA
- −$0
- Vacancy / Maint / Mgmt
- −$1,615
- Net cashflow
- $1,259
Break-even live
2-unit breakdown (identical units grouped — click to expand)
| Units | Beds | Baths | Est. rent |
|---|---|---|---|
| 2× units | 2 | 1 | $7,690 |
| #1 | 2 | 1 | $3,845 |
| #2 | 2 | 1 | $3,845 |
| Total (2 units) | $7,691 | ||
UW: 25.0% down · 7.5% · 30yr · 1.5% tax · 5.0% vac · 8.0% maint · 8.0% mgmt
Financing live
Cash to close
- Down payment
- $176,250
- Closing costs
- $21,150
- Reserves months
- —
- Total cash needed
- —
Loan-product check · same deal, 3 products live
Conventional
25% down · 7.5% · 30yr
- Down + closing
- —
- Monthly P&I
- —
- Monthly cashflow
- —
- DSCR
- —
- Eligible?
- —
Personal DTI + credit; lowest rate.
DSCR
20% down · 8.5% · 30yr
- Down + closing
- —
- Monthly P&I
- —
- Monthly cashflow
- —
- DSCR
- —
- Eligible?
- —
No personal income docs; deal must DSCR.
Hard money
10% down · 12.0% · 12mo
- Down + closing
- —
- Monthly P&I
- —
- Monthly cashflow
- —
- DSCR
- —
- Eligible?
- —
Short-term bridge; refi at stabilization.
Listing history 13 events
-
2026-06-18days on market $705,000 Active 18 DOM
-
2026-06-17days on market $705,000 Active 17 DOM
-
2026-06-16days on market $705,000 Active 16 DOM
-
2026-06-15days on market $705,000 Active 15 DOM
-
2026-06-13days on market $705,000 Active 13 DOM
-
2026-06-09days on market $705,000 Active 9 DOM
-
2026-06-08days on market $705,000 Active 8 DOM
-
2026-06-07days on market $705,000 Active 7 DOM
-
2026-06-04days on market $705,000 Active 4 DOM
-
2026-06-03days on market $705,000 Active 3 DOM
-
2026-06-02days on market $705,000 Active 2 DOM
-
2026-06-01remarks 687-char remark
-
2026-06-01$705,000 Active 1 DOM
ⓘ Source: listings_history table (triggers on properties + properties_extension) + one-shot
backfill from property_details.listing_events for pre-trigger history.
Tax reassessment forecast FL · Resets to sale price
- Current annual tax
- $9,916 · $826/mo
- Projected year-2 tax
- $9,916 · $826/mo
- Expected delta
- $0/yr ($0/mo · 0.0%)
ⓘ Screening estimate from a state-policy table — verify with the county assessor before closing.
Climate risk First Street
- Flood 4/10 Moderate FEMA zone X (unshaded) · 13% chance over 30 yrs
- Wildfire 1/10 Low
- Heat 10/10 Extreme 7 d/yr ≥104°F today · 27 d/yr by 30 yrs out
- Wind 10/10 Extreme 99% chance of damaging wind over 30 yrs
- Air quality 2/10 Low 1 unhealthy d/yr today · 2 by 30 yrs out
Nearby sold comps map
Loading sold comps map…
Walkable amenities ~0.75 mi
Loading nearby amenities…
Taxation est. · year 1
- Rental income
- $92,292
- − Mortgage interest
- −$39,491
- − Property taxes
- −$9,916
- − Insurance
- −$3,525
- − Repairs & maintenance
- −$7,383
- − Management
- −$7,383
- − Depreciation
- −$20,509
- Taxable income
- $4,084
- Est. tax owed @ 24.0%
- −$980
- After-tax cash flow
- $14,124/yr
For passive investors: Depreciation is non-cash, so a rental often shows a tax loss while cash-flowing — sheltering income. Rental losses are passive: they offset passive income freely, and up to $25,000/yr can offset ordinary (W-2) income if you actively participate and your MAGI is under $100k (phasing out to $0 by $150k); unused losses carry forward. On sale, claimed depreciation is recaptured at up to 25%, and gains may owe capital-gains tax (a 1031 exchange can defer both). Figures are a year-1 estimate at your 24.0% rate — not tax advice; consult a CPA.
Schools (NCES district)
- District
- Miami-Dade
- NCES district ID
- 1200390
- Math proficiency
- 45% ▼ -16.00%
- Reading proficiency
- 54% ▼ -5.00%
- Median HH income
- $43,928
- Composite
- 41.76/100
- National rank
- #3397
- State rank
- #40 of 73 in FL
Livability — North Miami
- Score
- 83/100
- State rank
- #51
- US rank
- #914
Category grades
Schools grade is shown separately in the Schools card above.
Census & demographics
- Census place
- North Miami, FL
- County
- Miami-Dade County · 2,697,751 people
- Metro
- Miami-Fort Lauderdale-Pompano Beach, FL
- Population (ZIP)
- 54,814
- Household income
- $58,325
- Rent vs Own
- Severe rent burden
- 3226.0
Population outlook (Miami-Dade County) Hauer SSP2
- Today (2025)
- 3,126,439 people
- By 2030
- 3,325,765 · +6.4%
- By 2040
- 3,697,561 · +18.3%
- By 2050
- 4,012,134 · +28.3%
- By 2075
- 4,605,612 · +47.3%
- By 2100
- 4,866,598 · +55.7%
Race, ethnicity, and origin ACS 2023
- Neighborhood character
- Diverse neighborhood (Simpson 0.58)
- Race & ethnicity
- Black 56% Hispanic / Latino 31% Two or more races 18% White 8% Asian 2%
- Hispanic origin (detail)
- Puerto Rican 4% Cuban 7% Dominican 4% Salvadoran 1%
- Common ancestry
- Hispanic 35% Estonian 1% Lithuanian 1%
- Foreign-born
- 51% · Canada, Jamaica, Dominican Republic
- Languages at home
- 25% English-only · French/Haitian/Cajun 41% Spanish 30% Other Indo-European 2%
Political lean MEDSL · Miami-Dade
- 2024 margin
- R (+11.4) · D 43.9% · R 55.4%
- 2008→2024 swing
- -27.6pp toward R · 2008: 16.1pp · 2024: -11.4pp
- All cycles
- 2024: R+11.4 2020: D+7.3 2016: D+29.6 2012: D+23.7 2008: D+16.1
Not yet ingested
- Civics
- —
Market trends
- HPI YoY
- ▼ -492.86%
- Current HPI
- 630.6932
- Rent YoY
- ▼ -0.73%
- Metro
- Miami-Fort Lauderdale-Pompano Beach, FL
- State GDP YoY
- ▲ 3.28%
- F500 in state
- 36
Industry mix (Fortune 500 HQ in FL)
| Industry | F500 HQs | Revenue |
|---|---|---|
| Industrial Technology | 2 | $29B |
|
||
| Insurance | 2 | $17B |
|
||
| Retail | 1 | $60B |
|
||
| Technology Distribution | 1 | $58B |
|
||
| Homebuilding | 1 | $35B |
|
||
| Technology Manufacturing | 1 | $35B |
|
||
Price history
+66.9% since first listed23 events — show timeline
- 2026-05-19 Listed $705,000 MARMLS
- 2026-03-25 Listed for Rent $2,550 LISTANZA
- 2026-03-14 Rental Removed $2,550 LISTANZA
- 2026-01-01 Listed for Rent $2,550 LISTANZA
- 2025-12-21 Rental Removed $2,550 LISTANZA
- 2025-12-18 Listed for Rent $2,550 LISTANZA
- 2025-12-12 Rental Removed $2,550 LISTANZA
- 2025-12-11 Listed for Rent $2,550 LISTANZA
- 2025-08-05 Rental Removed $2,700 MARMLS
- 2025-07-16 Listing Removed — MARMLS
- 2025-05-31 Price Changed $2,700 MARMLS
- 2025-05-21 Price Changed $2,900 MARMLS
- 2025-04-30 Listed for Rent $3,200 MARMLS
- 2025-04-30 Price Changed $725,000 MARMLS
- 2025-04-30 Relisted — MARMLS
- 2025-04-17 Rental Removed $3,200 MARMLS
- 2025-03-24 Price Changed $750,000 MARMLS
- 2025-03-18 Listed for Rent $3,200 MARMLS
- 2025-03-06 Listed $800,000 MARMLS
- 2021-04-14 Sold (Public Records) $375,000 Public Records
- 2020-08-19 Listing Removed — MARMLS
- 2020-08-04 Price Changed $399,000 MARMLS
- 2020-07-13 Listed $422,500 MARMLS
Property tax history
+12.0%/yrLatest (2025): $9,916 · +6.7% YoY. Source: county tax records.
Cash-flow waterfall
monthlySold comps — $/sqft
last 12 mo · ≤1 miLoading sold comps…