 Duplex
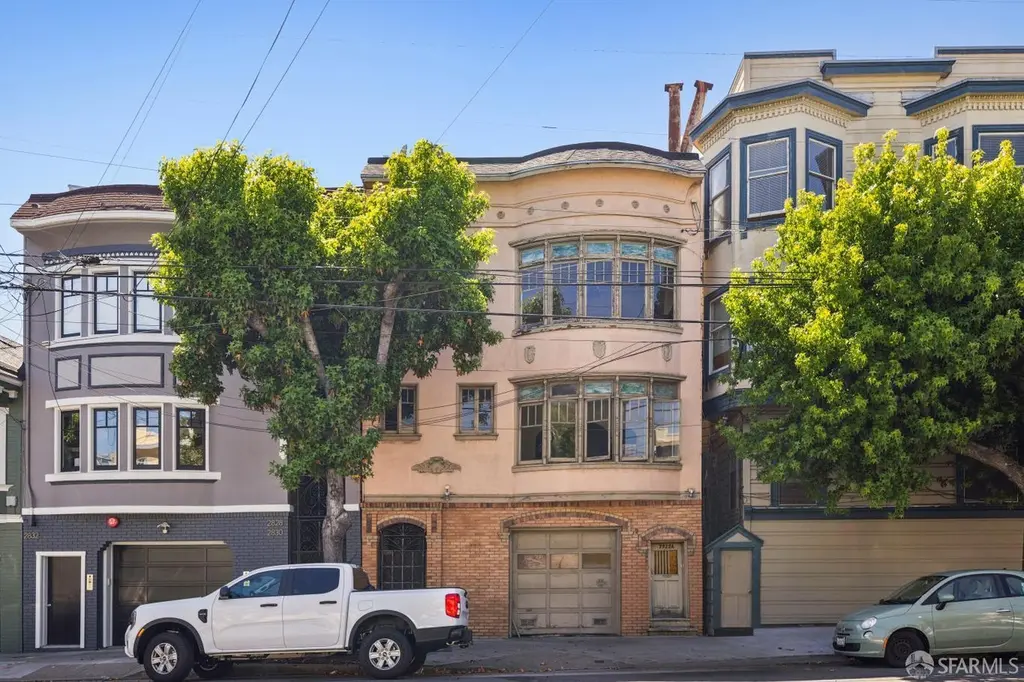
2822-2824 Bryant St · San Francisco, CA
Flood risk 1/10 · Minimal
- FEMA flood zone
- X (unshaded)
- Chance of flooding over 30 yrs
- 0.0%
- Est. flood insurance / yr
- $507 – $1,088
Fire risk 1/10 · Minimal
- Est. fire insurance / yr
- $659 – $1,223
Heat risk 2/10 · Minimal
- Hot days now (above 78°F)
- 8 days/yr
- Hot days in 30 yrs
- 18 days/yr
Wind risk 1/10 · Minimal
- Chance of severe wind over 30 yrs
- —
Air-quality risk 7/10 · Major
- Unhealthy air days now
- 13 days/yr
- Unhealthy air days in 30 yrs
- 13 days/yr
Risk factors via First Street. Map © Google.
Why this score? — see what drove the D+ grade
The composite is a weighted blend of 9 inputs, each scored 0–100. Each bar is that input's sub-score; the figure is the points it added to the 100-point composite (weight × sub-score).
- Cash flow +13.6/30.0
- ARV discount +13.2/15.0
- Rent growth +5.0/5.0
- Schools +5.0/10.0
- DSCR +4.1/10.0
- 1% rule +3.8/10.0
- Livability +3.8/5.0
- Condition / age +1.0/5.0
- Appreciation +0.0/10.0
$1,088,000
🖨 Deal sheet 📄 Offer letter ✓ Due diligence
Multi-family units
County records classify this as Multi-Family (2-4 Unit). Listing-text estimate: 2 units. confirmed
Listing remarks
An amazing opportunity to restore a substantial pair of flats in a highly sought after Inner Mission location. Showcasing classic period architecture, both full floor units have a formal entry, spacious living room with fireplace, adjacent built-in cabinets and elegant dining rooms with coved ceilings. This building has an additional ground floor studio, 2-car garage and is situated on a full size lot. The upper unit offers two bedrooms, one bath, and a sunroom with views of Bernal Heights, while the lower unit includes a generous sized bedroom, sunroom and a full bath. Each flat has a large kitchen which is adjacent to both a breakfast area with built-in cabinets and a utility room. The up
Key facts
- Formal entry
- Built-in cabinets
- Elegant dining rooms
Tags
Property features AI
Finance
- Other: Three total units (all currently vacant); Unit 1: Upper flat — 2 bed, 1 bath with sunroom; Unit 2: Flat — 1 bed, 1 bath with sunroom; Unit 3: Garden studio
- Financial info: Property listed as fixer (needs repairs/updates)
- HOA & community: No association fee
Exterior
- Parking: Attached parking with inside entrance; Two parking spaces total (includes 2 tandem spaces)
- Security: Security gate
- Utilities: Public water; Public sewer
- Home design: Residential income property — Triplex; Traditional-style building; Three or more levels; Built in 1926; Concrete perimeter foundation
- Construction: Stucco and wood construction; Shaped as a traditional triplex; Concrete perimeter foundation; Year built: 1926
- Exterior features: Balcony/deck; Fenced yard; Level topography; Regular-shaped lot
Interior
- Bedrooms: Four bedrooms total (unit breakdown: one upper 2-bedroom flat with sunroom; one 1-bedroom flat with sunroom; one garden studio)
- Flooring: Wood flooring; Tile flooring; Linoleum flooring
- Bathrooms: One full bathroom
- Heating & cooling: Central heating
- Interior features: Central heating; Washer/dryer hookups; Security gate
- Laundry & utility: Washer/dryer hookups
Neighborhood map
What this means for you Summary
Snapshot
- This is a 2 × 2-bed/0.5-bath units multifamily listed at $1.09M. Condition is rated poor.
Deal economics
- At list price, monthly cash flow is $60 ($715/yr) — positive. Per door: $30/mo.
- The deal already cash-flows at list — no discount required.
- To meet the 1% rule (rent ≥ 1% of price), the offer needs to be $959k (11.8% below list).
- Recommended offer: $959k (11.8% below list) — sets the bar for 1% rule.
- Cap rate 6.4% vs local median 2.1% in San Francisco — top-decile yield for the area; either an underpriced asset or a hidden risk that comps aren't pricing in. Stress-test before assuming the spread holds.
Location & tenants
- Location reads 76/100 on livability (#90 in CA, #3,143 nationally) — a middle-class / working-renter tenant base. Strengths: amenities A+, commute A+, employment A+; Watch: crime F, cost of living F.
- San Francisco Unified (urban): math 50% / reading 56% proficiency, ranked #322 of 1,400 in CA (top 23%) — acceptable for families but not a draw, mixed tenant base, ~2y average lease.
- Market conditions: Rents rising fast (+14.5%/yr); 161 active listings in the ZIP; 3 comparable units currently listed for rent nearby; rentals lingering (median 44d on market — plan ~5-8 weeks vacancy on turnover, expect pricing pressure); 67% of comp listings sitting > 30 days — soft ceiling on asking rent; high-income renter base; 750 units permitted in San Francisco County in 2024 (688 in 5+ unit buildings).
- At $9,593/mo this rent would consume 73% of the median local household income ($158k/yr) (locally 2732% of renters already pay >50% of income on rent) — very limited rent-growth headroom before tenants either downsize or default.
Forward outlook
- Local home prices are declining (-3.0%/yr); year-one equity from $8k of loan paydown is wiped out by about $33k of value loss. Plan a longer hold.
- San Francisco County population projected at +39% by 2050 — long-run rental-demand tailwind backs the buy-and-hold thesis.
Negotiation context
- It's been on market 34 days — a 3% lower offer ($1.06M) is reasonable based on typical stale-listing flexibility.
Risks & watch-outs
- Watch-outs: built in 1926 — expect roof / HVAC / electrical / plumbing capex.
Questions for the listing agent
- It's been on market 34 days. Have you received any prior offers? Is the seller open to a 12% concession, seller financing, or rate buy-down credit?
- Can we see the unit-by-unit rent roll, current vacancy, and any below-market leases? What's the average tenancy length?
- What capital expenditures (roof, boiler, parking lot, exteriors) have been made in the last 5 years, and what's planned in the next 2?
- Have any recent inspections been done? Can we get a copy of the seller's disclosures and any deferred-maintenance estimates?
- Built in 1926 — when were the roof, HVAC, electrical panel, plumbing, and water heater last replaced?
- Is there a deadline driving the sale (1031 exchange, divorce, estate, relocation)? That informs how much negotiation room exists.
- Schools are B-rated — typically a magnet for longer-tenancy family renters. What's the average tenant stay here, and is there a school-zone premium baked into asking?
- Crime grade is F in this area — have there been break-ins, vandalism, or insurance claims at this property in the last 3 years? What carrier currently insures it and at what premium?
- The area grade is low — what's the realistic commute time and amenity access for the typical tenant pool here? Any planned neighborhood developments (good or bad) we should know about?
- What's the average days-on-market for RENTAL listings here right now (not sales)? A rising rental-DOM trend means longer vacancies and softer asking-rent achievability than the comps imply.
- What's the recent tenant-quality profile in this submarket — average credit score on applications, eviction rate, late-payment / NSF rate, and stable-employment percentage? A property-management company in the area should have these aggregated.
- How much new apartment / multifamily construction is in the pipeline within 1–3 miles? Heavy new supply (>2% of stock underway) typically softens rents 12–24 months out; light construction supports rent growth.
Investment metrics
- 1% rule
- 0.88% ✗
- Cap rate
- 6.36%
- Cash-on-cash
- 0.23%
- DSCR
- 1.01
- GRM
- 9.5
CMA / ARV
- ARV (median comp)
- $1,246,183
- List price
- $1,088,000
- Delta
- -12.69%
- Verdict
- UNDERPRICED
- Comps
- 20 within 1.0 mi
Show comp detail 10 sales within ~0.75 mi
| Address | Dist | Beds/Ba | Sqft | Sold | Price | $/sf | Match |
|---|---|---|---|---|---|---|---|
| 1384-1386 Utah St | 0.28mi | 5/2.0 (+1) | 3,190 (-4%) | 9mo | $2,100,000 | $658 | 63 |
| 3300-02 Folsom St | 0.38mi | 5/3.0 (+1) | 2,992 (-10%) | 0mo | $2,210,000 | $739 | 52 |
| 881 Capp St | 0.50mi | 3/1.0 (-1) | 3,453 (+3%) | 19mo | $900,000 | $261 | 50 |
| 2977-2979 21st St | 0.61mi | 4/3.0 | 3,000 (-10%) | 1mo | $2,300,000 | $767 | 45 |
| 1153-1155 Florida St | 0.30mi | 5/4.0 (+1) | 3,006 (-10%) | 13mo | $3,000,000 | $998 | 42 |
| 152-154 Precita Ave | 0.45mi | 5/3.0 (+1) | 3,470 (+4%) | 24mo | $1,320,000 | $380 | 40 |
| 637 San Jose Ave | 0.75mi | 5/3.0 (+1) | 3,601 (+8%) | 0mo | $2,100,000 | $583 | 39 |
| 2237-2239 Bryant St | 0.65mi | 4/2.0 | 3,148 (-6%) | 21mo | $950,000 | $302 | 39 |
| 2737 22nd St | 0.46mi | 4/2.5 | 2,875 (-14%) | 16mo | $1,420,000 | $494 | 36 |
| 1902-1904 23rd St | 0.68mi | 5/4.0 (+1) | 3,357 (+1%) | 19mo | $1,329,750 | $396 | 34 |
Match score weights: distance 35% · size 25% · config 20% · recency 20%. Top-matched comps best support the ARV.
Projected returns pro-forma
-3.0% appreciation · 8.0% rent growth · sell at horizon
- IRR
- -10.5%
- Equity multiple
- 0.60×
- Total profit
- $-121,669
- Equity at exit
- $162,224
- IRR
- 4.8%
- Equity multiple
- 1.43×
- Total profit
- $130,267
- Equity at exit
- $94,070
Cash invested: $304,640 (down + closing). Projections, not guarantees.
Landlord ↔ Tenant lean methodology
- Overall (CITY)
- 0 Strongly Tenant-Friendly
- State California
- 18 Strongly Tenant-Friendly · D+13
- County
- — inherits STATE
- City San Francisco
- 0 Strongly Tenant-Friendly · D+57
ZIP-level market 94110
- Rents YoY
- 14.5%
- Active inventory
- 161
- Price-to-rent
- 18.9×
Monthly cashflow live
- Estimated rent
- $9,593 medium interval (Pro) →
- Mortgage (P&I)
- −$5,706
- Tax est. 1.5%
- −$1,360 /mo · $16,320/yr
- Insurance
- −$453
- HOA
- −$0
- Vacancy / Maint / Mgmt
- −$2,015
- Net cashflow
- $60
Break-even live
2-unit breakdown (identical units grouped — click to expand)
| Units | Beds | Baths | Est. rent |
|---|---|---|---|
| 2× units | 2 | 0.5 | $9,592 |
| #1 | 2 | 0.5 | $4,796 |
| #2 | 2 | 0.5 | $4,796 |
| Total (2 units) | $9,593 | ||
UW: 25.0% down · 7.5% · 30yr · 1.5% tax · 5.0% vac · 8.0% maint · 8.0% mgmt
Financing live
Cash to close
- Down payment
- $272,000
- Closing costs
- $32,640
- Reserves months
- —
- Total cash needed
- —
Loan-product check · same deal, 3 products live
Conventional
25% down · 7.5% · 30yr
- Down + closing
- —
- Monthly P&I
- —
- Monthly cashflow
- —
- DSCR
- —
- Eligible?
- —
Personal DTI + credit; lowest rate.
DSCR
20% down · 8.5% · 30yr
- Down + closing
- —
- Monthly P&I
- —
- Monthly cashflow
- —
- DSCR
- —
- Eligible?
- —
No personal income docs; deal must DSCR.
Hard money
10% down · 12.0% · 12mo
- Down + closing
- —
- Monthly P&I
- —
- Monthly cashflow
- —
- DSCR
- —
- Eligible?
- —
Short-term bridge; refi at stabilization.
Rent comps 3 comps
| Address | Beds | Baths | Sqft | Rent | $/sqft | DOM | Units | Dist |
|---|---|---|---|---|---|---|---|---|
| 1076 S Van Ness Ave San Francisco, CA | 4.0 | 3.5 | 3776 | $19,950 | $5.28 | 3d | 1 | 0.65mi |
| 1059 Noe St San Francisco, CA | 3.0 | 2.5 | 2545 | $14,000 | $5.50 | 44d | 1 | 1.26mi |
| 753 Castro St San Francisco, CA | 4.0 | 3.0 | 2467 | $10,950 | $4.44 | 44d | 1 | 1.49mi |
Listing history 16 events
-
2026-06-18status $1,088,000 Pending 34 DOM
-
2026-06-18days on market $1,088,000 Contingent - No Show 34 DOM
-
2026-06-17days on market $1,088,000 Contingent - No Show 33 DOM
-
2026-06-16days on market $1,088,000 Contingent - No Show 32 DOM
-
2026-06-15days on market $1,088,000 Contingent - No Show 31 DOM
-
2026-06-13days on market $1,088,000 Contingent - No Show 29 DOM
-
2026-06-13days on market $1,088,000 Contingent - No Show 28 DOM
-
2026-06-09days on market $1,088,000 Contingent - No Show 25 DOM
-
2026-06-08days on market $1,088,000 Contingent - No Show 24 DOM
-
2026-06-07days on market $1,088,000 Contingent - No Show 23 DOM
-
2026-06-04days on market $1,088,000 Contingent - No Show 20 DOM
-
2026-06-03days on market $1,088,000 Contingent - No Show 19 DOM
-
2026-06-02days on market $1,088,000 Contingent - No Show 18 DOM
-
2026-06-01days on market $1,088,000 Contingent - No Show 17 DOM
-
2026-05-31statusdays on market $1,088,000 Contingent - No Show 16 DOM
-
2026-05-15$1,088,000 Active 997-char remark
ⓘ Source: listings_history table (triggers on properties + properties_extension) + one-shot
backfill from property_details.listing_events for pre-trigger history.
Climate risk First Street
- Flood 1/10 Low FEMA zone X (unshaded) · 0% chance over 30 yrs
- Wildfire 1/10 Low
- Heat 2/10 Low 8 d/yr ≥78°F today · 18 d/yr by 30 yrs out
- Wind 1/10 Low
- Air quality 7/10 Severe 13 unhealthy d/yr today · 13 by 30 yrs out
Nearby sold comps map
Loading sold comps map…
Walkable amenities ~0.75 mi
Loading nearby amenities…
Taxation est. · year 1
- Rental income
- $115,116
- − Mortgage interest
- −$60,945
- − Property taxes
- −$16,320
- − Insurance
- −$5,440
- − Repairs & maintenance
- −$9,209
- − Management
- −$9,209
- − Depreciation
- −$31,651
- Taxable loss
- −$17,658
- Est. tax savings @ 24.0%
- +$4,238
- After-tax cash flow
- $4,953/yr
For passive investors: Depreciation is non-cash, so a rental often shows a tax loss while cash-flowing — sheltering income. Rental losses are passive: they offset passive income freely, and up to $25,000/yr can offset ordinary (W-2) income if you actively participate and your MAGI is under $100k (phasing out to $0 by $150k); unused losses carry forward. On sale, claimed depreciation is recaptured at up to 25%, and gains may owe capital-gains tax (a 1031 exchange can defer both). Figures are a year-1 estimate at your 24.0% rate — not tax advice; consult a CPA.
Condition & rehab AI · 30 photos
This property requires extensive renovations, including kitchen and bathroom updates, exterior siding repair, and interior wall repainting. The home's poor condition and outdated features significantly impact its value, making it a substantial project for an investor.
Repairs flagged
- Major kitchen cabinets — severely outdated and in poor condition
- Major bathroom cabinets — severely outdated and in poor condition
- Major exterior siding — appears aged and in need of repair
- Major hardwood floors — in need of refinishing
- Major interior walls — paint peeling and walls in need of repainting
Value-add opportunities
- Both kitchen renovation — modernizing the kitchen will increase both resale and rental value
- Both bathroom renovation — modernizing the bathroom will increase both resale and rental value
- Both exterior siding repair — repairing the siding will improve curb appeal and increase both resale and rental value
- Both hardwood floor refinishing — refinishing the hardwood floors will improve the home's appearance and increase both resale and rental value
- Both interior wall repainting — repainting the interior walls will improve the home's appearance and increase both resale and rental value
Renovation cost estimate screening
| Repair item | Severity | Est. cost |
|---|---|---|
| kitchen cabinets · severely outdated and in poor condition | Major | $15,000–50,000 |
| bathroom cabinets · severely outdated and in poor condition | Major | $15,000–50,000 |
| exterior siding · appears aged and in need of repair | Major | $15,000–50,000 |
| hardwood floors · in need of refinishing | Major | $15,000–50,000 |
| interior walls · paint peeling and walls in need of repainting | Major | $15,000–50,000 |
| Total estimated repair cost · 5 items | $75,000–250,000 |
Value-add ROI direction
- Both kitchen renovation — modernizing the kitchen will increase both resale and rental value ↑
- Both bathroom renovation — modernizing the bathroom will increase both resale and rental value ↑
- Both exterior siding repair — repairing the siding will improve curb appeal and increase both resale and rental value ↑
- Both hardwood floor refinishing — refinishing the hardwood floors will improve the home's appearance and increase both resale and rental value ↑
- Both interior wall repainting — repainting the interior walls will improve the home's appearance and increase both resale and rental value ↑
ⓘ Cost ranges are severity-bucket heuristics (US national rule-of-thumb). Get contractor quotes + a written scope before underwriting a rehab budget.
Schools (NCES district)
- District
- San Francisco Unified
- NCES district ID
- 0634410
- Math proficiency
- 50% ▬ 0.00%
- Reading proficiency
- 56% ▲ 1.00%
- Median HH income
- $81,249
- Composite
- 50.14/100
- National rank
- #4088
- State rank
- #322 of 1400 in CA
Livability — San Francisco
- Score
- 76/100
- State rank
- #90
- US rank
- #3143
Category grades
Schools grade is shown separately in the Schools card above.
Census & demographics
- Census place
- San Francisco, CA
- County
- San Francisco County · 827,552 people
- City population
- 827,552
- Metro
- San Francisco-Oakland-Berkeley, CA
- Population (ZIP)
- 66,865
- Household income
- $158,351
- Rent vs Own
- Severe rent burden
- 2732.0
Population outlook (San Francisco County) Hauer SSP2
- Today (2025)
- 1,030,936 people
- By 2030
- 1,110,409 · +7.7%
- By 2040
- 1,270,010 · +23.2%
- By 2050
- 1,435,001 · +39.2%
- By 2075
- 1,779,074 · +72.6%
- By 2100
- 1,966,767 · +90.8%
Race, ethnicity, and origin ACS 2023
- Neighborhood character
- Highly diverse neighborhood (Simpson 0.70)
- Race & ethnicity
- White 41% Hispanic / Latino 32% Asian 16% Two or more races 15% Black 4% Native American 1%
- Hispanic origin (detail)
- Mexican 16% Puerto Rican 1%
- Common ancestry
- Lithuanian 3% Italian 2% Romanian 2%
- Foreign-born
- 28% · Canada, China, Vietnam
- Languages at home
- 58% English-only · Spanish 27% Chinese 5% Other Indo-European 2%
Political lean MEDSL · San Francisco
- 2024 margin
- Solid D (+64.8) · D 80.3% · R 15.5% · Other 4.1%
- 2008→2024 swing
- -5.7pp toward R · 2008: 70.5pp · 2024: 64.8pp
- All cycles
- 2024: D+64.8 2020: D+72.5 2016: D+76.1 2012: D+70.2 2008: D+70.5
Not yet ingested
- Civics
- —
Market trends
- HPI YoY
- ▼ -1385.62%
- Current HPI
- 267.2424
- Rent YoY
- ▲ 14.54%
- Metro
- San Francisco-Oakland-Berkeley, CA
- State GDP YoY
- ▲ 3.21%
- F500 in state
- 116
Industry mix (Fortune 500 HQ in CA)
| Industry | F500 HQs | Revenue |
|---|---|---|
| Technology | 27 | $1,492B |
|
||
| Financial Services | 3 | $174B |
|
||
| Retail | 3 | $44B |
|
||
| Insurance | 3 | $26B |
|
||
| Media / Entertainment | 2 | $115B |
|
||
| Pharmaceuticals / Biotech | 2 | $62B |
|
||
Price history
2 events — show timeline
- 2026-05-30 Contingent — San Francisco MLS
- 2026-05-15 Listed $1,088,000 San Francisco MLS
Cash-flow waterfall
monthlySold comps — $/sqft
last 12 mo · ≤1 miLoading sold comps…