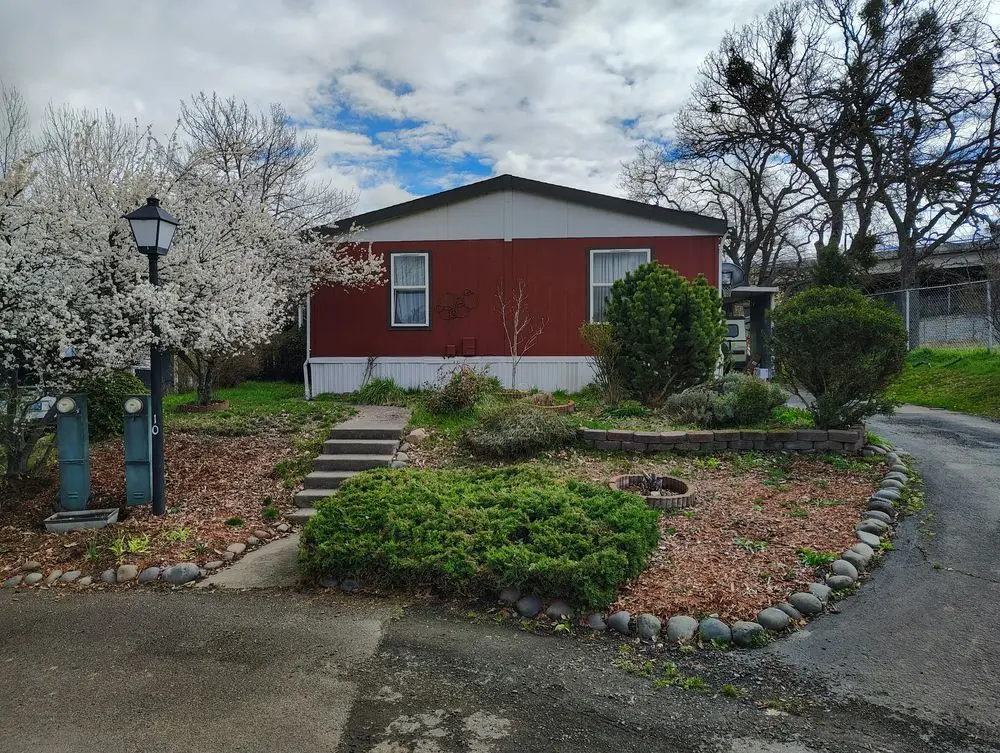
321 Clay St · Ashland, OR
Flood risk 1/10 · Minimal
- FEMA flood zone
- X (shaded)
- Chance of flooding over 30 yrs
- 0.0%
- Est. flood insurance / yr
- $507 – $1,088
Fire risk 7/10 · Major
- Est. fire insurance / yr
- $498 – $926
Heat risk 5/10 · Moderate
- Hot days now (above 94°F)
- 7 days/yr
- Hot days in 30 yrs
- 14 days/yr
Wind risk 1/10 · Minimal
- Chance of severe wind over 30 yrs
- —
Air-quality risk 10/10 · Severe
- Unhealthy air days now
- 33 days/yr
- Unhealthy air days in 30 yrs
- 34 days/yr
Risk factors via First Street. Map © Google.
Why this score? — see what drove the D grade
The composite is a weighted blend of 9 inputs, each scored 0–100. Each bar is that input's sub-score; the figure is the points it added to the 100-point composite (weight × sub-score).
- Cash flow +13.1/30.0
- ARV discount +7.5/15.0
- Schools +5.7/10.0
- Livability +4.2/5.0
- DSCR +3.9/10.0
- 1% rule +3.7/10.0
- Rent growth +2.9/5.0
- Condition / age +2.5/5.0
- Appreciation +0.0/10.0
$225,000
🖨 Deal sheet 📄 Offer letter ✓ Due diligence
Listing remarks
Beautiful manufactured home in an all ages park with three ponds and abundant wildlife. This home only has a neighbor on one side so the other side is open to the mountains and the city of Ashland. A small stream to bear creek runs behind the house just beyond the fenced in yard. The house sits up higher than those around it and has a nice carport and porch. Redwood stairs are on either door to the front or back of the home. The current owner is a mosaic artist and has built a patio for the hot tub from various large pieces left over from her works in Ashland. There is a small shed that matches the house, an old greenhouse and a side work/studio space under the carport side. A variety of pl
Key facts
- Three ponds
- Abundant wildlife
- Carport
Tags
Neighborhood map
What this means for you Summary
Snapshot
- This is a 3-bed/2.0-bath other listed at $225k.
Deal economics
- At list price, monthly cash flow is $-7 ($-78/yr) — negative.
- To cash-flow at today's rent, offer at most $224k (0.4% below list).
- To meet the 1% rule (rent ≥ 1% of price), the offer needs to be $196k (12.9% below list).
- Recommended offer: $196k (12.9% below list) — sets the bar for 1% rule.
- Cap rate 6.3% vs local median 2.1% in Ashland — top-decile yield for the area; either an underpriced asset or a hidden risk that comps aren't pricing in. Stress-test before assuming the spread holds.
Location & tenants
- Location reads 83/100 on livability (#42 in OR, #1,019 nationally) — a professional / high-income tenant draw. Strengths: amenities A+, commute A+, health & safety A+; Watch: cost of living F.
- Ashland SD 5 (suburban): math 59% / reading 73% proficiency, ranked #5 of 183 in OR (top 3%) — acceptable for families but not a draw, mixed tenant base, ~2y average lease.
- Market conditions: Rents rising (+1.7%/yr); 365 active listings in the ZIP; 25 comparable units currently listed for rent nearby; rentals at typical pace (median 21d on market — plan ~3-4 weeks tenant-placement turnaround); 904 units permitted in Jackson County in 2024 (212 in 5+ unit buildings).
- This rent runs 35% of the median local income ($68k/yr) — at the standard rent-burdened threshold; future hikes will face affordability resistance.
Forward outlook
- Local home prices are declining (-3.0%/yr); year-one equity from $2k of loan paydown is wiped out by about $7k of value loss. Plan a longer hold.
- Jackson County population projected at +17% by 2050 — long-run rental-demand tailwind backs the buy-and-hold thesis.
Negotiation context
- It's been on market 15 days — a 2% lower offer ($222k) is reasonable based on typical stale-listing flexibility.
- 32 sale attempts since 30y ago with the ask held roughly flat each time — persistent listings suggest the price (not the market) is what's stuck; bring a comps-based counter.
- Current owner paid $20k; list at $225k implies a 1054% gain — meaningful room to come down on a strong offer.
Risks & watch-outs
- Climate carrying-cost: major wildfire risk; extreme-heat days projected 7→14/yr by 2055 (HVAC capex compounding) — expect insurance premiums to compound above CPI over the hold.
Questions for the listing agent
- What do current leases actually rent for vs. the listed asking? Can we see a recent rent roll and the last 12 months of T-12 income?
- Is there a deadline driving the sale (1031 exchange, divorce, estate, relocation)? That informs how much negotiation room exists.
- Schools are A-rated — typically a magnet for longer-tenancy family renters. What's the average tenant stay here, and is there a school-zone premium baked into asking?
- The area grade is low — what's the realistic commute time and amenity access for the typical tenant pool here? Any planned neighborhood developments (good or bad) we should know about?
- What's the average days-on-market for RENTAL listings here right now (not sales)? A rising rental-DOM trend means longer vacancies and softer asking-rent achievability than the comps imply.
- What's the recent tenant-quality profile in this submarket — average credit score on applications, eviction rate, late-payment / NSF rate, and stable-employment percentage? A property-management company in the area should have these aggregated.
- How much new for-sale + rental construction is in the pipeline within 1–3 miles? Heavy new supply typically softens prices + rents 12–24 months out; constrained supply supports both.
Investment metrics
- 1% rule
- 0.87% ✗
- Cap rate
- 6.26%
- Cash-on-cash
- -0.12%
- DSCR
- 0.99
- GRM
- 9.6
CMA / ARV
No comps found within radius.
Projected returns pro-forma
-3.0% appreciation · 1.69% rent growth · sell at horizon
- IRR
- -18.0%
- Equity multiple
- 0.37×
- Total profit
- $-39,395
- Equity at exit
- $33,548
- IRR
- -12.9%
- Equity multiple
- 0.29×
- Total profit
- $-44,911
- Equity at exit
- $19,454
Cash invested: $63,000 (down + closing). Projections, not guarantees.
Landlord ↔ Tenant lean methodology
- Overall (STATE)
- 28 Tenant-Leaning
- State Oregon
- 28 Tenant-Leaning · D+6
- County
- — inherits STATE
- City
- — inherits STATE
ZIP-level market 97520
- Rents YoY
- 1.7%
- Active inventory
- 365
- Price-to-rent
- 9.6×
Monthly cashflow live
- Estimated rent
- $1,960 high interval (Pro) →
- Mortgage (P&I)
- −$1,180
- Tax est. 1.5%
- −$281 /mo · $3,375/yr
- Insurance
- −$94
- HOA
- −$0
- Vacancy / Maint / Mgmt
- −$412
- Net cashflow
- $-7
Break-even live
UW: 25.0% down · 7.5% · 30yr · 1.5% tax · 5.0% vac · 8.0% maint · 8.0% mgmt
Financing live
Cash to close
- Down payment
- $56,250
- Closing costs
- $6,750
- Reserves months
- —
- Total cash needed
- —
Loan-product check · same deal, 3 products live
Conventional
25% down · 7.5% · 30yr
- Down + closing
- —
- Monthly P&I
- —
- Monthly cashflow
- —
- DSCR
- —
- Eligible?
- —
Personal DTI + credit; lowest rate.
DSCR
20% down · 8.5% · 30yr
- Down + closing
- —
- Monthly P&I
- —
- Monthly cashflow
- —
- DSCR
- —
- Eligible?
- —
No personal income docs; deal must DSCR.
Hard money
10% down · 12.0% · 12mo
- Down + closing
- —
- Monthly P&I
- —
- Monthly cashflow
- —
- DSCR
- —
- Eligible?
- —
Short-term bridge; refi at stabilization.
Rent comps 25 comps
| Address | Beds | Baths | Sqft | Rent | $/sqft | DOM | Units | Dist |
|---|---|---|---|---|---|---|---|---|
| 2221 Dollarhide Way Ashland, OR | 3.0 | 2.5 | 1666 | $2,350 | $1.41 | 20d | 1 | 0.20mi |
| 295 Tolman Creek Rd Ashland, OR | 2.0 | 2.0 | 988 | $1,995 | $2.02 | 13d | 1 | 0.32mi |
| 635 Park St Ashland, OR | 2.0 | 1.0 | — | $1,595 | — | 20d | 1 | 0.35mi |
| 639 Park St Unit 641 Ashland, OR | 2.0 | 1.0 | — | $1,595 | — | 20d | 1 | 0.35mi |
| 641 Park St Ashland, OR | 2.0 | 1.0 | — | $1,595 | — | 20d | 1 | 0.36mi |
| 649 Park St Ashland, OR | 3.0 | 1.0 | — | $1,750 | — | 43d | 1 | 0.37mi |
| 647 Park St Unit 649 Ashland, OR | 3.0 | 1.0 | — | $1,750 | — | 43d | 1 | 0.37mi |
| 45 Crocker St Ashland, OR | 3.0 | 2.5 | 1608 | $2,350 | $1.46 | 43d | 1 | 0.37mi |
| 706 Normal Ave Ashland, OR | 2.0 | 1.0 | 1250 | $2,500 | $2.00 | 43d | 1 | 0.45mi |
| 706 Normal Ave Ashland, OR | 2.0 | 1.0 | 1250 | $2,500 | $2.00 | 13d | 1 | 0.45mi |
| 732 Normal Ave Unit 732 Ashland, OR | 2.0 | 2.5 | 1111 | $1,895 | $1.71 | 13d | 1 | 0.46mi |
| 791 Faith Ave Ashland, OR | 3.0 | 2.0 | 1420 | $2,600 | $1.83 | 20d | 1 | 0.49mi |
| 826 Park St Unit 826 Ashland, OR | 2.0 | 2.5 | 1234 | $1,995 | $1.62 | 20d | 1 | 0.55mi |
| 2976 Grizzly Dr Ashland, OR | 3.0 | 2.0 | 1354 | $2,350 | $1.74 | 20d | 1 | 0.57mi |
| 2080 Siskiyou Blvd Ashland, OR | 2.0 | 1.0 | 882 | $1,500 | $1.70 | 20d | 1 | 0.66mi |
| 2555 Spring Hill Dr Ashland, OR | 3.0 | 2.0 | 1555 | $2,300 | $1.48 | 43d | 1 | 0.76mi |
| 2370 Siskiyou Blvd Ashland, OR | 2.0 | 2.5 | 1252 | $1,995 | $1.59 | 13d | 1 | 0.85mi |
| 77 California St Unit 5 Ashland, OR | 2.0 | 1.0 | 1025 | $1,150 | $1.12 | 43d | 1 | 0.93mi |
| 93 California St Ashland, OR | 3.0 | 1.0 | 1132 | $2,095 | $1.85 | 20d | 1 | 0.94mi |
| 593 Oak Knoll Dr Ashland, OR | 3.0 | 2.0 | 1608 | $2,600 | $1.62 | 13d | 1 | 0.94mi |
| 102 Garfield St Apt 20 Ashland, OR | 2.0 | 1.0 | 828 | $1,150 | $1.39 | 43d | 1 | 0.96mi |
| 139 N Wightman St Ashland, OR | 2.0 | 2.0 | 1214 | $2,250 | $1.85 | 43d | 1 | 0.98mi |
| 854 Twin Pines Cir #12 Ashland, OR | 2.0 | 1.0 | 896 | $1,700 | $1.90 | 13d | 1 | 1.07mi |
| 171 Alida St Unit 1712 Ashland, OR | 2.0 | 1.0 | — | $1,595 | — | 43d | 1 | 1.29mi |
| 671 Siskiyou Blvd Ashland, OR | 2.0 | 2.0 | — | $3,750 | — | 13d | 1 | 1.40mi |
Listing history 13 events
-
2026-06-19days on market $225,000 Active 15 DOM
-
2026-06-18days on market $225,000 Active 14 DOM
-
2026-06-17days on market $225,000 Active 13 DOM
-
2026-06-16days on market $225,000 Active 12 DOM
-
2026-06-15days on market $225,000 Active 11 DOM
-
2026-06-14days on market $225,000 Active 9 DOM
-
2026-06-13days on market $225,000 Active 8 DOM
-
2026-06-10days on market $225,000 Active 6 DOM
-
2026-06-09days on market $225,000 Active 5 DOM
-
2026-06-08days on market $225,000 Active 4 DOM
-
2026-06-07days on market $225,000 Active 3 DOM
-
2026-06-05remarks 699-char remark
-
2026-06-05$225,000 Active 1 DOM
ⓘ Source: listings_history table (triggers on properties + properties_extension) + one-shot
backfill from property_details.listing_events for pre-trigger history.
Climate risk First Street
- Flood 1/10 Low FEMA zone X (shaded) · 0% chance over 30 yrs
- Wildfire 7/10 Severe
- Heat 5/10 Major 7 d/yr ≥94°F today · 14 d/yr by 30 yrs out
- Wind 1/10 Low
- Air quality 10/10 Extreme 33 unhealthy d/yr today · 34 by 30 yrs out
Nearby sold comps map
Loading sold comps map…
Walkable amenities ~0.75 mi
Loading nearby amenities…
Taxation est. · year 1
- Rental income
- $23,520
- − Mortgage interest
- −$12,603
- − Property taxes
- −$3,375
- − Insurance
- −$1,125
- − Repairs & maintenance
- −$1,882
- − Management
- −$1,882
- − Depreciation
- −$6,545
- Taxable loss
- −$3,892
- Est. tax savings @ 24.0%
- +$934
- After-tax cash flow
- $856/yr
For passive investors: Depreciation is non-cash, so a rental often shows a tax loss while cash-flowing — sheltering income. Rental losses are passive: they offset passive income freely, and up to $25,000/yr can offset ordinary (W-2) income if you actively participate and your MAGI is under $100k (phasing out to $0 by $150k); unused losses carry forward. On sale, claimed depreciation is recaptured at up to 25%, and gains may owe capital-gains tax (a 1031 exchange can defer both). Figures are a year-1 estimate at your 24.0% rate — not tax advice; consult a CPA.
Schools (NCES district)
- District
- Ashland SD 5
- NCES district ID
- 4101560
- Math proficiency
- 59% ▼ -2.00%
- Reading proficiency
- 73% ▬ 0.00%
- Median HH income
- $45,917
- Composite
- 57.0/100
- National rank
- #2358
- State rank
- #5 of 183 in OR
Livability — Ashland
- Score
- 83/100
- State rank
- #42
- US rank
- #1019
Category grades
Schools grade is shown separately in the Schools card above.
Census & demographics
- Census place
- Ashland, OR
- County
- Jackson County · 159,661 people
- City population
- 26,512
- Metro
- Medford, OR
- Population (ZIP)
- 26,512
- Household income
- $67,948
- Rent vs Own
- Severe rent burden
- 1727.0
Population outlook (Jackson County) Hauer SSP2
- Today (2025)
- 234,433 people
- By 2030
- 243,834 · +4.0%
- By 2040
- 259,717 · +10.8%
- By 2050
- 273,269 · +16.6%
- By 2075
- 300,624 · +28.2%
- By 2100
- 305,256 · +30.2%
Race, ethnicity, and origin ACS 2023
- Neighborhood character
- Predominantly White (82%)
- Race & ethnicity
- White 82% Two or more races 9% Hispanic / Latino 9% Asian 2%
- Hispanic origin (detail)
- Mexican 4%
- Common ancestry
- Italian 5% Lithuanian 5% Portuguese 4%
- Foreign-born
- 7% · Canada, China, Guatemala
- Languages at home
- 92% English-only · Spanish 4% Other Asian/Pacific 1% German/W. Germanic 1%
Political lean MEDSL · Jackson
- 2024 margin
- Lean R (+6.4) · D 45.5% · R 51.9% · Other 2.6%
- 2008→2024 swing
- -6.5pp toward R · 2008: 0.1pp · 2024: -6.4pp
- All cycles
- 2024: R+6.4 2020: R+3.5 2016: R+9.2 2012: R+5.0 2008: D+0.1
Not yet ingested
- Civics
- —
Market trends
- HPI YoY
- ▼ -555.69%
- Current HPI
- 231.9587
- Rent YoY
- ▲ 1.69%
- Metro
- Medford, OR
- State GDP YoY
- ▲ 2.05%
- F500 in state
- 2
Industry mix (Fortune 500 HQ in OR)
| Industry | F500 HQs | Revenue |
|---|---|---|
| Consumer Goods | 1 | $51B |
|
||
Price history
+690.9% since first listed65 events — show timeline
- 2026-06-04 Listed $225,000 ForSaleByOwner.com
- 2020-04-26 Listing Removed — MLSCO
- 2020-04-26 Listing Removed — MLSCO
- 2020-04-25 Listing Removed — MLSCO
- 2020-04-25 Listing Removed — MLSCO
- 2020-04-25 Listing Removed — MLSCO
- 2020-04-25 Listing Removed — MLSCO
- 2020-04-25 Listing Removed — MLSCO
- 2020-04-25 Listing Removed — MLSCO
- 2020-04-25 Listing Removed — MLSCO
- 2020-04-25 Listing Removed — MLSCO
- 2020-04-25 Listing Removed — MLSCO
- 2020-04-25 Listing Removed — MLSCO
- 2020-04-25 Listing Removed — MLSCO
- 2020-04-25 Listing Removed — MLSCO
- 2020-04-25 Listing Removed — MLSCO
- 2020-04-25 Listing Removed — MLSCO
- 2020-04-25 Listing Removed — MLSCO
- 2020-04-25 Listing Removed — MLSCO
- 2002-07-30 Listed $70,000 MLSCO
- 2002-05-16 Sold (MLS) $19,500 MLSCO
- 2002-04-02 Listed $64,900 MLSCO
- 2001-12-26 Sold (MLS) $37,505 MLSCO
- 2001-12-20 Sold (MLS) $25,000 MLSCO
- 2001-12-13 Listed $19,900 MLSCO
- 2001-12-13 Listed $19,900 MLSCO
- 2001-10-04 Listed $25,000 MLSCO
- 2001-08-02 Sold (MLS) $22,500 MLSCO
- 2001-08-02 Sold (MLS) $22,500 MLSCO
- 2001-07-16 Listed $22,500 MLSCO
- 2001-06-19 Listed $22,500 MLSCO
- 2001-06-15 Listed $59,900 MLSCO
- 2001-06-15 Listed $15,000 MLSCO
- 2001-05-15 Listed $39,500 MLSCO
- 2001-04-29 Listed $48,000 MLSCO
- 2000-03-08 Listed $61,900 MLSCO
- 1999-07-28 Sold (MLS) $63,000 MLSCO
- 1999-04-23 Sold (MLS) $24,000 MLSCO
- 1999-04-16 Listed $53,000 MLSCO
- 1999-04-09 Listed $68,000 MLSCO
- 1999-03-17 Listed $24,900 MLSCO
- 1999-01-08 Sold (MLS) $37,000 MLSCO
- 1998-12-18 Listed $37,500 MLSCO
- 1998-10-15 Listed $30,000 MLSCO
- 1998-10-09 Listed $17,500 MLSCO
- 1998-10-08 Sold (MLS) $16,500 MLSCO
- 1998-08-03 Sold (MLS) $22,500 MLSCO
- 1998-07-15 Listed $22,900 MLSCO
- 1998-06-17 Listed $12,500 MLSCO
- 1998-05-29 Listed $19,500 MLSCO
- 1998-03-05 Sold (MLS) $18,500 MLSCO
- 1998-02-25 Listed $20,500 MLSCO
- 1998-01-30 Listed $45,000 MLSCO
- 1998-01-16 Listed $22,900 MLSCO
- 1997-11-26 Listed $18,500 MLSCO
- 1997-09-22 Listed $59,900 MLSCO
- 1997-07-03 Sold (MLS) $42,000 MLSCO
- 1997-06-13 Listed $43,500 MLSCO
- 1997-05-29 Sold (MLS) $14,800 MLSCO
- 1997-05-20 Listed $18,000 MLSCO
- 1997-03-14 Sold (MLS) $14,000 MLSCO
- 1997-02-13 Listed $14,000 MLSCO
- 1996-11-02 Listed $15,000 MLSCO
- 1996-10-12 Listed $23,900 MLSCO
- 1996-10-08 Sold (MLS) $28,450 MLSCO
Property tax history
+2.5%/yrLatest (2025): $44,908 · +2.1% YoY. Source: county tax records.
Cash-flow waterfall
monthlySold comps — $/sqft
last 12 mo · ≤1 miLoading sold comps…