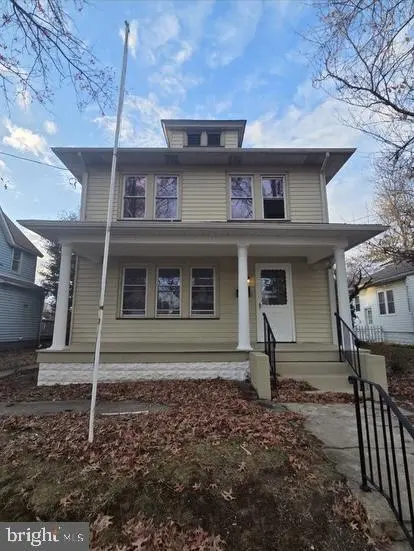
33 Johnson St · Salem, NJ
Flood risk 4/10 · Minor
- FEMA flood zone
- X (unshaded)
- Chance of flooding over 30 yrs
- 0.13%
- Est. flood insurance / yr
- $507 – $1,088
Fire risk 1/10 · Minimal
- Est. fire insurance / yr
- $526 – $976
Heat risk 8/10 · Major
- Hot days now (above 103°F)
- 7 days/yr
- Hot days in 30 yrs
- 15 days/yr
Wind risk 6/10 · Moderate
- Chance of severe wind over 30 yrs
- 27.0%
Air-quality risk 3/10 · Minor
- Unhealthy air days now
- 2 days/yr
- Unhealthy air days in 30 yrs
- 4 days/yr
Risk factors via First Street. Map © Google.
Why this score? — see what drove the D- grade
The composite is a weighted blend of 9 inputs, each scored 0–100. Each bar is that input's sub-score; the figure is the points it added to the 100-point composite (weight × sub-score).
- Cash flow +12.2/30.0
- Appreciation +4.8/10.0
- 1% rule +4.2/10.0
- DSCR +3.6/10.0
- Livability +3.1/5.0
- ARV discount +2.6/15.0
- Rent growth +2.5/5.0
- Condition / age +2.5/5.0
- Schools +1.2/10.0
$259,000
🖨 Deal sheet 📄 Offer letter ✓ Due diligence
Listing remarks
Come check out this gorgeous property in Salem, NJ. The property offer a big spacious living room, dining room and updated kitchen. As you head upstairs 3 generous sized bedrooms and renovated bathroom. A nice deck in the back of the property, and big backyard, as well as a 2 door garage with plenty of parking space. Schedule your appointment today, easy to show.
Key facts
- 6,499 sq ft lot
- 4 garage spots
- Built 1935
Property features AI
Finance
- Other: Fee simple ownership
Exterior
- Parking: Rear-entry attached garage with 4 spaces; Driveway
- Utilities: Public water; Public sewer; Natural gas service
- Home design: Detached property; Vinyl siding exterior; Brick/mortar foundation
- Construction: Vinyl siding construction; Brick/mortar foundation
- Exterior features: 50 x 130 lot; No tidal water
Interior
- Bedrooms: Four bedrooms on the upper level
- Bathrooms: One full bathroom on upper level; One half bathroom on main level
- Heating & cooling: Forced air heating (natural gas); Central air conditioning (natural gas); Natural gas hot water
- Interior features: Full basement
Neighborhood map
What this means for you Summary
Snapshot
- This is a 4-bed/1.5-bath single-family listed at $259k.
Deal economics
- At list price, monthly cash flow is $-54 ($-648/yr) — negative.
- To cash-flow at today's rent, offer at most $249k (3.7% below list).
- To meet the 1% rule (rent ≥ 1% of price), the offer needs to be $237k (8.5% below list).
- Recommended offer: $236k (9.0% below list) — sets the bar for market timing.
- Cap rate 6.0% vs local median 8.4% in Salem — below-typical yield; the buyer is paying a premium for something (appreciation thesis, condition, location) that the cap rate doesn't capture.
Location & tenants
- Location reads 61/100 on livability (#462 in NJ) — a middle-class / working-renter tenant base. Strengths: cost of living A+, health & safety A+, crime B; Watch: schools D, amenities F, commute F.
- Salem City School District (town): math 6% / reading 24% proficiency, ranked #464 of 472 in NJ (top 98%) — low school quality limits family demand, transient renter base, plan for 1-2y turnover; 85% free/reduced lunch — lower-income household profile, screen leases tightly.
- Market conditions: 100 active listings in the ZIP; 2 comparable units currently listed for rent nearby; 95 units permitted in Salem County in 2024 (0 in 5+ unit buildings).
- At $2,370/mo this rent would consume 52% of the median local household income ($55k/yr) (locally 663% of renters already pay >50% of income on rent) — very limited rent-growth headroom before tenants either downsize or default.
Forward outlook
- In year one you build about $806 of equity ($2k loan paydown + $-985 appreciation (-0.4% local appreciation)).
- Salem County population projected at -23% by 2050 — secular population decline; favor cash flow + early exit over multi-decade hold.
Negotiation context
- It's been on market 112 days — a 9% lower offer ($236k) is reasonable based on typical stale-listing flexibility.
- 6 sale attempts since 10y ago with the ask held roughly flat each time — persistent listings suggest the price (not the market) is what's stuck; bring a comps-based counter.
- Current owner paid $185k; 40% above their basis — modest negotiation headroom, anchor on the comps not their cost.
Risks & watch-outs
- Watch-outs: built in 1935 — expect roof / HVAC / electrical / plumbing capex.
- Climate carrying-cost: major wind risk, 27% chance of damaging wind over 30y; extreme-heat days projected 7→15/yr by 2055 (HVAC capex compounding) — expect insurance premiums to compound above CPI over the hold.
Questions for the listing agent
- What do current leases actually rent for vs. the listed asking? Can we see a recent rent roll and the last 12 months of T-12 income?
- It's been on market 112 days. Have you received any prior offers? Is the seller open to a 9% concession, seller financing, or rate buy-down credit?
- Built in 1935 — when were the roof, HVAC, electrical panel, plumbing, and water heater last replaced?
- Why hasn't it sold? Are there any deal-killer items the seller is aware of (foundation, flood, title, zoning, code violations)?
- Is there a deadline driving the sale (1031 exchange, divorce, estate, relocation)? That informs how much negotiation room exists.
- Schools are D-rated, which usually means shorter tenancies and higher turnover. Who's the typical renter profile here, and what's been the actual vacancy rate?
- The area grade is low — what's the realistic commute time and amenity access for the typical tenant pool here? Any planned neighborhood developments (good or bad) we should know about?
- What's the average days-on-market for RENTAL listings here right now (not sales)? A rising rental-DOM trend means longer vacancies and softer asking-rent achievability than the comps imply.
- What's the recent tenant-quality profile in this submarket — average credit score on applications, eviction rate, late-payment / NSF rate, and stable-employment percentage? A property-management company in the area should have these aggregated.
- How much new for-sale + rental construction is in the pipeline within 1–3 miles? Heavy new supply typically softens prices + rents 12–24 months out; constrained supply supports both.
Investment metrics
- 1% rule
- 0.92% ✗
- Cap rate
- 6.04%
- Cash-on-cash
- -0.89%
- DSCR
- 0.96
- GRM
- 9.1
CMA / ARV
- ARV (on-the-fly)
- $233,454
- Comps found
- 12
Show comp detail 12 sales within ~0.75 mi
| Address | Dist | Beds/Ba | Sqft | Sold | Price | $/sf | Match |
|---|---|---|---|---|---|---|---|
| 334 Craven Ave | 0.12mi | 4/1.5 | 1,843 (-3%) | 2mo | $245,000 | $133 | 88 |
| 187 7th St | 0.25mi | 4/2.0 | 1,929 (+2%) | 3mo | $67,000 | $35 | 81 |
| 175 9th St | 0.11mi | 3/1.0 (-1) | 1,776 (-6%) | 3mo | $195,000 | $110 | 75 |
| 6 Walnut St | 0.30mi | 4/2.0 | 1,764 (-7%) | 2mo | $70,000 | $40 | 71 |
| 216 N Union St | 0.17mi | 4/2.0 | 1,798 (-5%) | 16mo | $265,000 | $147 | 68 |
| 200 N Union St | 0.14mi | 3/2.0 (-1) | 1,686 (-11%) | 2mo | $207,500 | $123 | 66 |
| 69 Walnut St | 0.42mi | 3/1.5 (-1) | 1,942 (+2%) | 12mo | $239,000 | $123 | 61 |
| 26 Olive St | 0.31mi | 4/1.0 | 2,164 (+14%) | 3mo | $200,000 | $92 | 58 |
| 321 Fenwick Ave | 0.08mi | 3/1.0 (-1) | 1,622 (-14%) | 10mo | $196,100 | $121 | 57 |
| 340 Morrison Ave | 0.13mi | 3/1.5 (-1) | 1,648 (-13%) | 16mo | $215,000 | $130 | 54 |
| 224 Quaker Rd | 0.38mi | 3/2.0 (-1) | 1,686 (-11%) | 14mo | $450,000 | $267 | 45 |
| 14 Hillcrest Ave | 0.68mi | 4/1.0 | 1,649 (-13%) | 6mo | $196,000 | $119 | 39 |
Match score weights: distance 35% · size 25% · config 20% · recency 20%. Top-matched comps best support the ARV.
Projected returns pro-forma
-0.38% appreciation · 3.0% rent growth · sell at horizon
- IRR
- -4.7%
- Equity multiple
- 0.79×
- Total profit
- $-15,491
- Equity at exit
- $70,319
- IRR
- 1.5%
- Equity multiple
- 1.16×
- Total profit
- $11,444
- Equity at exit
- $80,720
Cash invested: $72,520 (down + closing). Projections, not guarantees.
Landlord ↔ Tenant lean methodology
- Overall (STATE)
- 21 Tenant-Leaning
- State New Jersey
- 21 Tenant-Leaning · D+6
- County
- — inherits STATE
- City
- — inherits STATE
ZIP-level market 08079
- Home prices YoY
- -0.1%
- Active inventory
- 100
- Price-to-rent
- 9.1×
Monthly cashflow live
- Estimated rent
- $2,370 medium interval (Pro) →
- Mortgage (P&I)
- −$1,358
- Tax from tax record
- −$460 /mo · $5,522/yr
- Insurance
- −$108
- HOA
- −$0
- Vacancy / Maint / Mgmt
- −$498
- Net cashflow
- $-54
Break-even live
UW: 25.0% down · 7.5% · 30yr · 1.5% tax · 5.0% vac · 8.0% maint · 8.0% mgmt
Financing live
Cash to close
- Down payment
- $64,750
- Closing costs
- $7,770
- Reserves months
- —
- Total cash needed
- —
Loan-product check · same deal, 3 products live
Conventional
25% down · 7.5% · 30yr
- Down + closing
- —
- Monthly P&I
- —
- Monthly cashflow
- —
- DSCR
- —
- Eligible?
- —
Personal DTI + credit; lowest rate.
DSCR
20% down · 8.5% · 30yr
- Down + closing
- —
- Monthly P&I
- —
- Monthly cashflow
- —
- DSCR
- —
- Eligible?
- —
No personal income docs; deal must DSCR.
Hard money
10% down · 12.0% · 12mo
- Down + closing
- —
- Monthly P&I
- —
- Monthly cashflow
- —
- DSCR
- —
- Eligible?
- —
Short-term bridge; refi at stabilization.
Rent comps 2 comps
| Address | Beds | Baths | Sqft | Rent | $/sqft | DOM | Units | Dist |
|---|---|---|---|---|---|---|---|---|
| 270-272 Grant St Salem, NJ | 4.0 | 1.0 | 1644 | $2,100 | $1.28 | 5d | 1 | 0.18mi |
| 332 E Broadway Salem, NJ | 3.0 | 2.0 | 1844 | $1,980 | $1.07 | 43d | 1 | 0.21mi |
Listing history 17 events
-
2026-06-04status $259,000 Pending 112 DOM
-
2026-05-18historical Active Under Contract
-
2026-05-13status Active
-
2026-05-11historical
-
2026-03-25status Active
-
2026-03-19status Pending
-
2026-03-12historical Active Under Contract
-
2026-02-11price $259,000
-
2026-01-11price $268,000
-
2026-01-11status Active
-
2025-12-01status Pending
-
2025-11-18Active Under Contract
-
2025-11-18$265,000
-
2025-09-24soldstatus $185,000
-
2016-07-13historical
-
2016-01-26$50,000
-
1983-10-31soldstatus $57,000
ⓘ Source: listings_history table (triggers on properties + properties_extension) + one-shot
backfill from property_details.listing_events for pre-trigger history.
Tax reassessment forecast NJ · Partial reset (capped growth)
- Current annual tax
- $5,522 · $460/mo
- Projected year-2 tax
- $5,986 · $499/mo
- Expected delta
- +$464/yr (+$39/mo · 8.4%)
ⓘ Screening estimate from a state-policy table — verify with the county assessor before closing.
Climate risk First Street
- Flood 4/10 Moderate FEMA zone X (unshaded) · 13% chance over 30 yrs
- Wildfire 1/10 Low
- Heat 8/10 Severe 7 d/yr ≥103°F today · 15 d/yr by 30 yrs out
- Wind 6/10 Major 27% chance of damaging wind over 30 yrs
- Air quality 3/10 Moderate 2 unhealthy d/yr today · 4 by 30 yrs out
Nearby sold comps map
Loading sold comps map…
Walkable amenities ~0.75 mi
Loading nearby amenities…
Taxation est. · year 1
- Rental income
- $28,440
- − Mortgage interest
- −$14,508
- − Property taxes
- −$5,522
- − Insurance
- −$1,295
- − Repairs & maintenance
- −$2,275
- − Management
- −$2,275
- − Depreciation
- −$7,535
- Taxable loss
- −$4,970
- Est. tax savings @ 24.0%
- +$1,193
- After-tax cash flow
- $545/yr
For passive investors: Depreciation is non-cash, so a rental often shows a tax loss while cash-flowing — sheltering income. Rental losses are passive: they offset passive income freely, and up to $25,000/yr can offset ordinary (W-2) income if you actively participate and your MAGI is under $100k (phasing out to $0 by $150k); unused losses carry forward. On sale, claimed depreciation is recaptured at up to 25%, and gains may owe capital-gains tax (a 1031 exchange can defer both). Figures are a year-1 estimate at your 24.0% rate — not tax advice; consult a CPA.
Schools (NCES district)
- District
- Salem City School District
- NCES district ID
- 3414550
- Math proficiency
- 6% ▼ -1.00%
- Reading proficiency
- 24% ▲ 2.00%
- Median HH income
- $27,118
- Composite
- 11.51/100
- National rank
- #9702
- State rank
- #464 of 472 in NJ
Livability — Salem
- Score
- 61/100
- State rank
- #462
- US rank
- #17533
Category grades
Schools grade is shown separately in the Schools card above.
Census & demographics
- Census place
- Salem, NJ
- County
- Salem County · 24,175 people
- City population
- 10,762
- Metro
- Philadelphia-Camden-Wilmington, PA-NJ-DE-MD
- Population (ZIP)
- 10,762
- Household income
- $54,641
- Rent vs Own
- Severe rent burden
- 663.0
Population outlook (Salem County) Hauer SSP2
- Today (2025)
- 59,905 people
- By 2030
- 57,351 · -4.3%
- By 2040
- 51,837 · -13.5%
- By 2050
- 46,356 · -22.6%
- By 2075
- 36,452 · -39.2%
- By 2100
- 28,907 · -51.7%
Race, ethnicity, and origin ACS 2023
- Neighborhood character
- Diverse neighborhood (Simpson 0.55)
- Race & ethnicity
- White 59% Black 31% Hispanic / Latino 6% Two or more races 5% Asian 1%
- Hispanic origin (detail)
- Puerto Rican 5%
- Common ancestry
- Romanian 3% Lithuanian 2% Italian 1%
- Foreign-born
- 2% · Canada
- Languages at home
- 94% English-only · Spanish 4% Tagalog/Filipino 1%
Political lean MEDSL · Salem
- 2024 margin
- R (+19.2) · D 39.6% · R 58.8% · Other 1.6%
- 2008→2024 swing
- -23.1pp toward R · 2008: 3.9pp · 2024: -19.2pp
- All cycles
- 2024: R+19.2 2020: R+12.8 2016: R+15.4 2012: D+0.8 2008: D+3.9
Not yet ingested
- Civics
- —
Market trends
- HPI YoY
- ▼ -0.38%
- Current HPI
- 258.0047
- Rent YoY
- —
- Metro
- Philadelphia-Camden-Wilmington, PA-NJ-DE-MD
- State GDP YoY
- ▲ 2.05%
- F500 in state
- 34
Industry mix (Fortune 500 HQ in NJ)
| Industry | F500 HQs | Revenue |
|---|---|---|
| Consumer Goods | 3 | $31B |
|
||
| Pharmaceuticals | 2 | $153B |
|
||
| Technology | 2 | $21B |
|
||
| Insurance | 2 | $20B |
|
||
| Healthcare | 2 | $19B |
|
||
| Financial Services | 1 | $70B |
|
||
Price history
+354.4% since first listed16 events — show timeline
- 2026-05-18 Contingent — BRIGHT MLS
- 2026-05-13 Relisted — BRIGHT MLS
- 2026-05-11 Listing Removed — BRIGHT MLS
- 2026-03-25 Relisted — BRIGHT MLS
- 2026-03-19 Pending — BRIGHT MLS
- 2026-03-12 Contingent — BRIGHT MLS
- 2026-02-11 Price Changed $259,000 BRIGHT MLS
- 2026-01-11 Price Changed $268,000 BRIGHT MLS
- 2026-01-11 Relisted — BRIGHT MLS
- 2025-12-01 Pending — BRIGHT MLS
- 2025-11-18 Listed — BRIGHT MLS
- 2025-11-18 Listed $265,000 BRIGHT MLS
- 2025-09-24 Sold (Public Records) $185,000 Public Records
- 2016-07-13 Listing Removed — BRIGHT MLS
- 2016-01-26 Listed $50,000 BRIGHT MLS
- 1983-10-31 Sold (Public Records) $57,000 Public Records
Property tax history
+3.0%/yrLatest (2025): $5,522 · +4.9% YoY. Source: county tax records.
Cash-flow waterfall
monthlySold comps — $/sqft
last 12 mo · ≤1 miLoading sold comps…