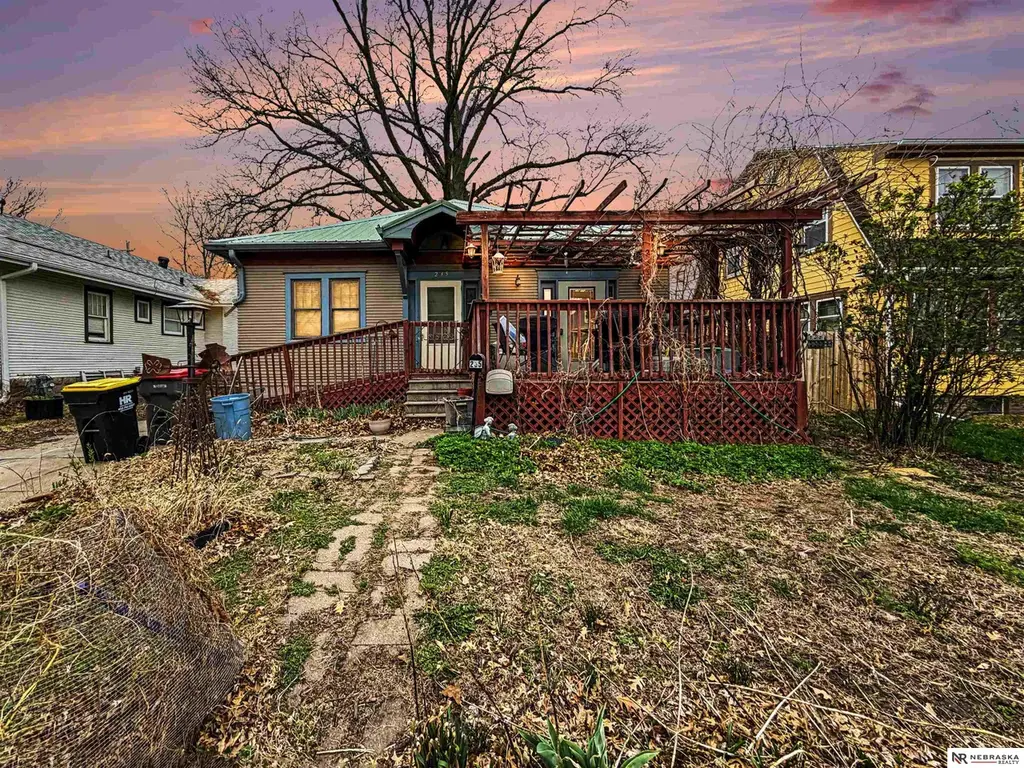
235 N 31st St · Lincoln, NE
Flood risk 1/10 · Minimal
- FEMA flood zone
- X (unshaded)
- Chance of flooding over 30 yrs
- 0.0%
- Est. flood insurance / yr
- $473 – $860
Fire risk 1/10 · Minimal
- Est. fire insurance / yr
- $1,161 – $2,155
Heat risk 3/10 · Minor
- Hot days now (above 104°F)
- 7 days/yr
- Hot days in 30 yrs
- 16 days/yr
Wind risk 2/10 · Minimal
- Chance of severe wind over 30 yrs
- —
Air-quality risk 1/10 · Minimal
- Unhealthy air days now
- 0 days/yr
- Unhealthy air days in 30 yrs
- 0 days/yr
Risk factors via First Street. Map © Google.
Why this score? — see what drove the D- grade
The composite is a weighted blend of 9 inputs, each scored 0–100. Each bar is that input's sub-score; the figure is the points it added to the 100-point composite (weight × sub-score).
- Cash flow +9.9/30.0
- ARV discount +9.4/15.0
- Schools +4.4/10.0
- Livability +4.2/5.0
- Rent growth +3.1/5.0
- DSCR +2.8/10.0
- 1% rule +2.5/10.0
- Condition / age +2.5/5.0
- Appreciation +0.0/10.0
$190,000
🖨 Deal sheet 📄 Offer letter ✓ Due diligence
Listing remarks MLS
Unlock the potential in this 3-bedroom, 2-bath home bursting with opportunity! Whether you're an investor searching for your next project or a buyer ready to create your dream home, this property offers incredible possibilities with the right vision. The seller is willing to negotiate a $10,000 credit at closing to help with repairs and updates giving you the flexibility to customize and build equity from day one. With solid bones and great layout potential, this home is ready to be transformed into something truly special. Opportunities like this don't last long! Schedule your showing today!
Key facts
- 4,748 sq ft lot
- Built 1910
- Listed 41 days
Neighborhood map
What this means for you Summary
Snapshot
- This is a 2-bed/2.0-bath single-family listed at $190k.
Deal economics
- At list price, monthly cash flow is $-119 ($-1k/yr) — negative.
- To cash-flow at today's rent, offer at most $169k (11.1% below list).
- To meet the 1% rule (rent ≥ 1% of price), the offer needs to be $143k (25.0% below list).
- Recommended offer: $143k (25.0% below list) — sets the bar for 1% rule.
- Cap rate 5.5% vs local median 3.0% in Lincoln — top-decile yield for the area; either an underpriced asset or a hidden risk that comps aren't pricing in. Stress-test before assuming the spread holds.
Location & tenants
- Location reads 85/100 on livability (#5 in NE, #545 nationally) — a professional / high-income tenant draw. Strengths: amenities A+, cost of living A+, housing A+; Watch: crime D+.
- Lincoln Public Schools (urban): math 50% / reading 53% proficiency, ranked #59 of 111 in NE (top 53%) — acceptable for families but not a draw, mixed tenant base, ~2y average lease.
- Market conditions: Rents rising (+2.4%/yr); 56 active listings in the ZIP; 7 comparable units currently listed for rent nearby; rentals lingering (median 44d on market — plan ~5-8 weeks vacancy on turnover, expect pricing pressure); 57% of comp listings sitting > 30 days — soft ceiling on asking rent; 1,940 units permitted in Lancaster County in 2024 (895 in 5+ unit buildings).
- This rent runs 32% of the median local income ($54k/yr) — at the standard rent-burdened threshold; future hikes will face affordability resistance.
Forward outlook
- Local home prices are declining (-3.0%/yr); year-one equity from $1k of loan paydown is wiped out by about $6k of value loss. Plan a longer hold.
- Lancaster County population projected at +37% by 2050 — long-run rental-demand tailwind backs the buy-and-hold thesis.
Negotiation context
- It's been on market 41 days — a 3% lower offer ($184k) is reasonable based on typical stale-listing flexibility.
Risks & watch-outs
- Watch-outs: built in 1910 — expect roof / HVAC / electrical / plumbing capex.
Questions for the listing agent
- What do current leases actually rent for vs. the listed asking? Can we see a recent rent roll and the last 12 months of T-12 income?
- It's been on market 41 days. Have you received any prior offers? Is the seller open to a 25% concession, seller financing, or rate buy-down credit?
- Built in 1910 — when were the roof, HVAC, electrical panel, plumbing, and water heater last replaced?
- Is there a deadline driving the sale (1031 exchange, divorce, estate, relocation)? That informs how much negotiation room exists.
- Schools are A-rated — typically a magnet for longer-tenancy family renters. What's the average tenant stay here, and is there a school-zone premium baked into asking?
- Crime grade is D in this area — have there been break-ins, vandalism, or insurance claims at this property in the last 3 years? What carrier currently insures it and at what premium?
- The area grade is low — what's the realistic commute time and amenity access for the typical tenant pool here? Any planned neighborhood developments (good or bad) we should know about?
- What's the average days-on-market for RENTAL listings here right now (not sales)? A rising rental-DOM trend means longer vacancies and softer asking-rent achievability than the comps imply.
- What's the recent tenant-quality profile in this submarket — average credit score on applications, eviction rate, late-payment / NSF rate, and stable-employment percentage? A property-management company in the area should have these aggregated.
- How much new for-sale + rental construction is in the pipeline within 1–3 miles? Heavy new supply typically softens prices + rents 12–24 months out; constrained supply supports both.
Investment metrics
- 1% rule
- 0.75% ✗
- Cap rate
- 5.54%
- Cash-on-cash
- -2.69%
- DSCR
- 0.88
- GRM
- 11.1
CMA / ARV
- ARV (median comp)
- $198,261
- List price
- $190,000
- Delta
- -4.17%
- Verdict
- FAIR
- Comps
- 20 within 1.0 mi
Show comp detail 12 sales within ~0.75 mi
| Address | Dist | Beds/Ba | Sqft | Sold | Price | $/sf | Match |
|---|---|---|---|---|---|---|---|
| 235 N 31st St | 0.00mi | 3/2.0 (+1) | 1,970 (0%) | 0mo | $175,000 | $89 | 95 |
| 329 N 35th St | 0.33mi | 3/2.0 (+1) | 1,988 (+1%) | 6mo | $265,000 | $133 | 74 |
| 3119 R St | 0.12mi | 3/2.0 (+1) | 1,796 (-9%) | 3mo | $188,000 | $105 | 72 |
| 3045 Vine St | 0.38mi | 3/2.0 (+1) | 1,908 (-3%) | 2mo | $142,000 | $74 | 71 |
| 319 S 30th St | 0.33mi | 3/2.0 (+1) | 1,788 (-9%) | 4mo | $276,500 | $155 | 61 |
| 3319 Orchard St | 0.72mi | 3/2.0 (+1) | 2,012 (+2%) | 2mo | $308,000 | $153 | 56 |
| 610 Marshall Ave | 0.52mi | 3/2.0 (+1) | 1,754 (-11%) | 1mo | $237,500 | $135 | 52 |
| 3318 Orchard St | 0.74mi | 3/1.5 (+1) | 1,896 (-4%) | 2mo | $256,000 | $135 | 50 |
| 645 S 28th St | 0.61mi | 3/2.5 (+1) | 1,736 (-12%) | 2mo | $259,000 | $149 | 43 |
| 3730 L St | 0.62mi | 3/2.0 (+1) | 1,758 (-11%) | 6mo | $242,000 | $138 | 43 |
| 3631 W St | 0.64mi | 3/2.0 (+1) | 1,720 (-13%) | 4mo | $235,000 | $137 | 41 |
| 833 Elmwood Ave | 0.68mi | 3/3.0 (+1) | 2,212 (+12%) | 2mo | $315,000 | $142 | 37 |
Match score weights: distance 35% · size 25% · config 20% · recency 20%. Top-matched comps best support the ARV.
Projected returns pro-forma
-3.0% appreciation · 2.39% rent growth · sell at horizon
- IRR
- -21.4%
- Equity multiple
- 0.26×
- Total profit
- $-39,284
- Equity at exit
- $28,330
- IRR
- -16.5%
- Equity multiple
- 0.11×
- Total profit
- $-47,608
- Equity at exit
- $16,428
Cash invested: $53,200 (down + closing). Projections, not guarantees.
Landlord ↔ Tenant lean methodology
- Overall (STATE)
- 83 Strongly Landlord-Friendly
- State Nebraska
- 83 Strongly Landlord-Friendly · R+13
- County
- — inherits STATE
- City
- — inherits STATE
ZIP-level market 68503
- Rents YoY
- 2.4%
- Active inventory
- 56
- Price-to-rent
- 11.1×
Monthly cashflow live
- Estimated rent
- $1,425 high interval (Pro) →
- Mortgage (P&I)
- −$996
- Tax from tax record
- −$170 /mo · $2,037/yr
- Insurance
- −$79
- HOA
- −$0
- Vacancy / Maint / Mgmt
- −$299
- Net cashflow
- $-119
Break-even live
UW: 25.0% down · 7.5% · 30yr · 1.5% tax · 5.0% vac · 8.0% maint · 8.0% mgmt
Financing live
Cash to close
- Down payment
- $47,500
- Closing costs
- $5,700
- Reserves months
- —
- Total cash needed
- —
Loan-product check · same deal, 3 products live
Conventional
25% down · 7.5% · 30yr
- Down + closing
- —
- Monthly P&I
- —
- Monthly cashflow
- —
- DSCR
- —
- Eligible?
- —
Personal DTI + credit; lowest rate.
DSCR
20% down · 8.5% · 30yr
- Down + closing
- —
- Monthly P&I
- —
- Monthly cashflow
- —
- DSCR
- —
- Eligible?
- —
No personal income docs; deal must DSCR.
Hard money
10% down · 12.0% · 12mo
- Down + closing
- —
- Monthly P&I
- —
- Monthly cashflow
- —
- DSCR
- —
- Eligible?
- —
Short-term bridge; refi at stabilization.
Rent comps 7 comps
| Address | Beds | Baths | Sqft | Rent | $/sqft | DOM | Units | Dist |
|---|---|---|---|---|---|---|---|---|
| 2039 Q St Unit 102 Lincoln, NE | 3.0 | 3.0 | 1450 | $1,595 | $1.10 | 43d | 1 | 0.76mi |
| 2039 Q St Unit 103 Lincoln, NE | 3.0 | 3.0 | 1450 | $1,695 | $1.17 | 43d | 1 | 0.76mi |
| 2239 Dudley St Lincoln, NE | 2.0 | 1.0 | 1241 | $1,100 | $0.89 | 43d | 1 | 0.98mi |
| 420 S 18th St Lincoln, NE | 1.0–3.0 | 1.0–2.0 | 996 | $1,224 | $1.23 | 13d | 8 | 1.00mi |
| 1550 S 23rd St Lincoln, NE | 3.0 | 1.0 | 1560 | $1,495 | $0.96 | 13d | 1 | 1.37mi |
| 4630 Starr St Unit 4630 Lincoln, NE | 3.0 | 1.0 | 1460 | $1,250 | $0.86 | 43d | 1 | 1.41mi |
| 5101 Vine St Lincoln, NE | 1.0–2.0 | 1.0–2.0 | 886 | $1,370 | $1.55 | 13d | 18 | 1.48mi |
Listing history 3 events
-
2026-05-11status Pending 599-char remark
Show marketing remark (599 chars)
Unlock the potential in this 3-bedroom, 2-bath home bursting with opportunity! Whether you're an investor searching for your next project or a buyer ready to create your dream home, this property offers incredible possibilities with the right vision. The seller is willing to negotiate a $10,000 credit at closing to help with repairs and updates giving you the flexibility to customize and build equity from day one. With solid bones and great layout potential, this home is ready to be transformed into something truly special. Opportunities like this don't last long! Schedule your showing today!
-
2026-02-12$190,000 New 599-char remark
Show marketing remark (599 chars)
Unlock the potential in this 3-bedroom, 2-bath home bursting with opportunity! Whether you're an investor searching for your next project or a buyer ready to create your dream home, this property offers incredible possibilities with the right vision. The seller is willing to negotiate a $10,000 credit at closing to help with repairs and updates giving you the flexibility to customize and build equity from day one. With solid bones and great layout potential, this home is ready to be transformed into something truly special. Opportunities like this don't last long! Schedule your showing today!
-
2024-04-26soldstatus $194,000
ⓘ Source: listings_history table (triggers on properties + properties_extension) + one-shot
backfill from property_details.listing_events for pre-trigger history.
Tax reassessment forecast NE · Resets to sale price
- Current annual tax
- $2,037 · $170/mo
- Projected year-2 tax
- $3,287 · $274/mo
- Expected delta
- +$1,250/yr (+$104/mo · 61.4%)
ⓘ Screening estimate from a state-policy table — verify with the county assessor before closing.
Climate risk First Street
- Flood 1/10 Low FEMA zone X (unshaded) · 0% chance over 30 yrs
- Wildfire 1/10 Low
- Heat 3/10 Moderate 7 d/yr ≥104°F today · 16 d/yr by 30 yrs out
- Wind 2/10 Low
- Air quality 1/10 Low 0 unhealthy d/yr today · 0 by 30 yrs out
Nearby sold comps map
Loading sold comps map…
Walkable amenities ~0.75 mi
Loading nearby amenities…
Taxation est. · year 1
- Rental income
- $17,101
- − Mortgage interest
- −$10,643
- − Property taxes
- −$2,037
- − Insurance
- −$950
- − Repairs & maintenance
- −$1,368
- − Management
- −$1,368
- − Depreciation
- −$5,527
- Taxable loss
- −$4,792
- Est. tax savings @ 24.0%
- +$1,150
- After-tax cash flow
- $-283/yr
For passive investors: Depreciation is non-cash, so a rental often shows a tax loss while cash-flowing — sheltering income. Rental losses are passive: they offset passive income freely, and up to $25,000/yr can offset ordinary (W-2) income if you actively participate and your MAGI is under $100k (phasing out to $0 by $150k); unused losses carry forward. On sale, claimed depreciation is recaptured at up to 25%, and gains may owe capital-gains tax (a 1031 exchange can defer both). Figures are a year-1 estimate at your 24.0% rate — not tax advice; consult a CPA.
Schools (NCES district)
- District
- Lincoln Public Schools
- NCES district ID
- 3172840
- Math proficiency
- 50% ▼ -6.00%
- Reading proficiency
- 53% ▼ -3.00%
- Median HH income
- $50,273
- Composite
- 44.05/100
- National rank
- #2880
- State rank
- #59 of 111 in NE
Livability — Lincoln
- Score
- 85/100
- State rank
- #5
- US rank
- #545
Category grades
Schools grade is shown separately in the Schools card above.
Census & demographics
- Census place
- Lincoln, NE
- County
- Lancaster County · 291,509 people
- City population
- 291,509
- Metro
- Lincoln, NE
- Population (ZIP)
- 15,867
- Household income
- $54,232
- Rent vs Own
- Severe rent burden
- 820.0
Population outlook (Lancaster County) Hauer SSP2
- Today (2025)
- 352,806 people
- By 2030
- 377,899 · +7.1%
- By 2040
- 428,582 · +21.5%
- By 2050
- 483,103 · +36.9%
- By 2075
- 632,390 · +79.2%
- By 2100
- 759,513 · +115.3%
Race, ethnicity, and origin ACS 2023
- Neighborhood character
- Diverse neighborhood (Simpson 0.62)
- Race & ethnicity
- White 59% Hispanic / Latino 12% Black 12% Two or more races 10% Asian 10%
- Hispanic origin (detail)
- Mexican 8%
- Common ancestry
- Lithuanian 2% Romanian 2% Portuguese 2%
- Foreign-born
- 19% · Canada, Vietnam, China
- Languages at home
- 73% English-only · Spanish 7% Other Indo-European 5% Vietnamese 5%
Political lean MEDSL · Lancaster
- 2024 margin
- Toss-up / Even · D 51.4% · R 47.1% · Other 1.5%
- 2008→2024 swing
- -0.7pp no change · 2008: 5.0pp · 2024: 4.3pp
- All cycles
- 2024: D+4.3 2020: D+7.8 2016: D+0.1 2012: R+1.0 2008: D+5.0
Not yet ingested
- Civics
- —
Market trends
- HPI YoY
- ▼ -145.46%
- Current HPI
- 260.3421
- Rent YoY
- ▲ 2.39%
- Metro
- Lincoln, NE
- State GDP YoY
- ▲ 0.68%
- F500 in state
- 2
Industry mix (Fortune 500 HQ in NE)
| Industry | F500 HQs | Revenue |
|---|---|---|
| Conglomerate | 1 | $371B |
|
||
Price history
-2.1% since first listed3 events — show timeline
- 2026-05-11 Pending — GPRMLS
- 2026-02-12 Listed $190,000 GPRMLS
- 2024-04-26 Sold (Public Records) $194,000 Public Records
Property tax history
+2.8%/yrLatest (2025): $2,037 · -1.6% YoY. Source: county tax records.
Cash-flow waterfall
monthlySold comps — $/sqft
last 12 mo · ≤1 miLoading sold comps…