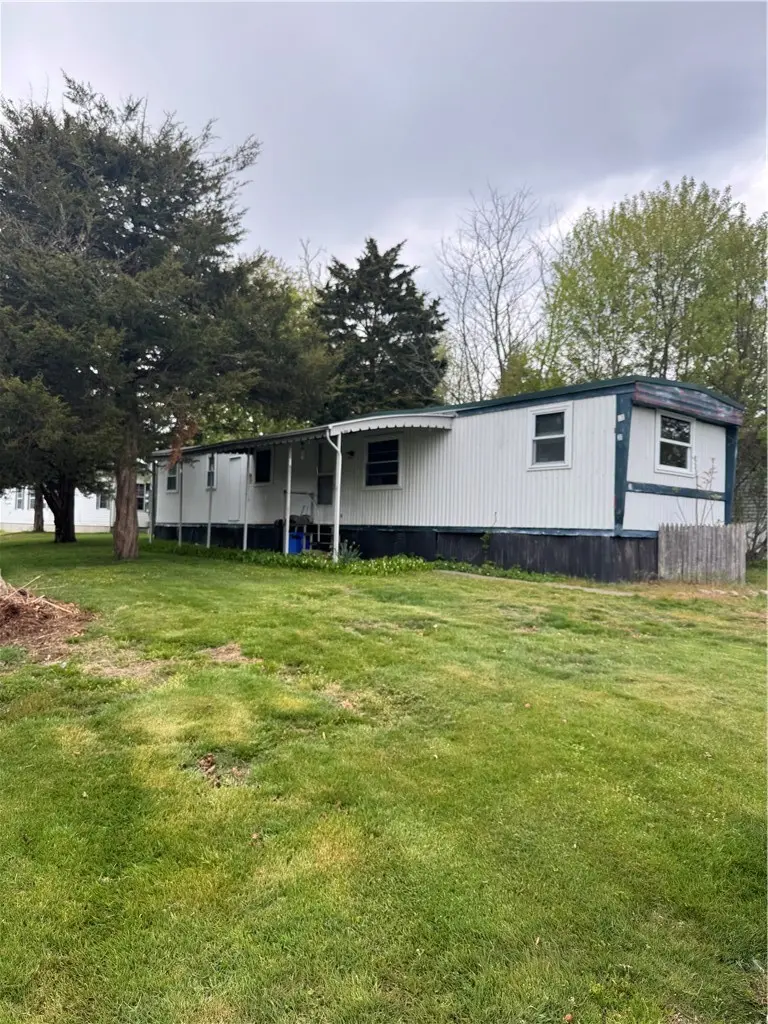
301 Bulgarmarsh Rd · Tiverton, RI
Flood risk 1/10 · Minimal
- FEMA flood zone
- X (unshaded)
- Chance of flooding over 30 yrs
- 0.0%
- Est. flood insurance / yr
- $507 – $1,088
Fire risk 3/10 · Minor
- Est. fire insurance / yr
- $835 – $1,551
Heat risk 5/10 · Moderate
- Hot days now (above 94°F)
- 7 days/yr
- Hot days in 30 yrs
- 16 days/yr
Wind risk 8/10 · Major
- Chance of severe wind over 30 yrs
- 80.0%
Air-quality risk 2/10 · Minimal
- Unhealthy air days now
- 1 days/yr
- Unhealthy air days in 30 yrs
- 2 days/yr
Risk factors via First Street. Map © Google.
Why this score? — see what drove the B- grade
The composite is a weighted blend of 9 inputs, each scored 0–100. Each bar is that input's sub-score; the figure is the points it added to the 100-point composite (weight × sub-score).
- Cash flow +30.0/30.0
- 1% rule +10.0/10.0
- DSCR +10.0/10.0
- ARV discount +7.5/15.0
- Schools +3.8/10.0
- Livability +3.1/5.0
- Rent growth +2.5/5.0
- Condition / age +2.5/5.0
- Appreciation +0.0/10.0
$114,900
🖨 Deal sheet 📄 Offer letter ✓ Due diligence
Listing remarks MLS
Tiverton gem! This 2 bedroom one bath mobile home located in the well-established Dadson Estates Community. It's situated on a corner lot. The open floor plan includes a eat in kitchen, dinning area, spacious living room. Conveniently located near highways and shopping.
Key facts
- Open floor plan
- Eat in kitchen
- Dining area
Tags
Property features AI
Finance
- Other: Listing status: Active
- Financial info: Annual tax amount listed (not included per instructions)
- HOA & community: Homeowners association membership required; Association fee of $295; Community features include highway access, house of worship nearby, and public school access; Not a senior community
Exterior
- Parking: 1 off-street parking space
- Security: Not specified
- Utilities: Public water; Private sewer; 100 amp electric service
- Home design: Mobile home; House structure; White exterior; Entry level not specified; Facing direction not specified
- Construction: Modular construction; Slab foundation; Rubber roof; Built year per public records (actual year not provided)
- Exterior features: Corner lot; Private road frontage; Storage
Interior
- Kitchen: Range; Refrigerator
- Bedrooms: Not specified
- Flooring: Vinyl flooring; Carpet
- Bathrooms: 1 full bathroom
- Heating & cooling: Forced air heating; Oil heating; Has heating
- Interior features: Total of 4 rooms; Storage included
- Laundry & utility: Dryer
Neighborhood map
What this means for you Summary
Snapshot
- This is a 2-bed/1.0-bath single-family listed at $115k.
Deal economics
- At list price, monthly cash flow is $747 ($9k/yr) — positive.
- The deal already cash-flows at list — no discount required.
- Meets the 1% rule at list price ($2k rent vs $115k).
- Recommended offer: $111k (3.0% below list) — sets the bar for market timing.
- Cap rate 14.1% vs local median 3.5% in Tiverton — top-decile yield for the area; either an underpriced asset or a hidden risk that comps aren't pricing in. Stress-test before assuming the spread holds.
Location & tenants
- Location reads 61/100 on livability (#28 in RI) — a middle-class / working-renter tenant base. Strengths: crime A+, housing A+, employment A-; Watch: schools C-, cost of living D+, amenities F.
- Tiverton (rural): math 35% / reading 49% proficiency, ranked #14 of 39 in RI (top 36%) — families likely to look elsewhere, expect single-tenant / working-renter base with shorter leases.
- Market conditions: 91 active listings in the ZIP; 1 comparable units currently listed for rent nearby; solid renter incomes; 94 units permitted in Newport County in 2024 (0 in 5+ unit buildings).
Forward outlook
- Local home prices are declining (-3.0%/yr); year-one equity from $794 of loan paydown is wiped out by about $3k of value loss. Plan a longer hold.
- Newport County population projected at -12% by 2050 — secular population decline; favor cash flow + early exit over multi-decade hold.
- At projected returns (-3.0% appreciation + 3.0% rent growth), your $32k cash investment doubles in ~5 years — after that, you're playing with house money.
Negotiation context
- It's been on market 40 days — a 3% lower offer ($111k) is reasonable based on typical stale-listing flexibility.
- 17 sale attempts since 16y ago; this cycle's ask has dropped $15k (12%) from the opening price — seller is motivated, your offer sets the floor, not the list.
Risks & watch-outs
- Climate carrying-cost: severe wind risk, 80% chance of damaging wind over 30y; extreme-heat days projected 7→16/yr by 2055 (HVAC capex compounding) — expect insurance premiums to compound above CPI over the hold.
Questions for the listing agent
- It's been on market 40 days. Have you received any prior offers? Is the seller open to a 3% concession, seller financing, or rate buy-down credit?
- Built in 1971 — when were the roof, HVAC, electrical panel, plumbing, and water heater last replaced?
- What does the HOA fee cover, when was the last increase, and are there any pending special assessments or reserve-fund shortfalls?
- Is there a deadline driving the sale (1031 exchange, divorce, estate, relocation)? That informs how much negotiation room exists.
- What's the average days-on-market for RENTAL listings here right now (not sales)? A rising rental-DOM trend means longer vacancies and softer asking-rent achievability than the comps imply.
- What's the recent tenant-quality profile in this submarket — average credit score on applications, eviction rate, late-payment / NSF rate, and stable-employment percentage? A property-management company in the area should have these aggregated.
- How much new for-sale + rental construction is in the pipeline within 1–3 miles? Heavy new supply typically softens prices + rents 12–24 months out; constrained supply supports both.
Investment metrics
- 1% rule
- 2.02% ✓
- Cap rate
- 14.09%
- Cash-on-cash
- 27.85%
- DSCR
- 2.24
- GRM
- 4.1
CMA / ARV
No comps found within radius.
Projected returns pro-forma
-3.0% appreciation · 3.0% rent growth · sell at horizon
- IRR
- 22.1%
- Equity multiple
- 1.91×
- Total profit
- $29,157
- Equity at exit
- $17,132
- IRR
- 30.2%
- Equity multiple
- 3.72×
- Total profit
- $87,509
- Equity at exit
- $9,934
Cash invested: $32,172 (down + closing). Projections, not guarantees.
Landlord ↔ Tenant lean methodology
- Overall (STATE)
- 31 Tenant-Leaning
- State Rhode Island
- 31 Tenant-Leaning · D+8
- County
- — inherits STATE
- City
- — inherits STATE
ZIP-level market 02878
- Home prices YoY
- -23.3%
- Active inventory
- 91
- Price-to-rent
- 4.1×
Monthly cashflow live
- Estimated rent
- $2,324 medium interval (Pro) →
- Mortgage (P&I)
- −$603
- Tax est. 1.5%
- −$144 /mo · $1,724/yr
- Insurance
- −$48
- HOA
- −$295
- Vacancy / Maint / Mgmt
- −$488
- Net cashflow
- $747
Break-even live
UW: 25.0% down · 7.5% · 30yr · 1.5% tax · 5.0% vac · 8.0% maint · 8.0% mgmt
Financing live
Cash to close
- Down payment
- $28,725
- Closing costs
- $3,447
- Reserves months
- —
- Total cash needed
- —
Loan-product check · same deal, 3 products live
Conventional
25% down · 7.5% · 30yr
- Down + closing
- —
- Monthly P&I
- —
- Monthly cashflow
- —
- DSCR
- —
- Eligible?
- —
Personal DTI + credit; lowest rate.
DSCR
20% down · 8.5% · 30yr
- Down + closing
- —
- Monthly P&I
- —
- Monthly cashflow
- —
- DSCR
- —
- Eligible?
- —
No personal income docs; deal must DSCR.
Hard money
10% down · 12.0% · 12mo
- Down + closing
- —
- Monthly P&I
- —
- Monthly cashflow
- —
- DSCR
- —
- Eligible?
- —
Short-term bridge; refi at stabilization.
Rent comps 1 comps
| Address | Beds | Baths | Sqft | Rent | $/sqft | DOM | Units | Dist |
|---|---|---|---|---|---|---|---|---|
| 14 William Barton Dr Tiverton, RI | 2.0 | 1.0 | 700 | $2,500 | $3.57 | 43d | 1 | 0.23mi |
HOA detail
- Monthly dues
- $295 · $3,540/yr
Listing history 50 events
-
2026-06-18days on market $114,900 Active 40 DOM
-
2026-06-17days on market $114,900 Active 39 DOM
-
2026-06-16days on market $114,900 Active 38 DOM
-
2026-06-15days on market $114,900 Active 37 DOM
-
2026-06-13days on market $114,900 Active 35 DOM
-
2026-06-13days on market $114,900 Active 34 DOM
-
2026-06-09days on market $114,900 Active 31 DOM
-
2026-06-08days on market $114,900 Active 30 DOM
-
2026-06-07statusdays on market $114,900 Active 29 DOM
-
2026-06-05days on market $114,900 Price Changed 26 DOM
-
2026-06-03days on market $114,900 Price Changed 25 DOM
-
2026-06-02pricestatusdays on market $114,900 Price Changed 24 DOM
Show marketing remark (271 chars)
Tiverton gem! This 2 bedroom one bath mobile home located in the well-established Dadson Estates Community. It's situated on a corner lot. The open floor plan includes a eat in kitchen, dinning area, spacious living room. Conveniently located near highways and shopping.
-
2026-06-01days on market $129,900 Active 23 DOM
-
2026-05-31days on market $129,900 Active 22 DOM
-
2026-05-08$129,900 New 272-char remark
Show marketing remark (271 chars)
Tiverton gem! This 2 bedroom one bath mobile home located in the well-established Dadson Estates Community. It's situated on a corner lot. The open floor plan includes a eat in kitchen, dinning area, spacious living room. Conveniently located near highways and shopping.
-
2026-05-08$129,900 Active 271-char remark
Show marketing remark (271 chars)
Tiverton gem! This 2 bedroom one bath mobile home located in the well-established Dadson Estates Community. It's situated on a corner lot. The open floor plan includes a eat in kitchen, dinning area, spacious living room. Conveniently located near highways and shopping.
-
2026-04-24soldstatus $118,000 Closed
Show marketing remark (301 chars)
Located in the well-established Dadson Estates community in Tiverton, this 1-bedroom home is situated on a corner lot. The open floor plan includes an eat-in kitchen, dining area, and spacious living room. Conveniently located near highways and shopping. Buyer approval by park management is required.
-
2026-03-11status Pending
Show marketing remark (301 chars)
Located in the well-established Dadson Estates community in Tiverton, this 1-bedroom home is situated on a corner lot. The open floor plan includes an eat-in kitchen, dining area, and spacious living room. Conveniently located near highways and shopping. Buyer approval by park management is required.
-
2026-03-03historical Active Under Contract
Show marketing remark (301 chars)
Located in the well-established Dadson Estates community in Tiverton, this 1-bedroom home is situated on a corner lot. The open floor plan includes an eat-in kitchen, dining area, and spacious living room. Conveniently located near highways and shopping. Buyer approval by park management is required.
-
2026-02-27$125,000 Active
Show marketing remark (301 chars)
Located in the well-established Dadson Estates community in Tiverton, this 1-bedroom home is situated on a corner lot. The open floor plan includes an eat-in kitchen, dining area, and spacious living room. Conveniently located near highways and shopping. Buyer approval by park management is required.
-
2025-06-23soldstatus $155,000 Closed
-
2025-05-22status Pending
-
2025-05-03$150,000 Active
-
2019-09-20price $43,000
-
2019-09-20price $99,900
-
2019-07-02soldstatus $83,500 Sold
-
2019-05-20status Pending
-
2019-05-06$84,999 Active
-
2016-11-08price $64,900
-
2016-11-08price $112,000
-
2015-09-16soldstatus $53,500 Sold
-
2015-09-14soldstatus $18,500 Sold
-
2015-08-17status Pending
-
2015-07-10status Pending
-
2015-06-09$54,900 Active - New
-
2015-05-19price $29,900
-
2015-04-16price $49,900
-
2015-03-31$53,900 Active - New
-
2015-03-30historical
-
2015-03-23historical
-
2015-02-05$53,900 Active - New
-
2014-11-24$59,900 Active - New
-
2013-12-19price $39,900
-
2013-09-30soldstatus $47,000
-
2013-06-26soldstatus $47,000
-
2013-05-14historical
-
2013-05-13historical
-
2013-02-21$59,900
-
2013-02-21$59,900
-
2013-02-01soldstatus $50,000
ⓘ Source: listings_history table (triggers on properties + properties_extension) + one-shot
backfill from property_details.listing_events for pre-trigger history.
Climate risk First Street
- Flood 1/10 Low FEMA zone X (unshaded) · 0% chance over 30 yrs
- Wildfire 3/10 Moderate
- Heat 5/10 Major 7 d/yr ≥94°F today · 16 d/yr by 30 yrs out
- Wind 8/10 Severe 80% chance of damaging wind over 30 yrs
- Air quality 2/10 Low 1 unhealthy d/yr today · 2 by 30 yrs out
Nearby sold comps map
Loading sold comps map…
Walkable amenities ~0.75 mi
Loading nearby amenities…
Taxation est. · year 1
- Rental income
- $27,885
- − Mortgage interest
- −$6,436
- − Property taxes
- −$1,724
- − Insurance
- −$574
- − Repairs & maintenance
- −$2,231
- − Management
- −$2,231
- − HOA
- −$3,540
- − Depreciation
- −$3,343
- Taxable income
- $7,807
- Est. tax owed @ 24.0%
- −$1,874
- After-tax cash flow
- $7,087/yr
For passive investors: Depreciation is non-cash, so a rental often shows a tax loss while cash-flowing — sheltering income. Rental losses are passive: they offset passive income freely, and up to $25,000/yr can offset ordinary (W-2) income if you actively participate and your MAGI is under $100k (phasing out to $0 by $150k); unused losses carry forward. On sale, claimed depreciation is recaptured at up to 25%, and gains may owe capital-gains tax (a 1031 exchange can defer both). Figures are a year-1 estimate at your 24.0% rate — not tax advice; consult a CPA.
Schools (NCES district)
- District
- Tiverton
- NCES district ID
- 4401050
- Math proficiency
- 35% ▼ -6.00%
- Reading proficiency
- 49% ▬ 0.00%
- Median HH income
- $67,472
- Composite
- 37.77/100
- National rank
- #4347
- State rank
- #14 of 39 in RI
Livability — Tiverton
- Score
- 61/100
- State rank
- #28
- US rank
- #17481
Category grades
Schools grade is shown separately in the Schools card above.
Census & demographics
- County
- Newport County · 73,957 people
- City population
- 16,189
- Metro
- Providence-Warwick, RI-MA
- Population (ZIP)
- 16,189
- Household income
- $106,036
- Rent vs Own
- Severe rent burden
- 201.0
Population outlook (Newport County) Hauer SSP2
- Today (2025)
- 81,198 people
- By 2030
- 79,518 · -2.1%
- By 2040
- 75,581 · -6.9%
- By 2050
- 71,801 · -11.6%
- By 2075
- 64,618 · -20.4%
- By 2100
- 56,724 · -30.1%
Race, ethnicity, and origin ACS 2023
- Neighborhood character
- Predominantly White (91%)
- Race & ethnicity
- White 91% Hispanic / Latino 4% Two or more races 3% Black 2%
- Common ancestry
- Russian 30% Lithuanian 15% Romanian 4%
- Foreign-born
- 7% · Canada
- Languages at home
- 92% English-only · Other Indo-European 5% Spanish 2% French/Haitian/Cajun 1%
Political lean MEDSL · Newport
- 2024 margin
- Strong D (+25.5) · D 61.6% · R 36.1% · Other 2.2%
- 2008→2024 swing
- +2.2pp toward D · 2008: 23.3pp · 2024: 25.5pp
- All cycles
- 2024: D+25.5 2020: D+29.8 2016: D+19.4 2012: D+17.7 2008: D+23.3
Not yet ingested
- Civics
- —
Market trends
- HPI YoY
- ▼ -110.16%
- Current HPI
- 362.7711
- Rent YoY
- —
- Metro
- Providence-Warwick, RI-MA
- State GDP YoY
- ▲ 2.25%
- F500 in state
- 10
Industry mix (Fortune 500 HQ in RI)
| Industry | F500 HQs | Revenue |
|---|---|---|
| Healthcare | 1 | $373B |
|
||
| Food Distribution | 1 | $31B |
|
||
| Aerospace / Defense | 1 | $14B |
|
||
| Financial Services | 1 | $8B |
|
||
| Consumer Goods | 1 | $4B |
|
||
Price history
+101.6% since first listed51 events — show timeline
- 2026-06-02 Price Changed $114,900 RIS
- 2026-06-02 Price Changed $114,900 MLS PIN
- 2026-05-08 Listed $129,900 RIS
- 2026-05-08 Listed $129,900 MLS PIN
- 2026-04-24 Sold (MLS) $118,000 RIS
- 2026-03-11 Pending — RIS
- 2026-03-03 Contingent — RIS
- 2026-02-27 Listed $125,000 RIS
- 2025-06-23 Sold (MLS) $155,000 RIS
- 2025-05-22 Pending — RIS
- 2025-05-03 Listed $150,000 RIS
- 2019-09-20 Price Changed $43,000 RIS
- 2019-09-20 Price Changed $99,900 RIS
- 2019-07-02 Sold (MLS) $83,500 RIS
- 2019-05-20 Pending — RIS
- 2019-05-06 Listed $84,999 RIS
- 2016-11-08 Price Changed $112,000 RIS
- 2016-11-08 Price Changed $64,900 RIS
- 2015-09-16 Sold (MLS) $53,500 RIS
- 2015-09-14 Sold (MLS) $18,500 RIS
- 2015-08-17 Pending — RIS
- 2015-07-10 Pending — RIS
- 2015-06-09 Listed $54,900 RIS
- 2015-05-19 Price Changed $29,900 RIS
- 2015-04-16 Price Changed $49,900 RIS
- 2015-03-31 Listed $53,900 RIS
- 2015-03-30 Listing Removed — RIS
- 2015-03-23 Listing Removed — RIS
- 2015-02-05 Listed $53,900 RIS
- 2014-11-24 Listed $59,900 RIS
- 2013-12-19 Price Changed $39,900 RIS
- 2013-09-30 Sold (MLS) $47,000 RIS
- 2013-06-26 Sold (MLS) $47,000 MLS PIN
- 2013-05-14 Listing Removed — RIS
- 2013-05-13 Listing Removed — MLS PIN
- 2013-02-21 Listed $59,900 RIS
- 2013-02-21 Listed $59,900 MLS PIN
- 2013-02-01 Sold (MLS) $50,000 RIS
- 2013-01-11 Listing Removed — RIS
- 2012-12-08 Sold (MLS) $32,500 RIS
- 2012-10-12 Listed $78,500 RIS
- 2012-08-29 Listing Removed — RIS
- 2012-07-31 Listed $39,900 RIS
- 2012-07-25 Listing Removed — RIS
- 2012-04-28 Listed $49,900 RIS
- 2011-09-30 Listing Removed — RIS
- 2011-05-26 Listed $97,500 RIS
- 2011-03-31 Listing Removed — RIS
- 2010-09-17 Listed $41,900 RIS
- 2010-07-21 Listing Removed — RIS
- 2010-06-15 Listed $57,000 RIS
Cash-flow waterfall
monthlySold comps — $/sqft
last 12 mo · ≤1 miLoading sold comps…