 🏷️ Likely Rental
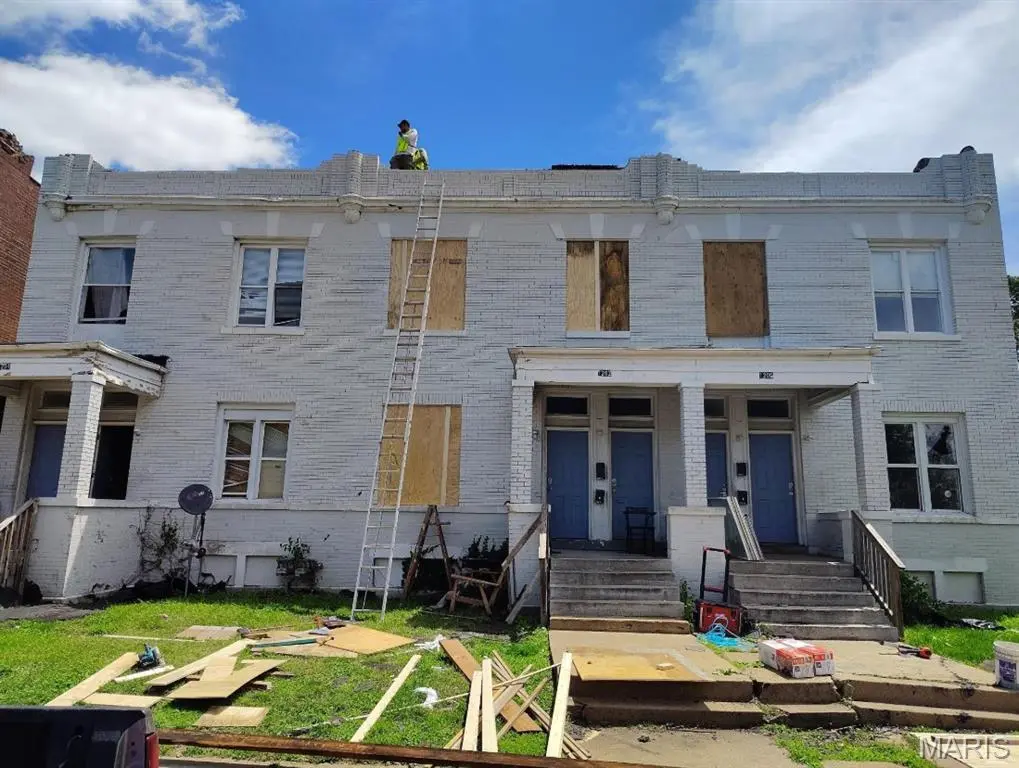
1200 N Euclid Ave · St. Louis, MO
Flood risk 1/10 · Minimal
- FEMA flood zone
- X (unshaded)
- Chance of flooding over 30 yrs
- 0.0%
- Est. flood insurance / yr
- $473 – $860
Fire risk 1/10 · Minimal
- Est. fire insurance / yr
- $1,054 – $1,958
Heat risk 5/10 · Moderate
- Hot days now (above 107°F)
- 7 days/yr
- Hot days in 30 yrs
- 21 days/yr
Wind risk 2/10 · Minimal
- Chance of severe wind over 30 yrs
- 1.0%
Air-quality risk 4/10 · Minor
- Unhealthy air days now
- 4 days/yr
- Unhealthy air days in 30 yrs
- 5 days/yr
Risk factors via First Street. Map © Google.
Why this score? — see what drove the D+ grade
The composite is a weighted blend of 9 inputs, each scored 0–100. Each bar is that input's sub-score; the figure is the points it added to the 100-point composite (weight × sub-score).
- Cash flow +15.0/30.0
- ARV discount +7.5/15.0
- 1% rule +5.0/10.0
- DSCR +5.0/10.0
- Appreciation +3.9/10.0
- Rent growth +2.5/5.0
- Livability +2.5/5.0
- Condition / age +2.5/5.0
- Schools +1.2/10.0
$69,950
🖨 Deal sheet (PDF) 📄 Offer letter ✓ Due diligence
Multi-family units
County records classify this as Multi-Family (5+ Unit). Listing-text estimate: 1 unit. estimate disagrees with records
5+ unit building — per-unit beds/baths from public records are typically unavailable; the breakdown below (if shown) is an estimate from the listing text.
Listing remarks
Building has tornado damage. Has a brand new roof, gutters, and downspouts but interior will need to be rehabbed. Rents ranged from $1,250-$1,450/month prior to the tornado.
Key facts
- Gutters
- Brand new roof
- Downspouts
Tags
Property features AI
Finance
- Other: Seller open to concessions
- Financial info: Total of 6 units in the building; One building on the lot; No units currently marked as leased
Exterior
- Home design: Residential income property; 5-family (5 units or more); Apartment building; Two levels
- Construction: Brick construction
- Exterior features: Lot of approximately 0.2576 acres; Located in the Fountain Park neighborhood
Interior
- Bedrooms: No main or upper level bedrooms indicated
- Bathrooms: No main or upper level bathrooms indicated
- Heating & cooling: Central Air
- Interior features: Central air conditioning
Neighborhood map
What this means for you Summary
Snapshot
- This is a multifamily listed at $70k.
Deal economics
- At list price, monthly cash flow is $5k ($61k/yr) — positive.
- The deal already cash-flows at list — no discount required.
- Meets the 1% rule at list price ($7k rent vs $70k).
- Recommended offer: $64k (9.0% below list) — sets the bar for market timing.
- Cap rate 93.3% vs local median 5.0% in St. Louis — top-decile yield for the area; either an underpriced asset or a hidden risk that comps aren't pricing in. Stress-test before assuming the spread holds.
Location & tenants
- Location reads: area grade D — affects rentability + tenant quality, not the cash-flow math above.
- St. Louis City (urban): math 10% / reading 18% proficiency, ranked #312 of 324 in MO (top 96%) — low school quality limits family demand, transient renter base, plan for 1-2y turnover; 80% free/reduced lunch — lower-income household profile, screen leases tightly.
- Zoned schools: Hickey Elem. (math 2% / reading 8%, grade F, #1,072 of 1,115 statewide, top 98%, 273 students, 99% FRL); Gateway Middle (math 0% / reading 8%, grade F, #389 of 391 statewide, top 100%, 506 students, 99% FRL); Sumner High (math 2% / reading 2%, grade F, #520 of 521 statewide, top 100%, 264 students, 99% FRL) — zoned schools average 99% FRL vs 80% district-wide (19 pts higher); higher-poverty schools than district average — tighter screening recommended.
- Market conditions: 58 active listings in the ZIP; 1 comparable units currently listed for rent nearby; 294 units permitted in St. Louis city in 2024 (227 in 5+ unit buildings).
Forward outlook
- Local home prices are declining (-2.1%/yr); year-one equity from $484 of loan paydown is wiped out by about $2k of value loss. Plan a longer hold.
- St. Louis County population projected to shrink 6% by 2050 — rents likely to lag national; underwrite the cash flow, not the appreciation.
- At projected returns (-2.1% appreciation + 3.0% rent growth), your $20k cash investment doubles in ~1 year — after that, you're playing with house money.
Negotiation context
- It's been on market 97 days — a 9% lower offer ($64k) is reasonable based on typical stale-listing flexibility.
- 7 sale attempts since 3y ago; this cycle's ask has dropped $80k (53%) from the opening price — seller is motivated, your offer sets the floor, not the list.
Risks & watch-outs
- Watch-outs: property tax is 3.0% of price; built in 1904 — expect roof / HVAC / electrical / plumbing capex.
- Climate carrying-cost: extreme-heat days projected 7→21/yr by 2055 (HVAC capex compounding) — expect insurance premiums to compound above CPI over the hold.
Questions for the listing agent
- It's been on market 97 days. Have you received any prior offers? Is the seller open to a 9% concession, seller financing, or rate buy-down credit?
- Built in 1904 — when were the roof, HVAC, electrical panel, plumbing, and water heater last replaced?
- Property tax is high relative to price — has the assessment been appealed recently, and will the sale trigger a re-assessment?
- Why hasn't it sold? Are there any deal-killer items the seller is aware of (foundation, flood, title, zoning, code violations)?
- Is there a deadline driving the sale (1031 exchange, divorce, estate, relocation)? That informs how much negotiation room exists.
- The area grade is low — what's the realistic commute time and amenity access for the typical tenant pool here? Any planned neighborhood developments (good or bad) we should know about?
- What's the average days-on-market for RENTAL listings here right now (not sales)? A rising rental-DOM trend means longer vacancies and softer asking-rent achievability than the comps imply.
- What's the recent tenant-quality profile in this submarket — average credit score on applications, eviction rate, late-payment / NSF rate, and stable-employment percentage? A property-management company in the area should have these aggregated.
- How much new apartment / multifamily construction is in the pipeline within 1–3 miles? Heavy new supply (>2% of stock underway) typically softens rents 12–24 months out; light construction supports rent growth.
Investment metrics
- 1% rule
- 10.21% ✓
- Cap rate
- 93.31%
- Cash-on-cash
- 310.77%
- DSCR
- 14.83
- GRM
- 0.8
CMA / ARV
- ARV (median comp)
- $145,107
- List price
- $69,950
- Delta
- -51.79%
- Verdict
- UNDERPRICED
- Comps
- 20 within 1.0 mi
Projected returns pro-forma
-2.14% appreciation · 3.0% rent growth · sell at horizon
- IRR
- —
- Equity multiple
- 17.05×
- Total profit
- $314,417
- Equity at exit
- $13,126
- IRR
- —
- Equity multiple
- 36.37×
- Total profit
- $692,676
- Equity at exit
- $10,782
Cash invested: $19,586 (down + closing). Projections, not guarantees.
Landlord ↔ Tenant lean methodology
- Overall (STATE)
- 81 Strongly Landlord-Friendly
- State Missouri
- 81 Strongly Landlord-Friendly · R+10
- County
- — inherits STATE
- City
- — inherits STATE
ZIP-level market 63113
- Home prices YoY
- -2.0%
- Active inventory
- 58
- Price-to-rent
- 2.4×
Monthly cashflow live
- Estimated rent
- $7,144 medium interval (Pro) →
- Mortgage (P&I)
- −$367
- Tax from tax record
- −$176 /mo · $2,106/yr
- Insurance
- −$29
- HOA
- −$0
- Vacancy / Maint / Mgmt
- −$1,500
- Net cashflow
- $5,072
Break-even live
Sensitivity live
| Price | -10% $5,112 | -5% $5,092 | +0% $5,072 | +5% $5,052 | +10% $5,033 |
|---|---|---|---|---|---|
| Rent | -10% $4,508 | -5% $4,790 | +0% $5,072 | +5% $5,354 | +10% $5,637 |
| Rate | -1.0pp $5,108 | -0.5pp $5,090 | base $5,072 | +0.5pp $5,054 | +1.0pp $5,036 |
3-unit breakdown (identical units grouped — click to expand)
| Units | Beds | Baths | Est. rent |
|---|---|---|---|
| 3× units | 1 | 1 | $7,143 |
| #1 | 1 | 1 | $2,381 |
| #2 | 1 | 1 | $2,381 |
| #3 | 1 | 1 | $2,381 |
| Total (3 units) | $7,144 | ||
UW: 25.0% down · 7.5% · 30yr · 1.5% tax · 5.0% vac · 8.0% maint · 8.0% mgmt
Financing live
Cash to close
- Down payment
- $17,488
- Closing costs
- $2,098
- Reserves months
- —
- Total cash needed
- —
Loan-product check · same deal, 3 products live
Conventional
25% down · 7.5% · 30yr
- Down + closing
- —
- Monthly P&I
- —
- Monthly cashflow
- —
- DSCR
- —
- Eligible?
- —
Personal DTI + credit; lowest rate.
DSCR
20% down · 8.5% · 30yr
- Down + closing
- —
- Monthly P&I
- —
- Monthly cashflow
- —
- DSCR
- —
- Eligible?
- —
No personal income docs; deal must DSCR.
Hard money
10% down · 12.0% · 12mo
- Down + closing
- —
- Monthly P&I
- —
- Monthly cashflow
- —
- DSCR
- —
- Eligible?
- —
Short-term bridge; refi at stabilization.
Rent comps 1 comps
| Address | Beds | Baths | Sqft | Rent | $/sqft | DOM | Units | Dist |
|---|---|---|---|---|---|---|---|---|
| 4512 Westminster Pl Saint Louis, MO | 3.0 | 2.0 | 11325 | $2,650 | $0.23 | 45d | 1 | 0.69mi |
Listing history 26 events
-
2026-06-02status $69,950 Pending 97 DOM
-
2026-06-01days on market $69,950 Active 97 DOM
-
2026-05-31days on market $69,950 Active 96 DOM
-
2026-05-15price $79,950
-
2026-05-06status Active
-
2026-04-07status Pending
-
2026-03-30price $89,950
-
2026-03-13price $99,950
-
2026-03-03status Active
-
2026-01-10status Pending
-
2026-01-08price $109,950
-
2025-12-12price $125,000
-
2025-12-05$150,000 Active
-
2024-06-08historical $925
-
2024-05-21$925
-
2024-05-09historical $895
-
2024-04-23price $895
-
2024-04-12$925
-
2024-04-10historical $1,195
-
2024-03-30price $1,195
-
2024-03-26$1,300
-
2024-03-14historical $1,300
-
2024-01-29price $1,300
-
2024-01-26price $995
-
2023-12-21$1,400
-
2006-11-15soldstatus $265,000
ⓘ Source: listings_history table (triggers on properties + properties_extension) + one-shot
backfill from property_details.listing_events for pre-trigger history.
Tax reassessment forecast MO · Resets to sale price
- Current annual tax
- $2,106 · $176/mo
- Projected year-2 tax
- $2,106 · $176/mo
- Expected delta
- $0/yr ($0/mo · 0.0%)
ⓘ Screening estimate from a state-policy table — verify with the county assessor before closing.
Climate risk First Street
- Flood 1/10 Low FEMA zone X (unshaded) · 0% chance over 30 yrs
- Wildfire 1/10 Low
- Heat 5/10 Major 7 d/yr ≥107°F today · 21 d/yr by 30 yrs out
- Wind 2/10 Low 100% chance of damaging wind over 30 yrs
- Air quality 4/10 Moderate 4 unhealthy d/yr today · 5 by 30 yrs out
Nearby sold comps map
Loading sold comps map…
Walkable amenities ~0.75 mi
Loading nearby amenities…
Taxation est. · year 1
- Rental income
- $85,728
- − Mortgage interest
- −$3,918
- − Property taxes
- −$2,106
- − Insurance
- −$350
- − Repairs & maintenance
- −$6,858
- − Management
- −$6,858
- − Depreciation
- −$2,035
- Taxable income
- $63,602
- Est. tax owed @ 24.0%
- −$15,265
- After-tax cash flow
- $45,603/yr
For passive investors: Depreciation is non-cash, so a rental often shows a tax loss while cash-flowing — sheltering income. Rental losses are passive: they offset passive income freely, and up to $25,000/yr can offset ordinary (W-2) income if you actively participate and your MAGI is under $100k (phasing out to $0 by $150k); unused losses carry forward. On sale, claimed depreciation is recaptured at up to 25%, and gains may owe capital-gains tax (a 1031 exchange can defer both). Figures are a year-1 estimate at your 24.0% rate — not tax advice; consult a CPA.
Schools (NCES district)
- District
- St. Louis City
- NCES district ID
- 2929280
- Math proficiency
- 10% ▼ -6.00%
- Reading proficiency
- 18% ▼ -3.00%
- Median HH income
- $35,685
- Composite
- 11.54/100
- National rank
- #9699
- State rank
- #312 of 324 in MO
Livability — St. Louis
No livability data for this city. (Only ~50 U.S. cities are tracked.)
Census & demographics
- Census place
- St. Louis, MO
- City population
- 283,259
- Population (ZIP)
- 11,610
Population outlook (St. Louis County) Hauer SSP2
- Today (2025)
- 315,737 people
- By 2030
- 313,865 · -0.6%
- By 2040
- 305,439 · -3.3%
- By 2050
- 296,529 · -6.1%
- By 2075
- 271,028 · -14.2%
- By 2100
- 255,359 · -19.1%
Race, ethnicity, and origin ACS 2023
- Neighborhood character
- Predominantly Black (91%)
- Race & ethnicity
- Black 91% White 6% Two or more races 2% Hispanic / Latino 1%
- Foreign-born
- 2% · Canada
Political lean MEDSL · St. Louis
- 2024 margin
- Solid D (+64.7) · D 81.4% · R 16.7% · Other 2.0%
- 2008→2024 swing
- -3.5pp toward R · 2008: 68.2pp · 2024: 64.7pp
- All cycles
- 2024: D+64.7 2020: D+66.2 2016: D+63.7 2012: D+66.6 2008: D+68.2
Not yet ingested
- Civics
- —
Market trends
- HPI YoY
- ▼ -2.14%
- Current HPI
- 107.1335
- Rent YoY
- —
- Metro
- —
- State GDP YoY
- ▲ 1.84%
- F500 in state
- 20
Industry mix (Fortune 500 HQ in MO)
| Industry | F500 HQs | Revenue |
|---|---|---|
| Healthcare | 1 | $163B |
|
||
| Insurance | 1 | $21B |
|
||
| Industrial Technology | 1 | $17B |
|
||
| Retail | 1 | $16B |
|
||
| Industrial Distribution | 1 | $10B |
|
||
| Utilities | 1 | $9B |
|
||
Price history
-69.8% since first listed23 events — show timeline
- 2026-05-15 Price Changed $79,950 MARIS as Distributed by MLS Grid
- 2026-05-06 Relisted — MARIS as Distributed by MLS Grid
- 2026-04-07 Pending — MARIS as Distributed by MLS Grid
- 2026-03-30 Price Changed $89,950 MARIS as Distributed by MLS Grid
- 2026-03-13 Price Changed $99,950 MARIS as Distributed by MLS Grid
- 2026-03-03 Relisted — MARIS as Distributed by MLS Grid
- 2026-01-10 Pending — MARIS as Distributed by MLS Grid
- 2026-01-08 Price Changed $109,950 MARIS as Distributed by MLS Grid
- 2025-12-12 Price Changed $125,000 MARIS as Distributed by MLS Grid
- 2025-12-05 Listed $150,000 MARIS as Distributed by MLS Grid
- 2024-06-08 Rental Removed $925 APPFOLIO
- 2024-05-21 Listed for Rent $925 APPFOLIO
- 2024-05-09 Rental Removed $895 APPFOLIO
- 2024-04-23 Price Changed $895 APPFOLIO
- 2024-04-12 Listed for Rent $925 APPFOLIO
- 2024-04-10 Rental Removed $1,195 APPFOLIO
- 2024-03-30 Price Changed $1,195 APPFOLIO
- 2024-03-26 Listed for Rent $1,300 APPFOLIO
- 2024-03-14 Rental Removed $1,300 APPFOLIO
- 2024-01-29 Price Changed $1,300 APPFOLIO
- 2024-01-26 Price Changed $995 APPFOLIO
- 2023-12-21 Listed for Rent $1,400 APPFOLIO
- 2006-11-15 Sold (Public Records) $265,000 Public Records
Property tax history
+3.0%/yrLatest (2023): $2,106 · -3.7% YoY. Source: county tax records.
Cash-flow waterfall
monthlySold comps — $/sqft
last 12 mo · ≤1 miLoading sold comps…