4720 NE Sandpebble Trce #305 · Sewall's Point, FL
Flood risk 9/10 · Severe
- FEMA flood zone
- AO
- Chance of flooding over 30 yrs
- 0.99%
- Est. flood insurance / yr
- $848 – $2,087
Fire risk 1/10 · Minimal
- Est. fire insurance / yr
- $947 – $1,759
Heat risk 10/10 · Severe
- Hot days now (above 106°F)
- 7 days/yr
- Hot days in 30 yrs
- 24 days/yr
Wind risk 10/10 · Severe
- Chance of severe wind over 30 yrs
- 99.0%
Air-quality risk 2/10 · Minimal
- Unhealthy air days now
- 2 days/yr
- Unhealthy air days in 30 yrs
- 2 days/yr
Risk factors via First Street. Map © Google.
Why this score? — see what drove the D grade
The composite is a weighted blend of 9 inputs, each scored 0–100. Each bar is that input's sub-score; the figure is the points it added to the 100-point composite (weight × sub-score).
- ARV discount +12.4/15.0
- Appreciation +10.0/10.0
- Cash flow +5.3/30.0
- Schools +4.5/10.0
- 1% rule +3.5/10.0
- Rent growth +2.5/5.0
- Livability +2.5/5.0
- Condition / age +2.5/5.0
- DSCR +0.0/10.0
$430,000
🖨 Deal sheet (PDF) 📄 Offer letter ✓ Due diligence
Listing remarks MLS
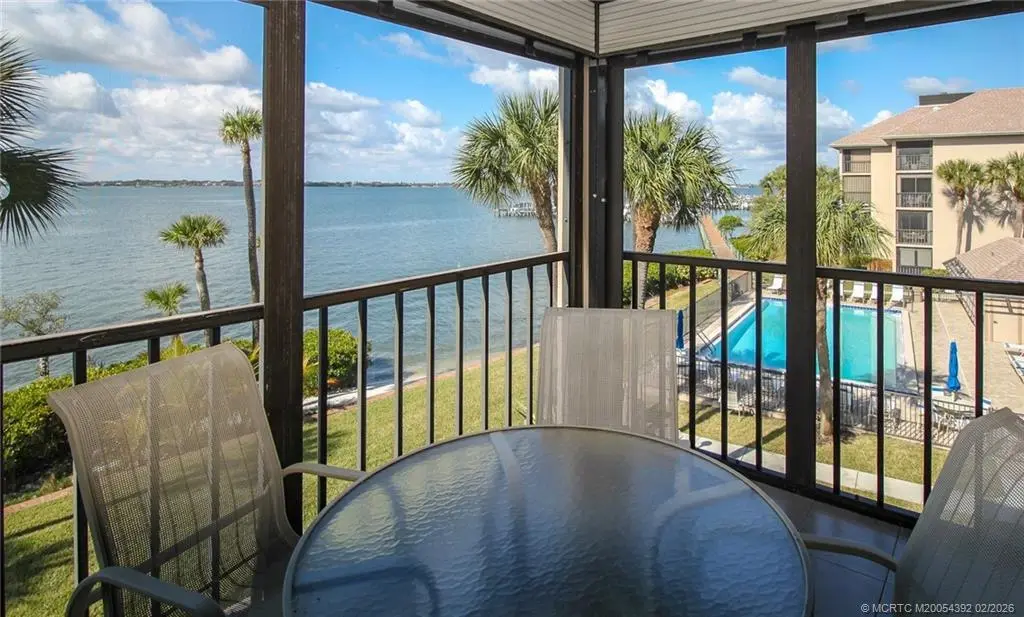
Bright, updated, and move-in ready 2-bed, 2-bath condominium offering sunny interiors and wide Intracoastal Waterway views. This fully furnished residence features a smart, split floor plan, a white kitchen with granite countertops, a 2025 A/C, partial impact windows, and an inviting coastal feel throughout. Enjoy private beach access just steps away plus resort-style amenities including 5 heated pools, pickleball, tennis, kayak storage, and boat slips for rent (based on availability). Located in a vibrant, social community, this is the perfect island retreat, seasonal escape, or investment opportunity—close out each day to the relaxing sound of waves.
Key facts
- Tennis
- Pickleball
- 5 heated pools
Tags
Neighborhood map
What this means for you Summary
Snapshot
- This is a 2-bed/2.0-bath condo listed at $430k.
Deal economics
- At list price, monthly cash flow is $-1k ($-13k/yr) — negative.
- To cash-flow at today's rent, offer at most $241k (43.9% below list).
- To meet the 1% rule (rent ≥ 1% of price), the offer needs to be $366k (15.0% below list).
- Recommended offer: $241k (43.9% below list) — sets the bar for cash-flow.
- Cap rate 3.6% vs local median 0.5% in Sewall's Point — top-decile yield for the area; either an underpriced asset or a hidden risk that comps aren't pricing in. Stress-test before assuming the spread holds.
Location & tenants
- Location reads: area grade D — affects rentability + tenant quality, not the cash-flow math above.
- Martin (suburban): math 52% / reading 53% proficiency, ranked #24 of 73 in FL (top 33%) — acceptable for families but not a draw, mixed tenant base, ~2y average lease.
- Zoned schools: Felix A Williams Elementary School (math 61% / reading 67%, grade B, #552 of 2,144 statewide, top 26%, 531 students, 40% FRL); Stuart Middle School (math 55% / reading 55%, grade B-, #180 of 571 statewide, top 32%, 867 students, 49% FRL); Jensen Beach High School (math 53% / reading 71%, grade B-, #98 of 667 statewide, top 15%, 1,584 students, 36% FRL) — zoned schools at 42% FRL track the district average.
- Market conditions: 252 active listings in the ZIP; 19 comparable units currently listed for rent nearby; rentals at typical pace (median 26d on market — plan ~3-4 weeks tenant-placement turnaround); solid renter incomes; 737 units permitted in Martin County in 2024 (167 in 5+ unit buildings).
- At $3,655/mo this rent would consume 52% of the median local household income ($84k/yr) (locally 247% of renters already pay >50% of income on rent) — very limited rent-growth headroom before tenants either downsize or default.
Forward outlook
- In year one you build about $46k of equity ($3k loan paydown + $43k appreciation (10.0% local appreciation)).
- Martin County population projected at +19% by 2050 — long-run rental-demand tailwind backs the buy-and-hold thesis.
- By year 2, paydown + projected appreciation supports a ~$74k cash-out refi (75% LTV) — recoverable capital for the next deal without selling this one.
Negotiation context
- It's been on market 125 days — a 12% lower offer ($378k) is reasonable based on typical stale-listing flexibility.
- Current owner paid $183k; list at $430k implies a 135% gain — meaningful room to come down on a strong offer.
Risks & watch-outs
- Watch-outs: flood insurance adds $122/mo; HOA is 25% of rent.
- Climate carrying-cost: in FEMA flood zone AO (mandatory federal flood insurance); severe wind risk, 99% chance of damaging wind over 30y; extreme-heat days projected 7→24/yr by 2055 (HVAC capex compounding) — expect insurance premiums to compound above CPI over the hold.
Questions for the listing agent
- What do current leases actually rent for vs. the listed asking? Can we see a recent rent roll and the last 12 months of T-12 income?
- It's been on market 125 days. Have you received any prior offers? Is the seller open to a 44% concession, seller financing, or rate buy-down credit?
- What's the actual annual flood-insurance premium (NFIP or private), and is the property in a SFHA with mandatory coverage?
- What does the HOA fee cover, when was the last increase, and are there any pending special assessments or reserve-fund shortfalls?
- Any open or pending special assessments — roof, HVAC, plumbing, elevator, façade? What's the per-unit balance and payoff schedule, and is the seller paying it off at close or rolling it to the buyer?
- Why hasn't it sold? Are there any deal-killer items the seller is aware of (foundation, flood, title, zoning, code violations)?
- Is there a deadline driving the sale (1031 exchange, divorce, estate, relocation)? That informs how much negotiation room exists.
- The area grade is low — what's the realistic commute time and amenity access for the typical tenant pool here? Any planned neighborhood developments (good or bad) we should know about?
- What's the average days-on-market for RENTAL listings here right now (not sales)? A rising rental-DOM trend means longer vacancies and softer asking-rent achievability than the comps imply.
- What's the recent tenant-quality profile in this submarket — average credit score on applications, eviction rate, late-payment / NSF rate, and stable-employment percentage? A property-management company in the area should have these aggregated.
- How much new apartment / multifamily construction is in the pipeline within 1–3 miles? Heavy new supply (>2% of stock underway) typically softens rents 12–24 months out; light construction supports rent growth.
Investment metrics
- 1% rule
- 0.85% ✗
- Cap rate
- 3.65%
- Cash-on-cash
- -9.44%
- DSCR
- 0.58
- GRM
- 9.8
CMA / ARV
- ARV (median comp)
- $482,611
- List price
- $430,000
- Delta
- -10.90%
- Verdict
- UNDERPRICED
- Comps
- 20 within 1.0 mi
Projected returns pro-forma
10.0% appreciation · 3.0% rent growth · sell at horizon
- IRR
- 16.9%
- Equity multiple
- 2.38×
- Total profit
- $166,738
- Equity at exit
- $387,378
- IRR
- 16.1%
- Equity multiple
- 5.53×
- Total profit
- $545,893
- Equity at exit
- $835,395
Cash invested: $120,400 (down + closing). Projections, not guarantees.
Landlord ↔ Tenant lean methodology
- Overall (STATE)
- 87 Strongly Landlord-Friendly
- State Florida
- 87 Strongly Landlord-Friendly · R+3
- County
- — inherits STATE
- City
- — inherits STATE
ZIP-level market 34996
- Home prices YoY
- 2.1%
- Active inventory
- 252
- Price-to-rent
- 9.8×
Monthly cashflow live
- Estimated rent
- $3,655 high interval (Pro) →
- Mortgage (P&I)
- −$2,255
- Tax from tax record
- −$482 /mo · $5,780/yr
- Insurance
- −$179
- Flood insurance flood zone
- −$122 /mo · $1,468/yr
- HOA
- −$919
- Vacancy / Maint / Mgmt
- −$768
- Net cashflow
- $-1,069
Break-even live
Sensitivity live
| Price | -10% $-826 | -5% $-948 | +0% $-1,069 | +5% $-1,191 | +10% $-1,313 |
|---|---|---|---|---|---|
| Rent | -10% $-1,358 | -5% $-1,214 | +0% $-1,069 | +5% $-925 | +10% $-781 |
| Rate | -1.0pp $-853 | -0.5pp $-960 | base $-1,069 | +0.5pp $-1,181 | +1.0pp $-1,294 |
UW: 25.0% down · 7.5% · 30yr · 1.5% tax · 5.0% vac · 8.0% maint · 8.0% mgmt
Financing live
Cash to close
- Down payment
- $107,500
- Closing costs
- $12,900
- Reserves months
- —
- Total cash needed
- —
Loan-product check · same deal, 3 products live
Conventional
25% down · 7.5% · 30yr
- Down + closing
- —
- Monthly P&I
- —
- Monthly cashflow
- —
- DSCR
- —
- Eligible?
- —
Personal DTI + credit; lowest rate.
DSCR
20% down · 8.5% · 30yr
- Down + closing
- —
- Monthly P&I
- —
- Monthly cashflow
- —
- DSCR
- —
- Eligible?
- —
No personal income docs; deal must DSCR.
Hard money
10% down · 12.0% · 12mo
- Down + closing
- —
- Monthly P&I
- —
- Monthly cashflow
- —
- DSCR
- —
- Eligible?
- —
Short-term bridge; refi at stabilization.
Rent comps 19 comps
| Address | Beds | Baths | Sqft | Rent | $/sqft | DOM | Units | Dist |
|---|---|---|---|---|---|---|---|---|
| 4720 NE Sandpebble Trce #403 Stuart, FL | 2.0 | 2.0 | 1032 | $2,800 | $2.71 | 25d | 1 | 0.03mi |
| 4620 NE Sandpebble Trce #104 Stuart, FL | 2.0 | 2.0 | 1032 | $2,200 | $2.13 | 25d | 1 | 0.09mi |
| 2571 NE Ocean Blvd Stuart, FL | 2.0 | 2.0 | 1354 | $3,250 | $2.40 | 25d | 1 | 0.17mi |
| 2491 NE Ocean Blvd #302 Stuart, FL | 2.0 | 2.0 | 1436 | $3,250 | $2.26 | 16d | 1 | 0.17mi |
| 2641 NE Ocean Blvd #405 Stuart, FL | 2.0 | 2.0 | 1436 | $7,000 | $4.87 | 25d | 1 | 0.18mi |
| 2375 NE Ocean Blvd Unit E402 Stuart, FL | 2.0 | 2.0 | 1227 | $3,500 | $2.85 | 25d | 1 | 0.20mi |
| 4540 NE Sandpebble Trce #104 Stuart, FL | 2.0 | 2.0 | 1032 | $2,400 | $2.33 | 25d | 1 | 0.20mi |
| 4440 NE Sandpebble Trce #201 Stuart, FL | 2.0 | 2.0 | 1233 | $6,000 | $4.87 | 25d | 1 | 0.28mi |
| 4440 NE Sandpebble Trce #104 Stuart, FL | 2.0 | 2.0 | 1032 | $6,500 | $6.30 | 25d | 1 | 0.28mi |
| 3541 NE Ocean Blvd Jensen Beach, FL | 2.0 | 2.0 | 1093 | $3,575 | $3.27 | 25d | 2 | 0.29mi |
| 2355 NE Ocean Blvd Unit 1-19B Stuart, FL | 2.0 | 2.0 | 1197 | $6,200 | $5.18 | 25d | 1 | 0.37mi |
| 2355 NE Ocean Blvd Unit 1-20A Stuart, FL | 1.0 | 1.0 | 937 | $2,900 | $3.09 | 25d | 1 | 0.37mi |
| 2355 NE Ocean Blvd Unit 1-7A Stuart, FL | 1.0 | 1.0 | 937 | $3,800 | $4.06 | 25d | 1 | 0.37mi |
| 1550 NE Ocean Blvd Stuart, FL | 2.0 | 2.0 | 1101 | $2,125 | $1.93 | 25d | 2 | 0.73mi |
| 1501 NE Ocean Blvd #2 Stuart, FL | 2.0 | 1.5 | 925 | $4,300 | $4.65 | 25d | 1 | 0.99mi |
| 1357 NE Ocean Blvd #312 Stuart, FL | 2.0 | 2.0 | 1242 | $5,500 | $4.43 | 25d | 1 | 1.09mi |
| 1357 NE Ocean Blvd Stuart, FL | 2.0 | 2.0 | 1204 | $5,250 | $4.36 | 23d | 2 | 1.09mi |
| 1289 NE Ocean Blvd Stuart, FL | 2.0 | 2.0 | 1234 | $5,700 | $4.62 | 23d | 5 | 1.19mi |
| 3792 NE Ocean Blvd Jensen Beach, FL | 2.0 | 2.0 | 1204 | $3,000 | $2.49 | 25d | 2 | 1.24mi |
HOA detail condo
- Monthly dues
- $919 · $11,028/yr
- Likely covers
- waterpool
- Assessments
- None detected in remarks — confirm with the listing agent.
Listing history 20 events
-
2026-06-21days on market $430,000 Active 125 DOM
-
2026-06-18days on market $430,000 Active 122 DOM
-
2026-06-17days on market $430,000 Active 121 DOM
-
2026-06-16days on market $430,000 Active 120 DOM
-
2026-06-15days on market $430,000 Active 119 DOM
-
2026-06-14days on market $430,000 Active 117 DOM
-
2026-06-13days on market $430,000 Active 116 DOM
-
2026-06-10days on market $430,000 Active 114 DOM
-
2026-06-09days on market $430,000 Active 113 DOM
-
2026-06-08days on market $430,000 Active 112 DOM
-
2026-06-07days on market $430,000 Active 111 DOM
-
2026-06-03days on market $430,000 Active 107 DOM
-
2026-06-02days on market $430,000 Active 106 DOM
-
2026-06-01days on market $430,000 Active 105 DOM
-
2026-05-31days on market $430,000 Active 104 DOM
-
2026-05-31days on market $430,000 Active 103 DOM
-
2026-02-16$440,000 Active 666-char remark
Show marketing remark (666 chars)
Bright, updated, and move-in ready 2-bed, 2-bath condominium offering sunny interiors and wide Intracoastal Waterway views. This fully furnished residence features a smart, split floor plan, a white kitchen with granite countertops, a 2025 A/C, partial impact windows, and an inviting coastal feel throughout. Enjoy private beach access just steps away plus resort-style amenities including 5 heated pools, pickleball, tennis, kayak storage, and boat slips for rent (based on availability). Located in a vibrant, social community, this is the perfect island retreat, seasonal escape, or investment opportunity—close out each day to the relaxing sound of waves.
-
2002-01-17soldstatus $183,000
-
1989-05-16soldstatus $119,000
-
1982-06-01soldstatus $130,000
ⓘ Source: listings_history table (triggers on properties + properties_extension) + one-shot
backfill from property_details.listing_events for pre-trigger history.
Tax reassessment forecast FL · Resets to sale price
- Current annual tax
- $5,780 · $482/mo
- Projected year-2 tax
- $5,780 · $482/mo
- Expected delta
- $0/yr ($0/mo · 0.0%)
ⓘ Screening estimate from a state-policy table — verify with the county assessor before closing.
Climate risk First Street
- Flood 9/10 Extreme FEMA zone AO · 99% chance over 30 yrs
- Wildfire 1/10 Low
- Heat 10/10 Extreme 7 d/yr ≥106°F today · 24 d/yr by 30 yrs out
- Wind 10/10 Extreme 99% chance of damaging wind over 30 yrs
- Air quality 2/10 Low 2 unhealthy d/yr today · 2 by 30 yrs out
Nearby sold comps map
Loading sold comps map…
Walkable amenities ~0.75 mi
Loading nearby amenities…
Taxation est. · year 1
- Rental income
- $43,863
- − Mortgage interest
- −$24,087
- − Property taxes
- −$5,780
- − Insurance
- −$3,618
- − Repairs & maintenance
- −$3,509
- − Management
- −$3,509
- − HOA
- −$11,028
- − Depreciation
- −$12,509
- Taxable loss
- −$20,176
- Est. tax savings @ 24.0%
- +$4,842
- After-tax cash flow
- $-7,991/yr
For passive investors: Depreciation is non-cash, so a rental often shows a tax loss while cash-flowing — sheltering income. Rental losses are passive: they offset passive income freely, and up to $25,000/yr can offset ordinary (W-2) income if you actively participate and your MAGI is under $100k (phasing out to $0 by $150k); unused losses carry forward. On sale, claimed depreciation is recaptured at up to 25%, and gains may owe capital-gains tax (a 1031 exchange can defer both). Figures are a year-1 estimate at your 24.0% rate — not tax advice; consult a CPA.
Schools (NCES district)
- District
- Martin
- NCES district ID
- 1201290
- Math proficiency
- 52% ▼ -14.00%
- Reading proficiency
- 53% ▼ -4.00%
- Median HH income
- $52,482
- Composite
- 45.1/100
- National rank
- #2690
- State rank
- #24 of 73 in FL
Livability — Sewall's Point
No livability data for this city. (Only ~50 U.S. cities are tracked.)
Census & demographics
- County
- Martin County · 165,223 people
- City population
- 10,875
- Metro
- Port St. Lucie, FL
- Population (ZIP)
- 10,653
- Household income
- $83,929
- Rent vs Own
- Severe rent burden
- 247.0
Population outlook (Martin County) Hauer SSP2
- Today (2025)
- 172,383 people
- By 2030
- 180,192 · +4.5%
- By 2040
- 194,114 · +12.6%
- By 2050
- 204,992 · +18.9%
- By 2075
- 229,641 · +33.2%
- By 2100
- 232,146 · +34.7%
Race, ethnicity, and origin ACS 2023
- Neighborhood character
- Predominantly White (90%)
- Race & ethnicity
- White 90% Hispanic / Latino 7% Two or more races 5%
- Hispanic origin (detail)
- Puerto Rican 2%
- Common ancestry
- Italian 3% Romanian 3% Slovak 3%
- Foreign-born
- 6% · Canada
- Languages at home
- 94% English-only · Spanish 3% Other Indo-European 1% French/Haitian/Cajun 1%
Political lean MEDSL · Martin
- 2024 margin
- Solid R (+31.1) · D 34.1% · R 65.2%
- 2008→2024 swing
- -17.5pp toward R · 2008: -13.6pp · 2024: -31.1pp
- All cycles
- 2024: R+31.1 2020: R+24.6 2016: R+26.9 2012: R+22.9 2008: R+13.6
Not yet ingested
- Civics
- —
Market trends
- HPI YoY
- ▲ 13.71%
- Current HPI
- 658.96
- Rent YoY
- —
- Metro
- Port St. Lucie, FL
- State GDP YoY
- ▲ 3.28%
- F500 in state
- 36
Industry mix (Fortune 500 HQ in FL)
| Industry | F500 HQs | Revenue |
|---|---|---|
| Industrial Technology | 2 | $29B |
|
||
| Insurance | 2 | $17B |
|
||
| Retail | 1 | $60B |
|
||
| Technology Distribution | 1 | $58B |
|
||
| Homebuilding | 1 | $35B |
|
||
| Technology Manufacturing | 1 | $35B |
|
||
Price history
+238.5% since first listed4 events — show timeline
- 2026-02-16 Listed $440,000 MCRTC
- 2002-01-17 Sold (Public Records) $183,000 Public Records
- 1989-05-16 Sold (Public Records) $119,000 Public Records
- 1982-06-01 Sold (Public Records) $130,000 Public Records
Property tax history
+5.8%/yrLatest (2025): $5,780 · -7.1% YoY. Source: county tax records.
Cash-flow waterfall
monthlySold comps — $/sqft
last 12 mo · ≤1 miLoading sold comps…