415 Pr 7519 · Frankston, TX
Flood risk 1/10 · Minimal
- FEMA flood zone
- X (unshaded)
- Chance of flooding over 30 yrs
- 0.0%
- Est. flood insurance / yr
- $507 – $1,088
Fire risk 3/10 · Minor
- Est. fire insurance / yr
- $1,222 – $2,270
Heat risk 6/10 · Moderate
- Hot days now (above 109°F)
- 6 days/yr
- Hot days in 30 yrs
- 22 days/yr
Wind risk 6/10 · Moderate
- Chance of severe wind over 30 yrs
- 64.0%
Air-quality risk 1/10 · Minimal
- Unhealthy air days now
- 0 days/yr
- Unhealthy air days in 30 yrs
- 0 days/yr
Risk factors via First Street. Map © Google.
Why this score? — see what drove the D grade
The composite is a weighted blend of 9 inputs, each scored 0–100. Each bar is that input's sub-score; the figure is the points it added to the 100-point composite (weight × sub-score).
- Appreciation +10.0/10.0
- ARV discount +7.5/15.0
- Cash flow +7.1/30.0
- Schools +4.4/10.0
- Livability +3.1/5.0
- Rent growth +2.5/5.0
- Condition / age +2.5/5.0
- 1% rule +1.9/10.0
- DSCR +1.3/10.0
$195,000
🖨 Deal sheet 📄 Offer letter ✓ Due diligence
Listing remarks
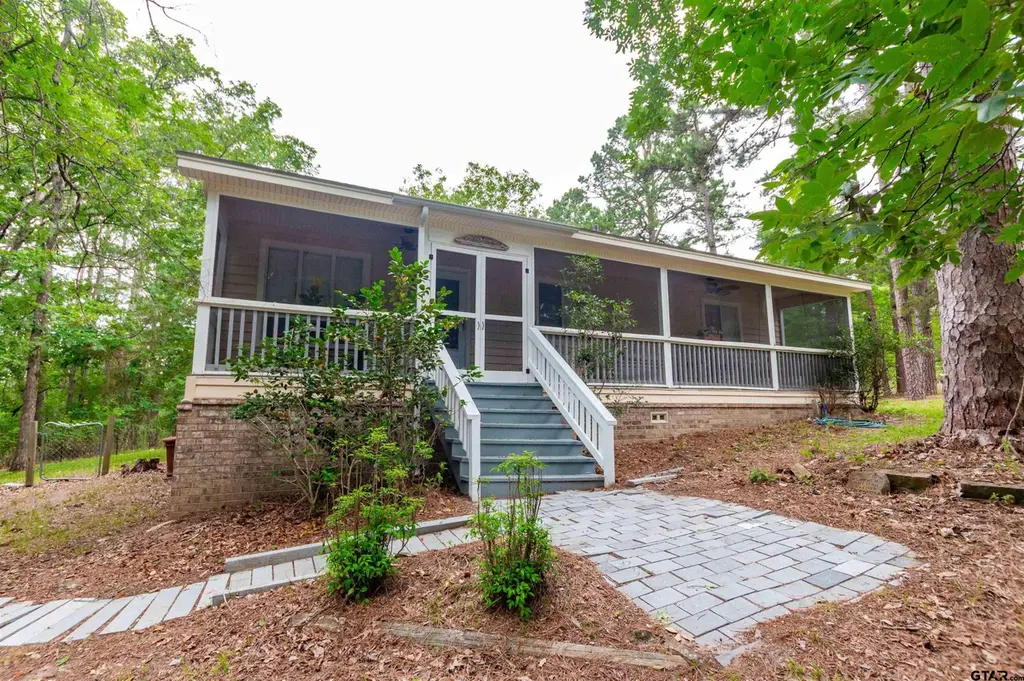
Welcome to this peaceful 3-bedroom, 2-bath home offering 1,144 square feet of living space with a 2-car carport on 2.11 beautiful acres in the Pineywoods subdivision on Pineywoods Lake. With a waterfront lot located directly across the road and the home sitting across from the 2nd fairway of Pine Dunes Golf Course, this property offers a rare combination of peaceful lake living and golf course views. The property also includes a 240-square-foot fishing shack that doubles as an art studio, along with a 168-square-foot storage shack near the water—perfect for storing lake gear, tools, or outdoor equipment. As you arrive, you’re welcomed by the serene atmosphere and natural beauty
Key facts
- Screened-in porch
- Art studio
- Waterfront lot
Tags
Property features AI
Finance
- HOA & community: Homeowners association with $100 monthly fee
Exterior
- Security: Smoke detector(s)
- Utilities: Septic tank
- Home design: Single family detached residence; One story; Home warranty included
- Construction: Composition roof
- Exterior features: Covered patio/porch; On-the-waterfront lot; Storage structure; Satellite dish; Waterfront on Pineywoods
Interior
- Kitchen: Dishwasher; Electric oven; Electric range
- Flooring: Carpet; Tile
- Bathrooms: 2 full bathrooms
- Heating & cooling: Central heating (electric); Central air; Ceiling fan(s)
- Interior features: Pantry
- Laundry & utility: Electric water heater
Neighborhood map
What this means for you Summary
Snapshot
- This is a 3-bed/2.0-bath single-family listed at $195k.
Deal economics
- At list price, monthly cash flow is $-280 ($-3k/yr) — negative.
- To cash-flow at today's rent, offer at most $146k (25.3% below list).
- To meet the 1% rule (rent ≥ 1% of price), the offer needs to be $135k (30.5% below list).
- Recommended offer: $135k (30.5% below list) — sets the bar for 1% rule.
Location & tenants
- Location reads 62/100 on livability (#918 in TX) — a middle-class / working-renter tenant base. Strengths: cost of living A+; Watch: schools C-, employment D+, amenities F.
- Neches ISD (rural): math 55% / reading 45% proficiency, ranked #379 of 1,141 in TX (top 33%) — acceptable for families but not a draw, mixed tenant base, ~2y average lease.
- Market conditions: 191 active listings in the ZIP; 29 units permitted in Anderson County in 2024 (0 in 5+ unit buildings).
Forward outlook
- In year one you build about $21k of equity ($1k loan paydown + $20k appreciation (10.0% local appreciation)).
- Anderson County population projected at +4% by 2050 — modest demand growth; plan on rents tracking national, not racing it.
- By year 2, paydown + projected appreciation supports a ~$34k cash-out refi (75% LTV) — recoverable capital for the next deal without selling this one.
Negotiation context
- It's been on market 19 days — a 2% lower offer ($192k) is reasonable based on typical stale-listing flexibility.
Risks & watch-outs
- Climate carrying-cost: major wind risk, 64% chance of damaging wind over 30y; extreme-heat days projected 6→22/yr by 2055 (HVAC capex compounding) — expect insurance premiums to compound above CPI over the hold.
Questions for the listing agent
- What do current leases actually rent for vs. the listed asking? Can we see a recent rent roll and the last 12 months of T-12 income?
- What does the HOA fee cover, when was the last increase, and are there any pending special assessments or reserve-fund shortfalls?
- Is there a deadline driving the sale (1031 exchange, divorce, estate, relocation)? That informs how much negotiation room exists.
- The area grade is low — what's the realistic commute time and amenity access for the typical tenant pool here? Any planned neighborhood developments (good or bad) we should know about?
- What's the average days-on-market for RENTAL listings here right now (not sales)? A rising rental-DOM trend means longer vacancies and softer asking-rent achievability than the comps imply.
- What's the recent tenant-quality profile in this submarket — average credit score on applications, eviction rate, late-payment / NSF rate, and stable-employment percentage? A property-management company in the area should have these aggregated.
- How much new for-sale + rental construction is in the pipeline within 1–3 miles? Heavy new supply typically softens prices + rents 12–24 months out; constrained supply supports both.
Investment metrics
- 1% rule
- 0.69% ✗
- Cap rate
- 4.57%
- Cash-on-cash
- -6.15%
- DSCR
- 0.73
- GRM
- 12.0
CMA / ARV
No comps found within radius.
Projected returns pro-forma
10.0% appreciation · 3.0% rent growth · sell at horizon
- IRR
- 19.9%
- Equity multiple
- 2.62×
- Total profit
- $88,409
- Equity at exit
- $175,671
- IRR
- 18.3%
- Equity multiple
- 6.03×
- Total profit
- $274,404
- Equity at exit
- $378,842
Cash invested: $54,600 (down + closing). Projections, not guarantees.
Landlord ↔ Tenant lean methodology
- Overall (STATE)
- 87 Strongly Landlord-Friendly
- State Texas
- 87 Strongly Landlord-Friendly · R+5
- County
- — inherits STATE
- City
- — inherits STATE
ZIP-level market 75763
- Home prices YoY
- 22.2%
- Active inventory
- 191
- Price-to-rent
- 12.0×
Monthly cashflow live
- Estimated rent
- $1,355 medium interval (Pro) →
- Mortgage (P&I)
- −$1,023
- Tax from tax record
- −$146 /mo · $1,754/yr
- Insurance
- −$81
- HOA
- −$100
- Vacancy / Maint / Mgmt
- −$285
- Net cashflow
- $-280
Break-even live
UW: 25.0% down · 7.5% · 30yr · 1.5% tax · 5.0% vac · 8.0% maint · 8.0% mgmt
Financing live
Cash to close
- Down payment
- $48,750
- Closing costs
- $5,850
- Reserves months
- —
- Total cash needed
- —
Loan-product check · same deal, 3 products live
Conventional
25% down · 7.5% · 30yr
- Down + closing
- —
- Monthly P&I
- —
- Monthly cashflow
- —
- DSCR
- —
- Eligible?
- —
Personal DTI + credit; lowest rate.
DSCR
20% down · 8.5% · 30yr
- Down + closing
- —
- Monthly P&I
- —
- Monthly cashflow
- —
- DSCR
- —
- Eligible?
- —
No personal income docs; deal must DSCR.
Hard money
10% down · 12.0% · 12mo
- Down + closing
- —
- Monthly P&I
- —
- Monthly cashflow
- —
- DSCR
- —
- Eligible?
- —
Short-term bridge; refi at stabilization.
HOA detail
- Monthly dues
- $100 · $1,200/yr
- Likely covers
- water
Listing history 12 events
-
2026-06-12statusdays on market $195,000 Pending 19 DOM
-
2026-06-09days on market $195,000 Active 18 DOM
-
2026-06-08days on market $195,000 Active 17 DOM
-
2026-06-07days on market $195,000 Active 16 DOM
-
2026-06-05days on market $195,000 Active 14 DOM
-
2026-06-04days on market $195,000 Active 12 DOM
-
2026-06-02days on market $195,000 Active 11 DOM
-
2026-06-01days on market $195,000 Active 10 DOM
-
2026-05-31days on market $195,000 Active 9 DOM
-
2026-05-31days on market $195,000 Active 8 DOM
-
2026-05-22$195,000 Active
-
2002-04-24soldstatus
ⓘ Source: listings_history table (triggers on properties + properties_extension) + one-shot
backfill from property_details.listing_events for pre-trigger history.
Tax reassessment forecast TX · Resets to sale price
- Current annual tax
- $1,754 · $146/mo
- Projected year-2 tax
- $3,568 · $297/mo
- Expected delta
- +$1,815/yr (+$151/mo · 103.5%)
ⓘ Screening estimate from a state-policy table — verify with the county assessor before closing.
Climate risk First Street
- Flood 1/10 Low FEMA zone X (unshaded) · 0% chance over 30 yrs
- Wildfire 3/10 Moderate
- Heat 6/10 Major 6 d/yr ≥109°F today · 22 d/yr by 30 yrs out
- Wind 6/10 Major 64% chance of damaging wind over 30 yrs
- Air quality 1/10 Low 0 unhealthy d/yr today · 0 by 30 yrs out
Nearby sold comps map
Loading sold comps map…
Walkable amenities ~0.75 mi
Loading nearby amenities…
Taxation est. · year 1
- Rental income
- $16,258
- − Mortgage interest
- −$10,923
- − Property taxes
- −$1,754
- − Insurance
- −$975
- − Repairs & maintenance
- −$1,301
- − Management
- −$1,301
- − HOA
- −$1,200
- − Depreciation
- −$5,673
- Taxable loss
- −$6,868
- Est. tax savings @ 24.0%
- +$1,648
- After-tax cash flow
- $-1,708/yr
For passive investors: Depreciation is non-cash, so a rental often shows a tax loss while cash-flowing — sheltering income. Rental losses are passive: they offset passive income freely, and up to $25,000/yr can offset ordinary (W-2) income if you actively participate and your MAGI is under $100k (phasing out to $0 by $150k); unused losses carry forward. On sale, claimed depreciation is recaptured at up to 25%, and gains may owe capital-gains tax (a 1031 exchange can defer both). Figures are a year-1 estimate at your 24.0% rate — not tax advice; consult a CPA.
Schools (NCES district)
- District
- Neches ISD
- NCES district ID
- 4832250
- Math proficiency
- 55% ▲ 10.00%
- Reading proficiency
- 45% ▼ -10.00%
- Median HH income
- $44,165
- Composite
- 44.27/100
- National rank
- #6174
- State rank
- #379 of 1141 in TX
Livability — Frankston
- Score
- 62/100
- State rank
- #918
- US rank
- #16383
Category grades
Schools grade is shown separately in the Schools card above.
Census & demographics
- Population (ZIP)
- 6,319
Population outlook (Anderson County) Hauer SSP2
- Today (2025)
- 56,663 people
- By 2030
- 57,373 · +1.3%
- By 2040
- 58,960 · +4.1%
- By 2050
- 59,073 · +4.3%
- By 2075
- 53,737 · -5.2%
- By 2100
- 42,516 · -25.0%
Race, ethnicity, and origin ACS 2023
- Neighborhood character
- Predominantly White (79%)
- Race & ethnicity
- White 79% Two or more races 10% Hispanic / Latino 8% Black 5%
- Hispanic origin (detail)
- Mexican 7%
- Common ancestry
- Lithuanian 3% Iranian 2% Slovak 1%
- Foreign-born
- 3% · Canada
- Languages at home
- 94% English-only · Spanish 6%
Political lean MEDSL · Anderson
- 2024 margin
- Solid R (+61.8) · D 18.8% · R 80.6%
- 2008→2024 swing
- -18.3pp toward R · 2008: -43.5pp · 2024: -61.8pp
- All cycles
- 2024: R+61.8 2020: R+58.0 2016: R+58.1 2012: R+52.2 2008: R+43.5
Not yet ingested
- Civics
- —
Market trends
- HPI YoY
- ▲ 53.53%
- Current HPI
- 295.14
- Rent YoY
- —
- Metro
- —
- State GDP YoY
- ▲ 3.95%
- F500 in state
- 110
Industry mix (Fortune 500 HQ in TX)
| Industry | F500 HQs | Revenue |
|---|---|---|
| Energy | 16 | $1,198B |
|
||
| Technology | 5 | $198B |
|
||
| Engineering / Construction | 4 | $72B |
|
||
| Energy Services | 3 | $60B |
|
||
| Utilities | 3 | $41B |
|
||
| Healthcare | 2 | $330B |
|
||
Price history
2 events — show timeline
- 2026-05-22 Listed $195,000 GTAR
- 2002-04-24 Sold (Public Records) — Public Records
Property tax history
+1.4%/yrLatest (2025): $1,754 · +2.6% YoY. Source: county tax records.
Cash-flow waterfall
monthlySold comps — $/sqft
last 12 mo · ≤1 miLoading sold comps…