13 Clifford Rd · Mexico, NY
Flood risk 1/10 · Minimal
- FEMA flood zone
- X (unshaded)
- Chance of flooding over 30 yrs
- 0.0%
- Est. flood insurance / yr
- $507 – $1,088
Fire risk 3/10 · Minor
- Est. fire insurance / yr
- $691 – $1,283
Heat risk 2/10 · Minimal
- Hot days now (above 94°F)
- 7 days/yr
- Hot days in 30 yrs
- 16 days/yr
Wind risk 1/10 · Minimal
- Chance of severe wind over 30 yrs
- 1.0%
Air-quality risk 2/10 · Minimal
- Unhealthy air days now
- 1 days/yr
- Unhealthy air days in 30 yrs
- 1 days/yr
Risk factors via First Street. Map © Google.
Why this score? — see what drove the C+ grade
The composite is a weighted blend of 9 inputs, each scored 0–100. Each bar is that input's sub-score; the figure is the points it added to the 100-point composite (weight × sub-score).
- Cash flow +21.0/30.0
- Appreciation +8.4/10.0
- ARV discount +7.5/15.0
- DSCR +6.7/10.0
- 1% rule +5.4/10.0
- Schools +3.3/10.0
- Livability +3.2/5.0
- Rent growth +2.5/5.0
- Condition / age +2.5/5.0
$129,900
🖨 Deal sheet 📄 Offer letter ✓ Due diligence
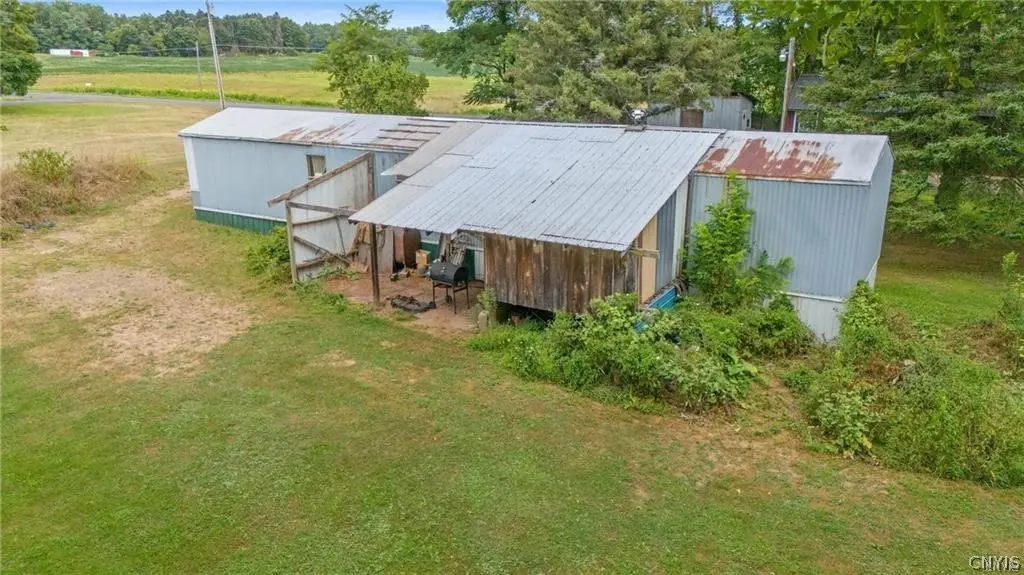
Listing remarks
The single-wide home offers a practical living space surrounded by a mix of open land and wooded areas, giving you the perfect balance of privacy and nature. A newly built structure 32x16 (530 Sq. Ft. )on the property—equipped with electricity—offers endless possibilities. Finishing touches are still needed inside, but the materials are already on hand. Whether you dream of a workshop, home office, studio, or hobby area. Beside it, you’ll find an additional shed for storage and a covered shed area off the back of the trailer for even more convenience. With plenty of room to build your dream home while still keeping useful outbuildings in place, this property offers flexibi
Key facts
- Covered shed area
- Mix of open land
- Wooded areas
Tags
Property features AI
Exterior
- Parking: No garage
- Utilities: Well water; Septic tank
- Home design: Single-wide mobile home; Single-story; Resale condition
- Construction: Aluminum siding
- Exterior features: Gravel driveway; Rural setting; Agricultural and irregular lot
Interior
- Kitchen: Gas oven; Gas range; Refrigerator
- Bedrooms: 2 bedrooms on the main level
- Flooring: Carpet; Vinyl; Varied flooring
- Bathrooms: 1 full bathroom (on main level)
- Heating & cooling: Forced air heating (oil); Window unit cooling
- Interior features: Eat-in kitchen; Separate/formal living room; Bedroom on main level
- Laundry & utility: Main level laundry; Electric water heater
Neighborhood map
What this means for you Summary
Snapshot
- This is a 2-bed/1.0-bath manufactured listed at $130k.
Deal economics
- At list price, monthly cash flow is $183 ($2k/yr) — positive.
- The deal already cash-flows at list — no discount required.
- Meets the 1% rule at list price ($1k rent vs $130k).
- Cap rate 8.0% vs local median 3.1% in Mexico — top-decile yield for the area; either an underpriced asset or a hidden risk that comps aren't pricing in. Stress-test before assuming the spread holds.
Location & tenants
- Location reads 64/100 on livability (#756 in NY) — a middle-class / working-renter tenant base. Strengths: cost of living A+, housing A+, crime A; Watch: amenities F, commute F, health & safety D-.
- Mexico Central School District (rural): math 33% / reading 42% proficiency, ranked #540 of 590 in NY (top 92%) — families likely to look elsewhere, expect single-tenant / working-renter base with shorter leases.
- Market conditions: 115 active listings in the ZIP; 172 units permitted in Oswego County in 2024 (27 in 5+ unit buildings).
Forward outlook
- In year one you build about $10k of equity ($898 loan paydown + $9k appreciation (6.8% local appreciation)).
- Oswego County population projected at -23% by 2050 — secular population decline; favor cash flow + early exit over multi-decade hold.
- At projected returns (6.8% appreciation + 3.0% rent growth), your $36k cash investment doubles in ~3 years — after that, you're playing with house money.
- By year 4, paydown + projected appreciation supports a ~$33k cash-out refi (75% LTV) — recoverable capital for the next deal without selling this one.
Negotiation context
- Only 13 days on market — expect competitive offers; lowballing is unlikely to land.
- 3 sale attempts since 2y ago with the ask held roughly flat each time — persistent listings suggest the price (not the market) is what's stuck; bring a comps-based counter.
Questions for the listing agent
- Is there a deadline driving the sale (1031 exchange, divorce, estate, relocation)? That informs how much negotiation room exists.
- Schools are B-rated — typically a magnet for longer-tenancy family renters. What's the average tenant stay here, and is there a school-zone premium baked into asking?
- What's the average days-on-market for RENTAL listings here right now (not sales)? A rising rental-DOM trend means longer vacancies and softer asking-rent achievability than the comps imply.
- What's the recent tenant-quality profile in this submarket — average credit score on applications, eviction rate, late-payment / NSF rate, and stable-employment percentage? A property-management company in the area should have these aggregated.
- How much new for-sale + rental construction is in the pipeline within 1–3 miles? Heavy new supply typically softens prices + rents 12–24 months out; constrained supply supports both.
Investment metrics
- 1% rule
- 1.04% ✓
- Cap rate
- 7.98%
- Cash-on-cash
- 6.03%
- DSCR
- 1.27
- GRM
- 8.0
CMA / ARV
No comps found within radius.
Projected returns pro-forma
6.75% appreciation · 3.0% rent growth · sell at horizon
- IRR
- 22.0%
- Equity multiple
- 2.51×
- Total profit
- $55,005
- Equity at exit
- $87,868
- IRR
- 20.6%
- Equity multiple
- 5.16×
- Total profit
- $151,432
- Equity at exit
- $164,999
Cash invested: $36,372 (down + closing). Projections, not guarantees.
Landlord ↔ Tenant lean methodology
- Overall (STATE)
- 15 Strongly Tenant-Friendly
- State New York
- 15 Strongly Tenant-Friendly · D+10
- County
- — inherits STATE
- City
- — inherits STATE
ZIP-level market 13069
- Home prices YoY
- 2.3%
- Active inventory
- 115
- Price-to-rent
- 8.0×
Monthly cashflow live
- Estimated rent
- $1,357 medium interval (Pro) →
- Mortgage (P&I)
- −$681
- Tax from tax record
- −$154 /mo · $1,844/yr
- Insurance
- −$54
- HOA
- −$0
- Vacancy / Maint / Mgmt
- −$285
- Net cashflow
- $183
Break-even live
UW: 25.0% down · 7.5% · 30yr · 1.5% tax · 5.0% vac · 8.0% maint · 8.0% mgmt
Financing live
Cash to close
- Down payment
- $32,475
- Closing costs
- $3,897
- Reserves months
- —
- Total cash needed
- —
Loan-product check · same deal, 3 products live
Conventional
25% down · 7.5% · 30yr
- Down + closing
- —
- Monthly P&I
- —
- Monthly cashflow
- —
- DSCR
- —
- Eligible?
- —
Personal DTI + credit; lowest rate.
DSCR
20% down · 8.5% · 30yr
- Down + closing
- —
- Monthly P&I
- —
- Monthly cashflow
- —
- DSCR
- —
- Eligible?
- —
No personal income docs; deal must DSCR.
Hard money
10% down · 12.0% · 12mo
- Down + closing
- —
- Monthly P&I
- —
- Monthly cashflow
- —
- DSCR
- —
- Eligible?
- —
Short-term bridge; refi at stabilization.
Listing history 11 events
-
2026-06-18days on market $129,900 Active 13 DOM
-
2026-06-17days on market $129,900 Active 12 DOM
-
2026-06-16days on market $129,900 Active 11 DOM
-
2026-06-15days on market $129,900 Active 10 DOM
-
2026-06-14days on market $129,900 Active 8 DOM
-
2026-06-13days on market $129,900 Active 7 DOM
-
2026-06-10days on market $129,900 Active 5 DOM
-
2026-06-09days on market $129,900 Active 4 DOM
-
2026-06-08days on market $129,900 Active 3 DOM
-
2026-06-07remarks 681-char remark
-
2026-06-07$129,900 Active 2 DOM
ⓘ Source: listings_history table (triggers on properties + properties_extension) + one-shot
backfill from property_details.listing_events for pre-trigger history.
Tax reassessment forecast NY · Partial reset (capped growth)
- Current annual tax
- $1,844 · $154/mo
- Projected year-2 tax
- $2,020 · $168/mo
- Expected delta
- +$176/yr (+$15/mo · 9.5%)
ⓘ Screening estimate from a state-policy table — verify with the county assessor before closing.
Climate risk First Street
- Flood 1/10 Low FEMA zone X (unshaded) · 0% chance over 30 yrs
- Wildfire 3/10 Moderate
- Heat 2/10 Low 7 d/yr ≥94°F today · 16 d/yr by 30 yrs out
- Wind 1/10 Low 100% chance of damaging wind over 30 yrs
- Air quality 2/10 Low 1 unhealthy d/yr today · 1 by 30 yrs out
Nearby sold comps map
Loading sold comps map…
Walkable amenities ~0.75 mi
Loading nearby amenities…
Taxation est. · year 1
- Rental income
- $16,282
- − Mortgage interest
- −$7,276
- − Property taxes
- −$1,844
- − Insurance
- −$650
- − Repairs & maintenance
- −$1,303
- − Management
- −$1,303
- − Depreciation
- −$3,779
- Taxable income
- $128
- Est. tax owed @ 24.0%
- −$31
- After-tax cash flow
- $2,164/yr
For passive investors: Depreciation is non-cash, so a rental often shows a tax loss while cash-flowing — sheltering income. Rental losses are passive: they offset passive income freely, and up to $25,000/yr can offset ordinary (W-2) income if you actively participate and your MAGI is under $100k (phasing out to $0 by $150k); unused losses carry forward. On sale, claimed depreciation is recaptured at up to 25%, and gains may owe capital-gains tax (a 1031 exchange can defer both). Figures are a year-1 estimate at your 24.0% rate — not tax advice; consult a CPA.
Schools (NCES district)
- District
- Mexico Central School District
- NCES district ID
- 3619170
- Math proficiency
- 33% ▼ -19.00%
- Reading proficiency
- 42% ▲ 1.00%
- Median HH income
- $51,635
- Composite
- 32.55/100
- National rank
- #5691
- State rank
- #540 of 590 in NY
Livability — Mexico
- Score
- 64/100
- State rank
- #756
- US rank
- #14489
Category grades
Schools grade is shown separately in the Schools card above.
Census & demographics
- City population
- 7,313
- Population (ZIP)
- 23,176
Population outlook (Oswego County) Hauer SSP2
- Today (2025)
- 114,465 people
- By 2030
- 109,968 · -3.9%
- By 2040
- 99,205 · -13.3%
- By 2050
- 87,979 · -23.1%
- By 2075
- 65,100 · -43.1%
- By 2100
- 47,117 · -58.8%
Race, ethnicity, and origin ACS 2023
- Neighborhood character
- Predominantly White (93%)
- Race & ethnicity
- White 93% Hispanic / Latino 4% Two or more races 3%
- Common ancestry
- Lithuanian 6% Romanian 6% Iranian 2%
- Foreign-born
- 2% · Canada
- Languages at home
- 96% English-only · Spanish 2% German/W. Germanic 1%
Political lean MEDSL · Oswego
- 2024 margin
- Strong R (+24.2) · D 37.9% · R 62.1%
- 2008→2024 swing
- -26.6pp toward R · 2008: 2.5pp · 2024: -24.2pp
- All cycles
- 2024: R+24.2 2020: R+20.2 2016: R+23.2 2012: D+7.9 2008: D+2.5
Not yet ingested
- Civics
- —
Market trends
- HPI YoY
- ▲ 6.75%
- Current HPI
- 304.443
- Rent YoY
- —
- Metro
- —
- State GDP YoY
- ▲ 2.60%
- F500 in state
- 92
Industry mix (Fortune 500 HQ in NY)
| Industry | F500 HQs | Revenue |
|---|---|---|
| Financial Services | 10 | $950B |
|
||
| Consumer Goods | 9 | $162B |
|
||
| Insurance | 4 | $225B |
|
||
| Telecommunications | 2 | $144B |
|
||
| Pharmaceuticals | 2 | $112B |
|
||
| Media / Entertainment | 2 | $69B |
|
||
Price history
-31.3% since first listed5 events — show timeline
- 2026-06-05 Listed $129,900 CNYIS
- 2025-11-17 Listing Removed — CNYIS
- 2025-08-20 Listed $138,900 CNYIS
- 2024-09-04 Listing Removed — CNYIS
- 2024-06-04 Listed $189,000 CNYIS
Property tax history
+9.3%/yrLatest (2025): $1,844 · +12.1% YoY. Source: county tax records.
Cash-flow waterfall
monthlySold comps — $/sqft
last 12 mo · ≤1 miLoading sold comps…