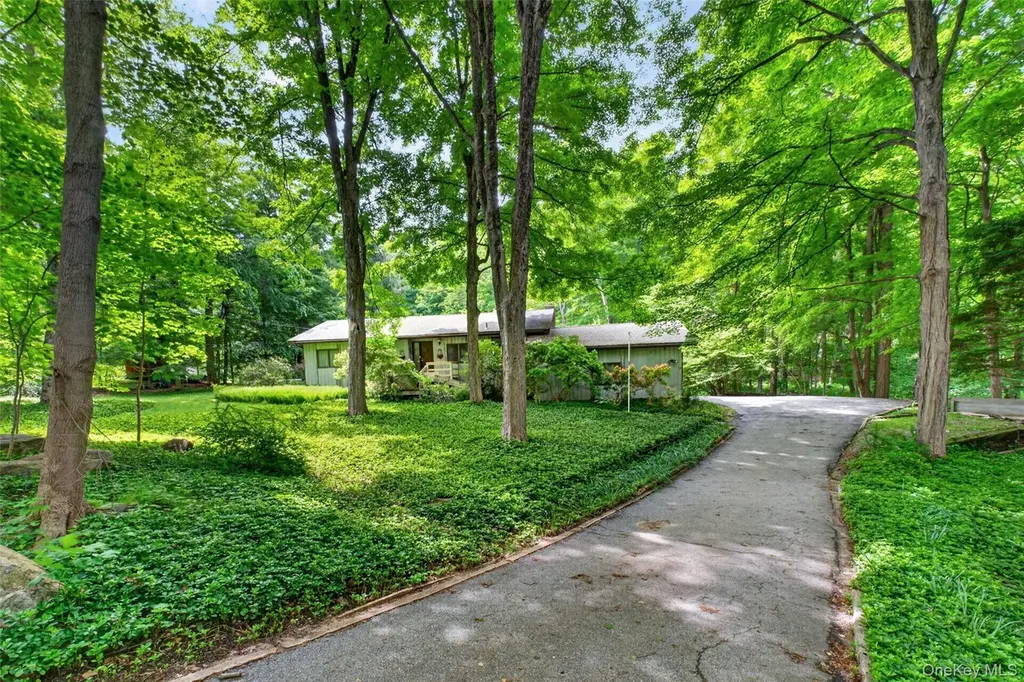
360 Hawley Rd · West Mountain, CT
Flood risk 9/10 · Severe
- FEMA flood zone
- X (unshaded)
- Chance of flooding over 30 yrs
- 0.99%
- Est. flood insurance / yr
- $507 – $1,088
Fire risk 3/10 · Minor
- Est. fire insurance / yr
- $691 – $1,283
Heat risk 4/10 · Minor
- Hot days now (above 98°F)
- 7 days/yr
- Hot days in 30 yrs
- 15 days/yr
Wind risk 4/10 · Minor
- Chance of severe wind over 30 yrs
- 24.0%
Air-quality risk 4/10 · Minor
- Unhealthy air days now
- 3 days/yr
- Unhealthy air days in 30 yrs
- 6 days/yr
Risk factors via First Street. Map © Google.
Why this score? — see what drove the B grade
The composite is a weighted blend of 9 inputs, each scored 0–100. Each bar is that input's sub-score; the figure is the points it added to the 100-point composite (weight × sub-score).
- Cash flow +30.0/30.0
- 1% rule +10.0/10.0
- DSCR +10.0/10.0
- ARV discount +7.5/15.0
- Schools +6.2/10.0
- Rent growth +2.5/5.0
- Livability +2.5/5.0
- Condition / age +2.5/5.0
- Appreciation +0.0/10.0
$699,000
🖨 Deal sheet 📄 Offer letter ✓ Due diligence
Listing remarks
A magical property overlooking scenic Crook Creek on one of North Salem's lovely, picturesque roads. An Incredible opportunity for a builder, or a DIY enthusiast! This comfortable ranch features a Great Room with fireplace, beamed ceiling, wood floors (under carpeting), a dining alcove, open kitchen and sliding doors to deck ~ take a look at the photos of this room both virtually staged and un-staged to appreciate the potential, just amazing! Three bedrooms, 2 baths (one ensuite in the primary) complete the main level. A mid-level room (office/den etc. ) transitions to the downstairs accessory apartment, laundry, storage and workroom. Bonus inclusions are a whole house hard-wired generator
Key facts
- Scenic crook creek
- Dining alcove
- Wood floors
Tags
Property features AI
Exterior
- Parking: Attached garage with garage door opener; Driveway; One garage space; No carport
- Utilities: Electricity connected (NYSEG); Propane available; Water connected; Septic tank; Cable available; Phone available; Trash collection (private)
- Home design: Single family residence; Two levels
- Construction: Wood siding construction
- Exterior features: Wood siding; Not waterfront; Lot features: other / see remarks; Full, partially finished walk-out basement with storage
Interior
- Kitchen: Dishwasher; Electric range; Refrigerator; Open kitchen
- Bedrooms: Bedroom on the first floor
- Flooring: Hardwood; Wood; Carpet; Combination flooring
- Bathrooms: Three full bathrooms
- Heating & cooling: Electric heating; No central cooling
- Interior features: First-floor bedroom and full bath; Beamed ceilings; Built-in features; Cathedral ceilings; Entrance foyer; In-law floorplan / master on main; Open floorplan with open kitchen; Primary bathroom; Storage; Deck
- Laundry & utility: Washer and dryer; Laundry located in the basement; Electric water heater
Neighborhood map
What this means for you Summary
Snapshot
- This is a 4-bed/3.0-bath single-family listed at $699k.
Deal economics
- At list price, monthly cash flow is $8k ($90k/yr) — positive.
- The deal already cash-flows at list — no discount required.
- Meets the 1% rule at list price ($16k rent vs $699k).
- Cap rate 19.3% vs local median 3.1% in West Mountain — top-decile yield for the area; either an underpriced asset or a hidden risk that comps aren't pricing in. Stress-test before assuming the spread holds.
Location & tenants
- Location reads: area grade B — affects rentability + tenant quality, not the cash-flow math above.
- North Salem Central School District (rural): math 57% / reading 74% proficiency, ranked #125 of 590 in NY (top 21%) — acceptable for families but not a draw, mixed tenant base, ~2y average lease; only 6% free/reduced lunch — higher-income household profile.
- Zoned schools: Pequenakonck Elementary School (math 47% / reading 72%, grade B-, #745 of 2,108 statewide, top 39%, 438 students, 16% FRL); North Salem Middle School/High School (math 67% / reading 78%, grade B+, #671 of 1,100 statewide, top 61%, 547 students, 20% FRL).
- Market conditions: 3 comparable units currently listed for rent nearby; rentals leasing fast (median 3d on market — plan ~1-2 weeks tenant-placement turnaround); 954 units permitted in Westchester County in 2024 (649 in 5+ unit buildings).
Forward outlook
- Local home prices are declining (-3.0%/yr); year-one equity from $5k of loan paydown is wiped out by about $21k of value loss. Plan a longer hold.
- Westchester County population projected at +10% by 2050 — modest demand growth; plan on rents tracking national, not racing it.
- At projected returns (-3.0% appreciation + 3.0% rent growth), your $196k cash investment doubles in ~3 years — after that, you're playing with house money.
Negotiation context
- Only 10 days on market — expect competitive offers; lowballing is unlikely to land.
Risks & watch-outs
- Watch-outs: flood insurance adds $66/mo.
- Climate carrying-cost: severe flood risk — expect insurance premiums to compound above CPI over the hold.
Questions for the listing agent
- Built in 1970 — when were the roof, HVAC, electrical panel, plumbing, and water heater last replaced?
- What's the actual annual flood-insurance premium (NFIP or private), and is the property in a SFHA with mandatory coverage?
- Is there a deadline driving the sale (1031 exchange, divorce, estate, relocation)? That informs how much negotiation room exists.
- What's the average days-on-market for RENTAL listings here right now (not sales)? A rising rental-DOM trend means longer vacancies and softer asking-rent achievability than the comps imply.
- What's the recent tenant-quality profile in this submarket — average credit score on applications, eviction rate, late-payment / NSF rate, and stable-employment percentage? A property-management company in the area should have these aggregated.
- How much new for-sale + rental construction is in the pipeline within 1–3 miles? Heavy new supply typically softens prices + rents 12–24 months out; constrained supply supports both.
Investment metrics
- 1% rule
- 2.26% ✓
- Cap rate
- 19.30%
- Cash-on-cash
- 46.45%
- DSCR
- 3.07
- GRM
- 3.7
CMA / ARV
No comps found within radius.
Projected returns pro-forma
-3.0% appreciation · 3.0% rent growth · sell at horizon
- IRR
- 43.3%
- Equity multiple
- 2.87×
- Total profit
- $365,330
- Equity at exit
- $104,223
- IRR
- 49.3%
- Equity multiple
- 5.78×
- Total profit
- $935,288
- Equity at exit
- $60,437
Cash invested: $195,720 (down + closing). Projections, not guarantees.
Landlord ↔ Tenant lean methodology
- Overall (STATE)
- 27 Tenant-Leaning
- State Connecticut
- 27 Tenant-Leaning · D+7
- County
- — inherits STATE
- City
- — inherits STATE
ZIP-level market 10560
- Home prices YoY
- -19.7%
- Price-to-rent
- 3.7×
Monthly cashflow live
- Estimated rent
- $15,793 medium interval (Pro) →
- Mortgage (P&I)
- −$3,666
- Tax from tax record
- −$943 /mo · $11,321/yr
- Insurance
- −$291
- Flood insurance flood zone
- −$66 /mo · $798/yr
- HOA
- −$0
- Vacancy / Maint / Mgmt
- −$3,316
- Net cashflow
- $7,509
Break-even live
UW: 25.0% down · 7.5% · 30yr · 1.5% tax · 5.0% vac · 8.0% maint · 8.0% mgmt
Financing live
Cash to close
- Down payment
- $174,750
- Closing costs
- $20,970
- Reserves months
- —
- Total cash needed
- —
Loan-product check · same deal, 3 products live
Conventional
25% down · 7.5% · 30yr
- Down + closing
- —
- Monthly P&I
- —
- Monthly cashflow
- —
- DSCR
- —
- Eligible?
- —
Personal DTI + credit; lowest rate.
DSCR
20% down · 8.5% · 30yr
- Down + closing
- —
- Monthly P&I
- —
- Monthly cashflow
- —
- DSCR
- —
- Eligible?
- —
No personal income docs; deal must DSCR.
Hard money
10% down · 12.0% · 12mo
- Down + closing
- —
- Monthly P&I
- —
- Monthly cashflow
- —
- DSCR
- —
- Eligible?
- —
Short-term bridge; refi at stabilization.
Rent comps 3 comps
| Address | Beds | Baths | Sqft | Rent | $/sqft | DOM | Units | Dist |
|---|---|---|---|---|---|---|---|---|
| 24 Cove Rd South Salem, NY | 3.0 | 2.0 | 1600 | $18,000 | $11.25 | 3d | 1 | 1.04mi |
| 34 Twin Lakes Rd South Salem, NY | 3.0 | 2.0 | 1866 | $15,000 | $8.04 | 3d | 1 | 1.32mi |
| 49 Twin Lakes Rd South Salem, NY | 3.0 | 3.0 | 2435 | $14,000 | $5.75 | 3d | 1 | 1.42mi |
Listing history 9 events
-
2026-06-18days on market $699,000 Active 10 DOM
-
2026-06-17days on market $699,000 Active 9 DOM
-
2026-06-16days on market $699,000 Active 8 DOM
-
2026-06-15days on market $699,000 Active 7 DOM
-
2026-06-13days on market $699,000 Active 5 DOM
-
2026-06-13days on market $699,000 Active 4 DOM
-
2026-06-10days on market $699,000 Active 2 DOM
-
2026-06-08remarks 699-char remark
-
2026-06-08$699,000 Active 1 DOM
ⓘ Source: listings_history table (triggers on properties + properties_extension) + one-shot
backfill from property_details.listing_events for pre-trigger history.
Tax reassessment forecast CT · Partial reset (capped growth)
- Current annual tax
- $11,321 · $943/mo
- Projected year-2 tax
- $13,140 · $1,095/mo
- Expected delta
- +$1,819/yr (+$152/mo · 16.1%)
ⓘ Screening estimate from a state-policy table — verify with the county assessor before closing.
Climate risk First Street
- Flood 9/10 Extreme FEMA zone X (unshaded) · 99% chance over 30 yrs
- Wildfire 3/10 Moderate
- Heat 4/10 Moderate 7 d/yr ≥98°F today · 15 d/yr by 30 yrs out
- Wind 4/10 Moderate 24% chance of damaging wind over 30 yrs
- Air quality 4/10 Moderate 3 unhealthy d/yr today · 6 by 30 yrs out
Nearby sold comps map
Loading sold comps map…
Walkable amenities ~0.75 mi
Loading nearby amenities…
Taxation est. · year 1
- Rental income
- $189,510
- − Mortgage interest
- −$39,155
- − Property taxes
- −$11,321
- − Insurance
- −$4,292
- − Repairs & maintenance
- −$15,161
- − Management
- −$15,161
- − Depreciation
- −$20,335
- Taxable income
- $84,086
- Est. tax owed @ 24.0%
- −$20,181
- After-tax cash flow
- $69,932/yr
For passive investors: Depreciation is non-cash, so a rental often shows a tax loss while cash-flowing — sheltering income. Rental losses are passive: they offset passive income freely, and up to $25,000/yr can offset ordinary (W-2) income if you actively participate and your MAGI is under $100k (phasing out to $0 by $150k); unused losses carry forward. On sale, claimed depreciation is recaptured at up to 25%, and gains may owe capital-gains tax (a 1031 exchange can defer both). Figures are a year-1 estimate at your 24.0% rate — not tax advice; consult a CPA.
Schools (NCES district)
- District
- North Salem Central School District
- NCES district ID
- 3621180
- Math proficiency
- 57% ▼ -9.00%
- Reading proficiency
- 74% ▲ 9.00%
- Median HH income
- $113,800
- Composite
- 61.67/100
- National rank
- #743
- State rank
- #125 of 590 in NY
Livability — West Mountain
No livability data for this city. (Only ~50 U.S. cities are tracked.)
Census & demographics
- Population (ZIP)
- 4,914
Population outlook (Westchester County) Hauer SSP2
- Today (2025)
- 1,028,035 people
- By 2030
- 1,051,636 · +2.3%
- By 2040
- 1,098,520 · +6.9%
- By 2050
- 1,136,044 · +10.5%
- By 2075
- 1,196,925 · +16.4%
- By 2100
- 1,175,147 · +14.3%
Race, ethnicity, and origin ACS 2023
- Neighborhood character
- Predominantly White (82%)
- Race & ethnicity
- White 82% Hispanic / Latino 10% Two or more races 7% Asian 2%
- Hispanic origin (detail)
- Mexican 3% Puerto Rican 1%
- Common ancestry
- Lithuanian 5% Romanian 3% Subsaharan African 2%
- Foreign-born
- 12% · Canada, China, Jamaica
- Languages at home
- 84% English-only · Other Indo-European 6% Spanish 6% Chinese 1%
Political lean MEDSL · Westchester
- 2024 margin
- Strong D (+26.3) · D 63.1% · R 36.9%
- 2008→2024 swing
- -1.3pp toward R · 2008: 27.6pp · 2024: 26.3pp
- All cycles
- 2024: D+26.3 2020: D+36.3 2016: D+32.8 2012: D+22.2 2008: D+27.6
Not yet ingested
- Civics
- —
Market trends
- HPI YoY
- ▼ -47.90%
- Current HPI
- 195.4268
- Rent YoY
- —
- Metro
- —
- State GDP YoY
- ▲ 1.06%
- F500 in state
- 38
Industry mix (Fortune 500 HQ in CT)
| Industry | F500 HQs | Revenue |
|---|---|---|
| Industrial Machinery | 4 | $38B |
|
||
| Insurance | 3 | $71B |
|
||
| Financial Services | 2 | $25B |
|
||
| Transportation / Logistics | 2 | $18B |
|
||
| Healthcare | 1 | $247B |
|
||
| Telecommunications | 1 | $55B |
|
||
Price history
1 event — show timeline
- 2026-05-18 Listed $699,000 OneKey® MLS as Distributed by MLS Grid
Property tax history
+2.1%/yrLatest (2025): $11,321 · +2.5% YoY. Source: county tax records.
Cash-flow waterfall
monthlySold comps — $/sqft
last 12 mo · ≤1 miLoading sold comps…