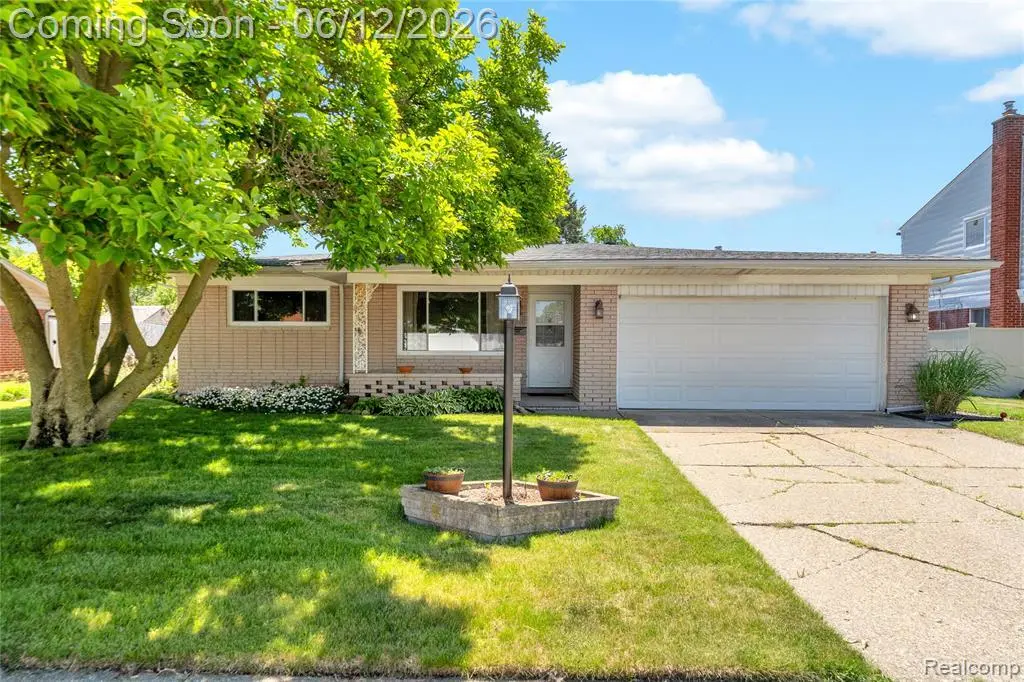
4840 Iowa Dr · Warren, MI
Flood risk 1/10 · Minimal
- FEMA flood zone
- X (unshaded)
- Chance of flooding over 30 yrs
- 0.0%
- Est. flood insurance / yr
- $473 – $860
Fire risk 1/10 · Minimal
- Est. fire insurance / yr
- $784 – $1,456
Heat risk 3/10 · Minor
- Hot days now (above 97°F)
- 7 days/yr
- Hot days in 30 yrs
- 15 days/yr
Wind risk 1/10 · Minimal
- Chance of severe wind over 30 yrs
- —
Air-quality risk 3/10 · Minor
- Unhealthy air days now
- 3 days/yr
- Unhealthy air days in 30 yrs
- 5 days/yr
Risk factors via First Street. Map © Google.
Why this score? — see what drove the D grade
The composite is a weighted blend of 9 inputs, each scored 0–100. Each bar is that input's sub-score; the figure is the points it added to the 100-point composite (weight × sub-score).
- Cash flow +12.5/30.0
- ARV discount +10.0/15.0
- Rent growth +4.5/5.0
- DSCR +3.7/10.0
- Livability +3.7/5.0
- 1% rule +3.5/10.0
- Schools +2.5/10.0
- Condition / age +2.5/5.0
- Appreciation +0.0/10.0
$235,000
🖨 Deal sheet 📄 Offer letter ✓ Due diligence
Listing remarks
* * * MULTIPLE OFFERS RECEIVED. HIGHEST AND BEST DUE SUNDAY, MAY 14TH BY 7PM * * * Charming brick ranch with great curb appeal, an attached garage, and a functional layout ready for its next owner. Step inside to a spacious living area with vaulted ceilings, a cozy fireplace, and an open layout to the dining room and kitchen, creating an easy flow for everyday living and entertaining. The main level features hardwood flooring, generous natural light, and comfortable bedrooms with plenty of potential to personalize. The kitchen offers ample cabinet space and stainless steel appliances. Downstairs, the basement provides excellent additional storage, workspace, or future finishing potentia
Key facts
- Hardwood flooring
- Attached garage
- Spacious living area
Tags
Property features AI
Exterior
- Parking: Attached 2-car garage with garage door opener
- Utilities: Public water; Natural gas for heating and water heater; Public utilities available
- Home design: One-story residential home; Built in 1963; Basement foundation
- Construction: Brick construction; Basement foundation; Year built: 1963
- Exterior features: Brick exterior; Fenced yard; Patio; Shed (outbuilding)
Interior
- Kitchen: Kitchen (Entry): 12 x 11, linoleum flooring; Appliances included: Dishwasher, Range/Oven, Refrigerator, Disposal
- Bedrooms: Bedroom 1 (Entry): 13 x 11, wood floors; Bedroom 2 (Entry): 10 x 10, carpet; Bedroom 3 (Entry): approx. 9' wide, wood floors; Total of 9 rooms
- Flooring: Wood flooring in living room and multiple bedrooms; Carpet in great room and one bedroom; Linoleum in kitchen and dining room; Ceramic and laminate in bathrooms
- Bathrooms: One full bathroom and one lavatory (2 total); Main bathroom (Entry): approximately 11 x 7, ceramic flooring; Lavatory (Entry): approximately 4 x 6, laminate flooring
- Heating & cooling: Forced air heating (natural gas); Central air conditioning; Ceiling fans
- Interior features: Fireplace in family room; Unfinished basement
- Laundry & utility: Washer and Dryer included; Gas water heater
Neighborhood map
What this means for you Summary
Snapshot
- This is a 3-bed/1.5-bath single-family listed at $235k.
Deal economics
- At list price, monthly cash flow is $-35 ($-416/yr) — negative.
- To cash-flow at today's rent, offer at most $229k (2.6% below list).
- To meet the 1% rule (rent ≥ 1% of price), the offer needs to be $200k (14.7% below list).
- Recommended offer: $200k (14.7% below list) — sets the bar for 1% rule.
Location & tenants
- Location reads 74/100 on livability (#171 in MI, #4,491 nationally) — a middle-class / working-renter tenant base. Strengths: commute A+, cost of living A+, housing A+; Watch: schools D, amenities D, employment D.
- Warren Consolidated Schools (urban): math 18% / reading 39% proficiency, ranked #373 of 540 in MI (top 69%) — low school quality limits family demand, transient renter base, plan for 1-2y turnover.
- Market conditions: Rents rising fast (+8.0%/yr); 96 active listings in the ZIP; 10 comparable units currently listed for rent nearby; rentals at typical pace (median 25d on market — plan ~3-4 weeks tenant-placement turnaround); 40% of comp listings sitting > 30 days — soft ceiling on asking rent; 1,321 units permitted in Macomb County in 2024 (86 in 5+ unit buildings).
- This rent runs 33% of the median local income ($74k/yr) — at the standard rent-burdened threshold; future hikes will face affordability resistance.
Forward outlook
- Local home prices are declining (-3.0%/yr); year-one equity from $2k of loan paydown is wiped out by about $7k of value loss. Plan a longer hold.
- Macomb County population projected at +9% by 2050 — modest demand growth; plan on rents tracking national, not racing it.
Negotiation context
- Only 5 days on market — expect competitive offers; lowballing is unlikely to land.
- Current owner paid $40k; list at $235k implies a 488% gain — meaningful room to come down on a strong offer.
Questions for the listing agent
- What do current leases actually rent for vs. the listed asking? Can we see a recent rent roll and the last 12 months of T-12 income?
- Built in 1963 — when were the roof, HVAC, electrical panel, plumbing, and water heater last replaced?
- Is there a deadline driving the sale (1031 exchange, divorce, estate, relocation)? That informs how much negotiation room exists.
- Schools are D-rated, which usually means shorter tenancies and higher turnover. Who's the typical renter profile here, and what's been the actual vacancy rate?
- Crime grade is D in this area — have there been break-ins, vandalism, or insurance claims at this property in the last 3 years? What carrier currently insures it and at what premium?
- The area grade is low — what's the realistic commute time and amenity access for the typical tenant pool here? Any planned neighborhood developments (good or bad) we should know about?
- What's the average days-on-market for RENTAL listings here right now (not sales)? A rising rental-DOM trend means longer vacancies and softer asking-rent achievability than the comps imply.
- What's the recent tenant-quality profile in this submarket — average credit score on applications, eviction rate, late-payment / NSF rate, and stable-employment percentage? A property-management company in the area should have these aggregated.
- How much new for-sale + rental construction is in the pipeline within 1–3 miles? Heavy new supply typically softens prices + rents 12–24 months out; constrained supply supports both.
Investment metrics
- 1% rule
- 0.85% ✗
- Cap rate
- 6.12%
- Cash-on-cash
- -0.63%
- DSCR
- 0.97
- GRM
- 9.8
CMA / ARV
- ARV (on-the-fly)
- $248,634
- Comps found
- 12
Show comp detail 12 sales within ~0.75 mi
| Address | Dist | Beds/Ba | Sqft | Sold | Price | $/sf | Match |
|---|---|---|---|---|---|---|---|
| 3858 Hughes Dr | 0.51mi | 3/1.5 | 1,455 (+0%) | 2mo | $251,000 | $173 | 74 |
| 30945 Cousino Dr | 0.25mi | 3/2.0 | 1,404 (-3%) | 8mo | $305,000 | $217 | 73 |
| 4519 Reader Dr | 0.49mi | 3/1.5 | 1,501 (+3%) | 2mo | $240,000 | $160 | 70 |
| 4749 Lutz Dr | 0.40mi | 3/1.5 | 1,562 (+7%) | 4mo | $298,000 | $191 | 66 |
| 4609 Hayman Dr | 0.51mi | 3/1.5 | 1,506 (+4%) | 6mo | $290,000 | $193 | 65 |
| 4852 Burberry Dr | 0.23mi | 3/2.0 | 1,650 (+14%) | 5mo | $329,500 | $200 | 60 |
| 29415 Cunningham Dr | 0.47mi | 3/1.5 | 1,316 (-10%) | 9mo | $225,000 | $171 | 55 |
| 5120 Canterbury Ln | 0.44mi | 3/1.5 | 1,628 (+12%) | 13mo | $242,500 | $149 | 48 |
| 3420 Kevin Cir | 0.72mi | 3/2.0 | 1,629 (+12%) | 2mo | $267,500 | $164 | 43 |
| 4477 Holmes Dr | 0.59mi | 3/1.0 | 1,619 (+11%) | 13mo | $200,500 | $124 | 41 |
| 29012 Red Maple Dr | 0.69mi | 3/1.0 | 1,619 (+11%) | 12mo | $250,000 | $154 | 37 |
| 5010 Kelly Dr | 0.71mi | 3/2.0 | 1,651 (+14%) | 10mo | $269,000 | $163 | 34 |
Match score weights: distance 35% · size 25% · config 20% · recency 20%. Top-matched comps best support the ARV.
Projected returns pro-forma
-3.0% appreciation · 8.0% rent growth · sell at horizon
- IRR
- -11.9%
- Equity multiple
- 0.55×
- Total profit
- $-29,671
- Equity at exit
- $35,039
- IRR
- 3.4%
- Equity multiple
- 1.30×
- Total profit
- $19,635
- Equity at exit
- $20,319
Cash invested: $65,800 (down + closing). Projections, not guarantees.
Landlord ↔ Tenant lean methodology
- Overall (STATE)
- 62 Landlord-Friendly
- State Michigan
- 62 Landlord-Friendly · EVEN
- County
- — inherits STATE
- City
- — inherits STATE
ZIP-level market 48092
- Rents YoY
- 8.0%
- Active inventory
- 96
- Price-to-rent
- 9.8×
Monthly cashflow live
- Estimated rent
- $2,004 high interval (Pro) →
- Mortgage (P&I)
- −$1,232
- Tax from tax record
- −$288 /mo · $3,454/yr
- Insurance
- −$98
- HOA
- −$0
- Vacancy / Maint / Mgmt
- −$421
- Net cashflow
- $-35
Break-even live
UW: 25.0% down · 7.5% · 30yr · 1.5% tax · 5.0% vac · 8.0% maint · 8.0% mgmt
Financing live
Cash to close
- Down payment
- $58,750
- Closing costs
- $7,050
- Reserves months
- —
- Total cash needed
- —
Loan-product check · same deal, 3 products live
Conventional
25% down · 7.5% · 30yr
- Down + closing
- —
- Monthly P&I
- —
- Monthly cashflow
- —
- DSCR
- —
- Eligible?
- —
Personal DTI + credit; lowest rate.
DSCR
20% down · 8.5% · 30yr
- Down + closing
- —
- Monthly P&I
- —
- Monthly cashflow
- —
- DSCR
- —
- Eligible?
- —
No personal income docs; deal must DSCR.
Hard money
10% down · 12.0% · 12mo
- Down + closing
- —
- Monthly P&I
- —
- Monthly cashflow
- —
- DSCR
- —
- Eligible?
- —
Short-term bridge; refi at stabilization.
Rent comps 10 comps
| Address | Beds | Baths | Sqft | Rent | $/sqft | DOM | Units | Dist |
|---|---|---|---|---|---|---|---|---|
| 29745 Fox Run Cir Warren, MI | 3.0 | 2.0 | 1487 | $2,200 | $1.48 | 44d | 1 | 0.37mi |
| 4473 Buchanan Ave Warren, MI | 3.0 | 1.5 | 1064 | $1,650 | $1.55 | 24d | 1 | 0.54mi |
| 31499 Mound Rd Warren, MI | 1.0–2.0 | 1.0 | 900 | $1,413 | $1.57 | 3d | 5 | 0.67mi |
| 31779 Ryan Rd Warren, MI | 3.0 | 1.0 | 1200 | $1,800 | $1.50 | 44d | 1 | 0.89mi |
| 28439 Wexford Dr Warren, MI | 3.0 | 1.5 | 1253 | $2,099 | $1.68 | 24d | 1 | 1.16mi |
| 32725 Grinsell Dr Warren, MI | 4.0 | 2.0 | 1057 | $2,000 | $1.89 | 44d | 1 | 1.24mi |
| 27592 Strathmoor Dr Warren, MI | 4.0 | 1.5 | 1809 | $2,295 | $1.27 | 44d | 1 | 1.36mi |
| 29408 Dequindre Rd Unit 203 Warren, MI | 2.0 | 1.0 | 900 | $1,145 | $1.27 | 5d | 1 | 1.39mi |
| 29336 Dequindre Rd Unit 103 Warren, MI | 2.0 | 1.0 | 900 | $1,245 | $1.38 | 5d | 1 | 1.49mi |
| 28222 Saint Louise Dr Warren, MI | 3.0 | 2.0 | 1600 | $5,500 | $3.44 | 2d | 1 | 1.49mi |
Listing history 6 events
-
2026-06-17status $235,000 Pending 5 DOM
-
2026-06-16days on market $235,000 Active 5 DOM
-
2026-06-15days on market $235,000 Active 4 DOM
-
2026-06-13statusdays on market $235,000 Active 2 DOM
-
2026-06-10remarks 699-char remark
-
2026-06-10$235,000 Coming Soon 1 DOM
ⓘ Source: listings_history table (triggers on properties + properties_extension) + one-shot
backfill from property_details.listing_events for pre-trigger history.
Tax reassessment forecast MI · Partial reset (capped growth)
- Current annual tax
- $3,454 · $288/mo
- Projected year-2 tax
- $3,536 · $295/mo
- Expected delta
- +$83/yr (+$7/mo · 2.4%)
ⓘ Screening estimate from a state-policy table — verify with the county assessor before closing.
Climate risk First Street
- Flood 1/10 Low FEMA zone X (unshaded) · 0% chance over 30 yrs
- Wildfire 1/10 Low
- Heat 3/10 Moderate 7 d/yr ≥97°F today · 15 d/yr by 30 yrs out
- Wind 1/10 Low
- Air quality 3/10 Moderate 3 unhealthy d/yr today · 5 by 30 yrs out
Nearby sold comps map
Loading sold comps map…
Walkable amenities ~0.75 mi
Loading nearby amenities…
Taxation est. · year 1
- Rental income
- $24,051
- − Mortgage interest
- −$13,164
- − Property taxes
- −$3,454
- − Insurance
- −$1,175
- − Repairs & maintenance
- −$1,924
- − Management
- −$1,924
- − Depreciation
- −$6,836
- Taxable loss
- −$4,425
- Est. tax savings @ 24.0%
- +$1,062
- After-tax cash flow
- $646/yr
For passive investors: Depreciation is non-cash, so a rental often shows a tax loss while cash-flowing — sheltering income. Rental losses are passive: they offset passive income freely, and up to $25,000/yr can offset ordinary (W-2) income if you actively participate and your MAGI is under $100k (phasing out to $0 by $150k); unused losses carry forward. On sale, claimed depreciation is recaptured at up to 25%, and gains may owe capital-gains tax (a 1031 exchange can defer both). Figures are a year-1 estimate at your 24.0% rate — not tax advice; consult a CPA.
Schools (NCES district)
- District
- Warren Consolidated Schools
- NCES district ID
- 2635190
- Math proficiency
- 18% ▼ -14.00%
- Reading proficiency
- 39% ▼ -8.00%
- Median HH income
- $52,259
- Composite
- 25.09/100
- National rank
- #7533
- State rank
- #373 of 540 in MI
Livability — Warren
- Score
- 74/100
- State rank
- #171
- US rank
- #4491
Category grades
Schools grade is shown separately in the Schools card above.
Census & demographics
- Census place
- Warren, MI
- County
- Macomb County · 638,552 people
- City population
- 114,937
- Metro
- Detroit-Warren-Dearborn, MI
- Population (ZIP)
- 27,374
- Household income
- $73,808
- Rent vs Own
- Severe rent burden
- 675.0
Population outlook (Macomb County) Hauer SSP2
- Today (2025)
- 925,296 people
- By 2030
- 948,226 · +2.5%
- By 2040
- 983,961 · +6.3%
- By 2050
- 1,010,200 · +9.2%
- By 2075
- 1,076,222 · +16.3%
- By 2100
- 1,077,065 · +16.4%
Race, ethnicity, and origin ACS 2023
- Neighborhood character
- Diverse neighborhood (Simpson 0.55)
- Race & ethnicity
- White 63% Asian 17% Black 14% Two or more races 4% Hispanic / Latino 2%
- Common ancestry
- Romanian 10% Arab 4% Subsaharan African 2%
- Foreign-born
- 22% · Vietnam, Canada, China
- Languages at home
- 70% English-only · Other Indo-European 11% Arabic 5% Russian/Polish/Slavic 3%
Political lean MEDSL · Macomb
- 2024 margin
- R (+13.7) · D 42.2% · R 55.9% · Other 1.9%
- 2008→2024 swing
- -22.3pp toward R · 2008: 8.6pp · 2024: -13.7pp
- All cycles
- 2024: R+13.7 2020: R+8.1 2016: R+11.6 2012: D+4.0 2008: D+8.6
Not yet ingested
- Civics
- —
Market trends
- HPI YoY
- ▼ -262.85%
- Current HPI
- 189.7524
- Rent YoY
- ▲ 8.03%
- Metro
- Detroit-Warren-Dearborn, MI
- State GDP YoY
- ▲ 1.37%
- F500 in state
- 28
Industry mix (Fortune 500 HQ in MI)
| Industry | F500 HQs | Revenue |
|---|---|---|
| Automotive Parts | 3 | $48B |
|
||
| Automotive | 2 | $372B |
|
||
| Chemicals | 1 | $45B |
|
||
| Automotive Retail | 1 | $29B |
|
||
| Healthcare / Medical Devices | 1 | $23B |
|
||
| Automotive Technology | 1 | $20B |
|
||
Price history
+487.5% since first listed2 events — show timeline
- 2026-06-09 Coming Soon $235,000 MiRealSource-MiMLS
- 1994-05-16 Sold (Public Records) $40,000 Public Records
Property tax history
+2.0%/yrLatest (2025): $3,454 · +2.2% YoY. Source: county tax records.
Cash-flow waterfall
monthlySold comps — $/sqft
last 12 mo · ≤1 miLoading sold comps…